Transient Analysis Summary
Summary of the Input Information
- T0: 584144824.567999959 [MET] (2019-07-06T22:26:41.344 UTC)
- Search time window: T0 +/- 100.0 s
- Input source: RA=0.0, DEC=0.0 (source location is randomly seleected, since the true location is unknown.)
- Input image: /local/data/bat2/batusers/batgroup/BAT_GW/results/S190706ai/bayestar.fits.gz
FOV Check
- The input source is out of the BAT FOV
- The input image does not overlaps with the BAT FOV
- Max probability in LIGO map: 4.290415553682487e-05
- Sum of (BAT pcode)*(LIGO probability) of the entire LIGO map: 0.0014554355696705344
- The integrated LIGO localization probability that are in BAT FOV (with pcode > 10%): 0.004083465425660226
- The integrated probability of Phil's convolved map that are in BAT FOV (with pcode > 10%): 0.018357068889901403
- The integrated LIGO localization probability that are outside of the BAT FOV (with pcode > 10%) but above the Earth's limb: 0.6811593333661868
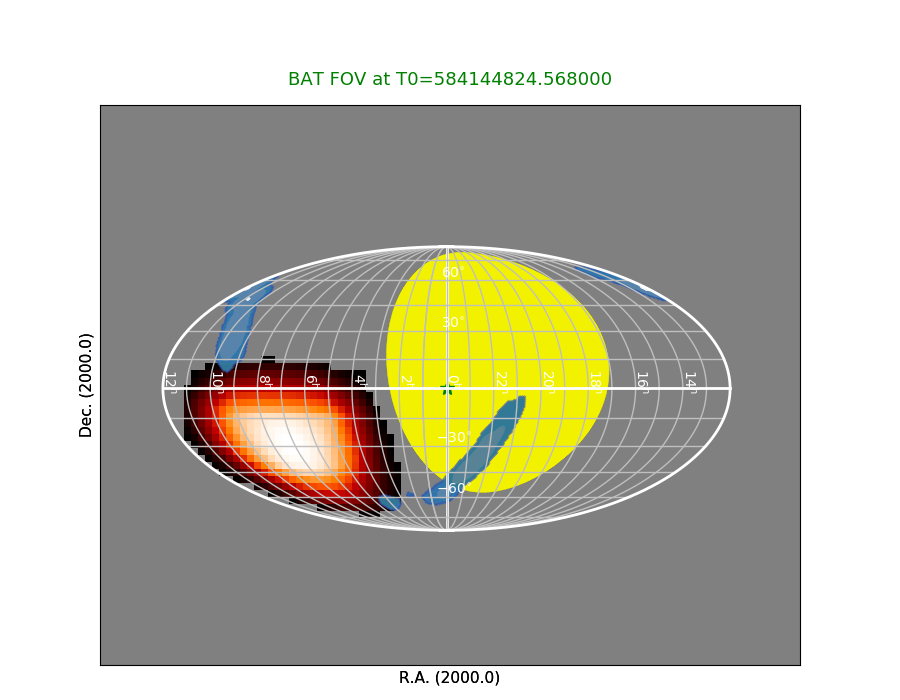 RED: BAT FOV (the brighter/whiter color refers to higher partial coding fraction).
YELLOW: Earth
BLUE: LIGO probability map
GREEN STAR: Input source (location is randomly seleected unless the true source location is available.)
RED: BAT FOV (the brighter/whiter color refers to higher partial coding fraction).
YELLOW: Earth
BLUE: LIGO probability map
GREEN STAR: Input source (location is randomly seleected unless the true source location is available.)
Click here for the BAT GCN circular template
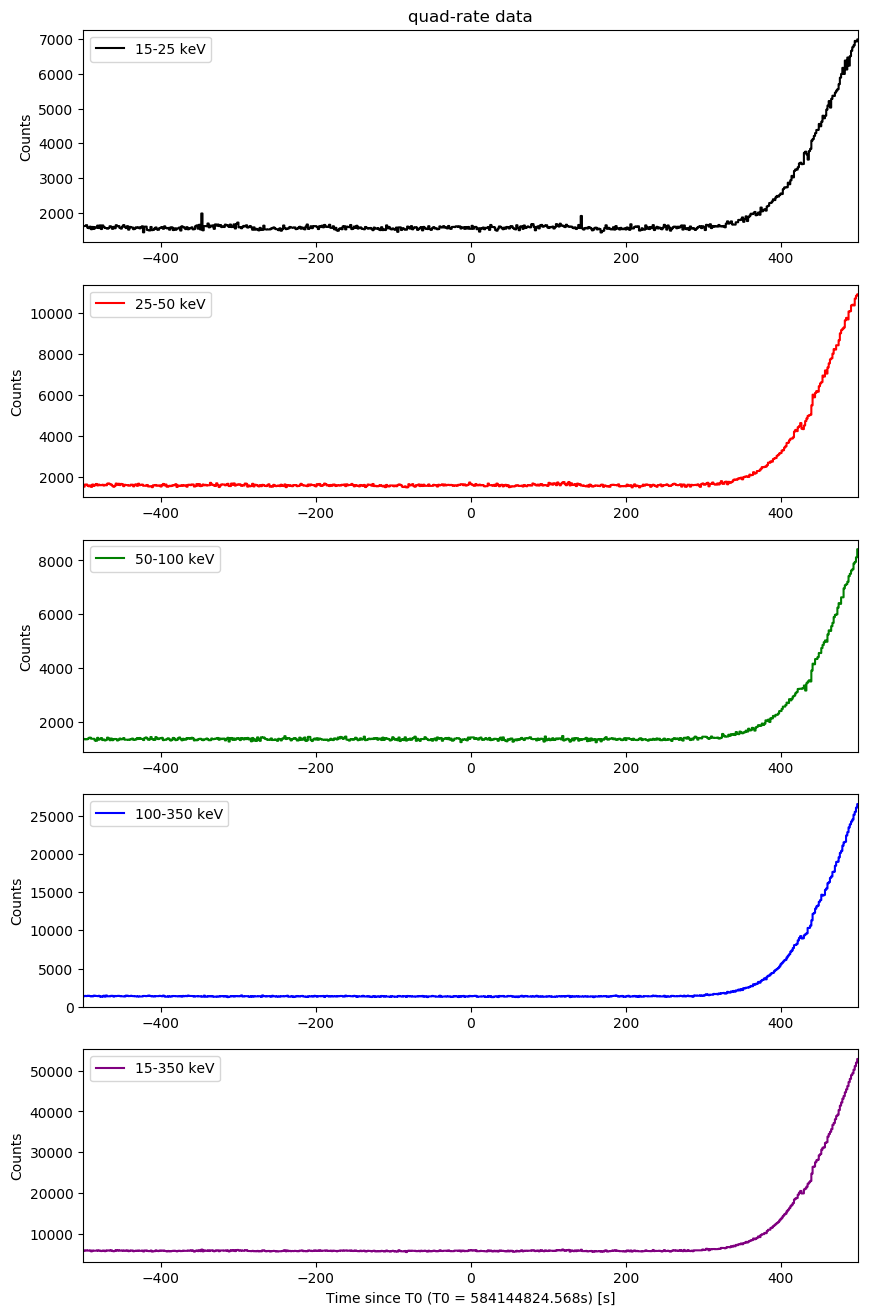
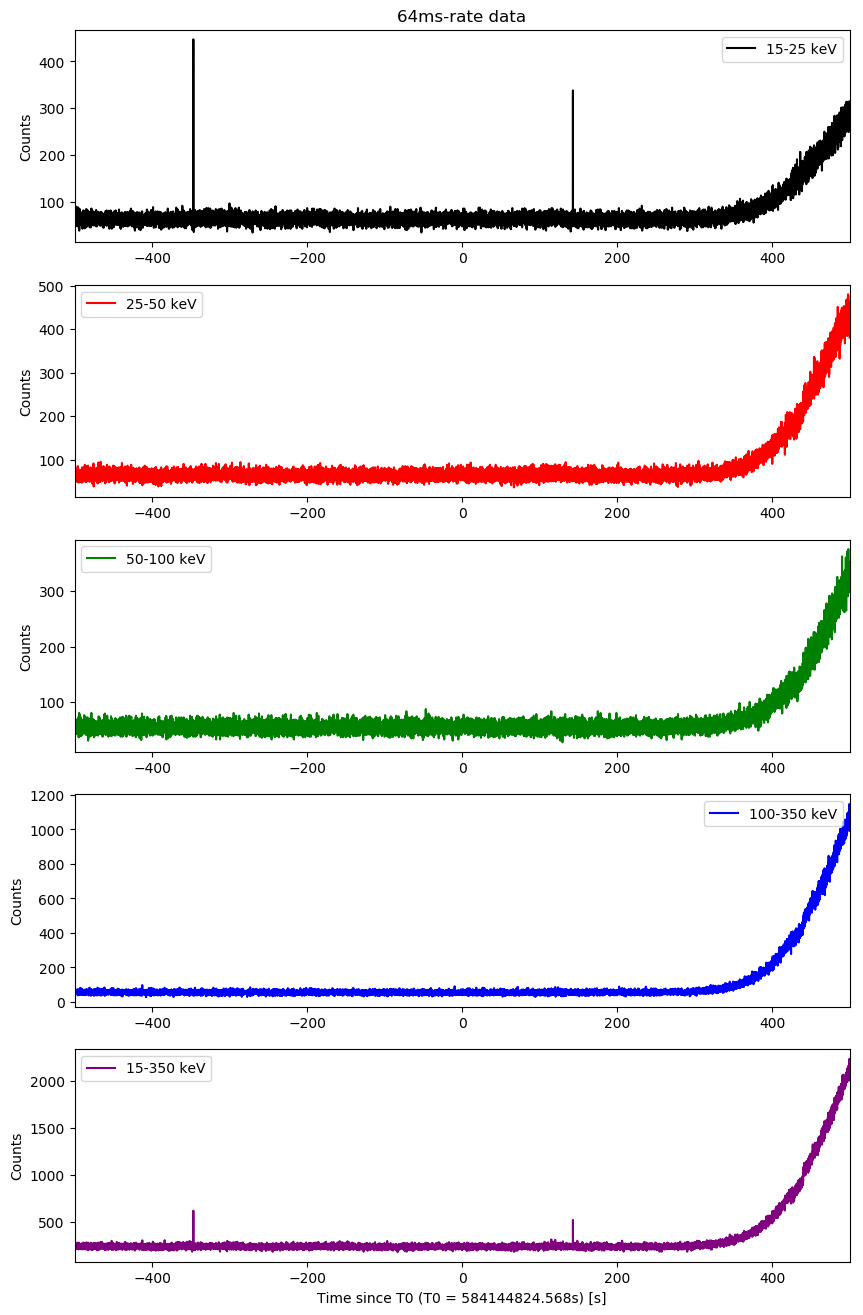
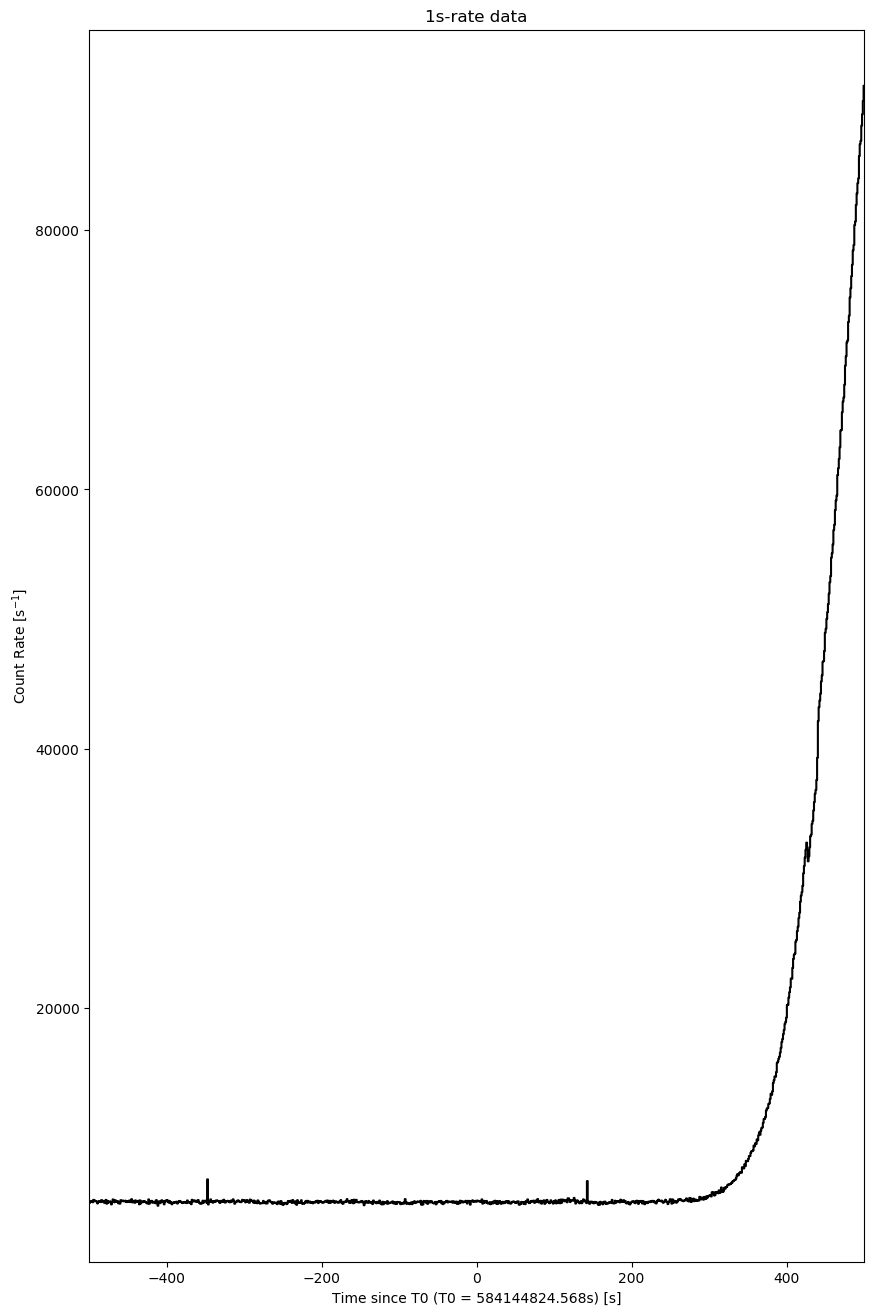
Raw Light Curves
Quad-rate light curves (with 1.6 s time bin)
64-ms light curves
1-s light curves
Event data image search
Event data found. The analysis results are listing below.


## list of detected sources for 00913375000

########################################

########################################
## tstart_since_T0: 0.0
## tstop_since_T0: 0.1
event data don't cover the request time
## tstart_since_T0: -2.0
## tstop_since_T0: 8.0
event data don't cover the request time
########################################

########################################
## tstart_since_T0: 29.432
## tstop_since_T0: 32.5569

                 TIME                           NAME     RA_OBJ    DEC_OBJ        SNR
                    s                                       deg        deg
  1  584144854.000000 Vela X-1                         135.5286   -40.5547      0.068
  2  584144854.000000 UNKNOWN                           70.9442   -41.8028      4.592
  3  584144854.000000 UNKNOWN                          110.4707    -9.5182      5.234
########################################
Last update:
Tue Jul 9 08:07:25 EDT 2019