Click here for the BAT GCN circular template
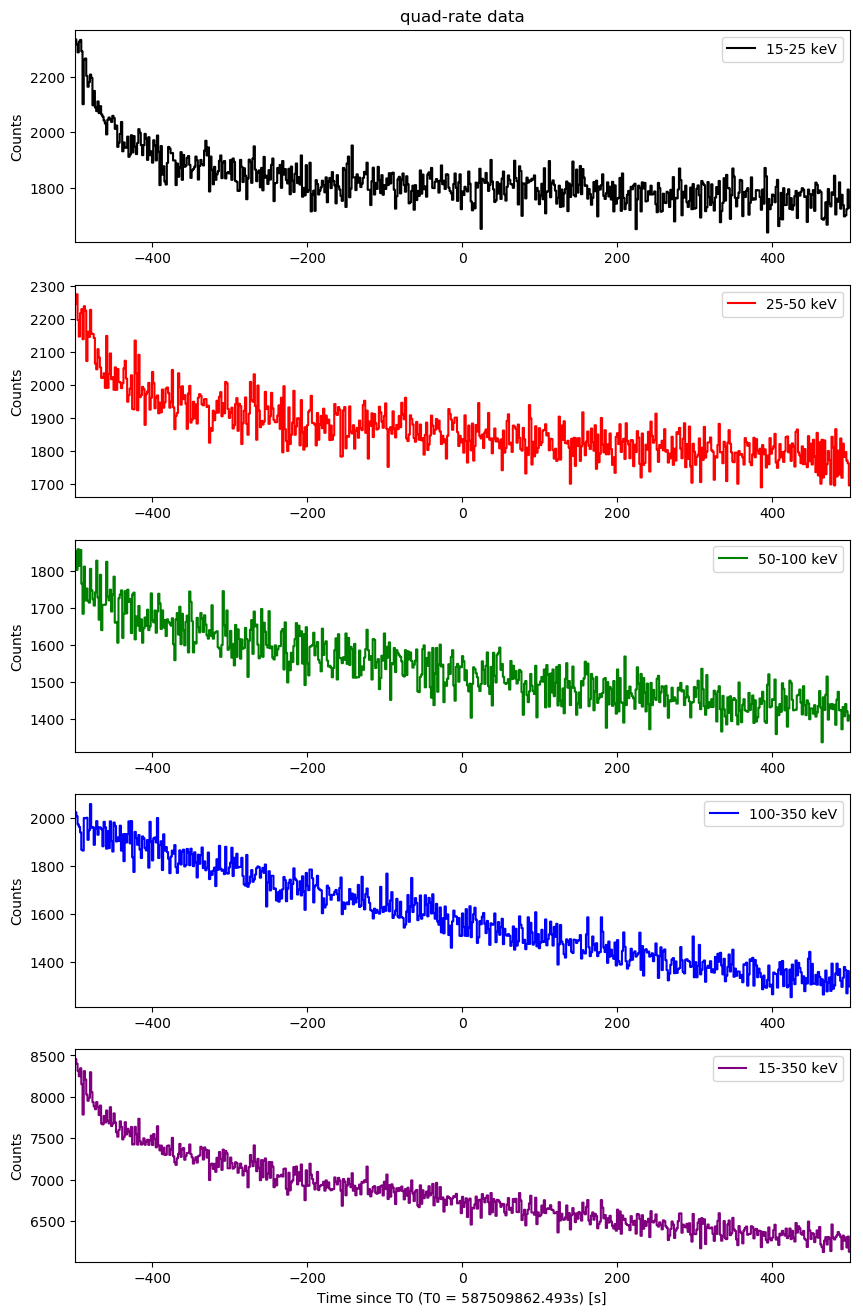
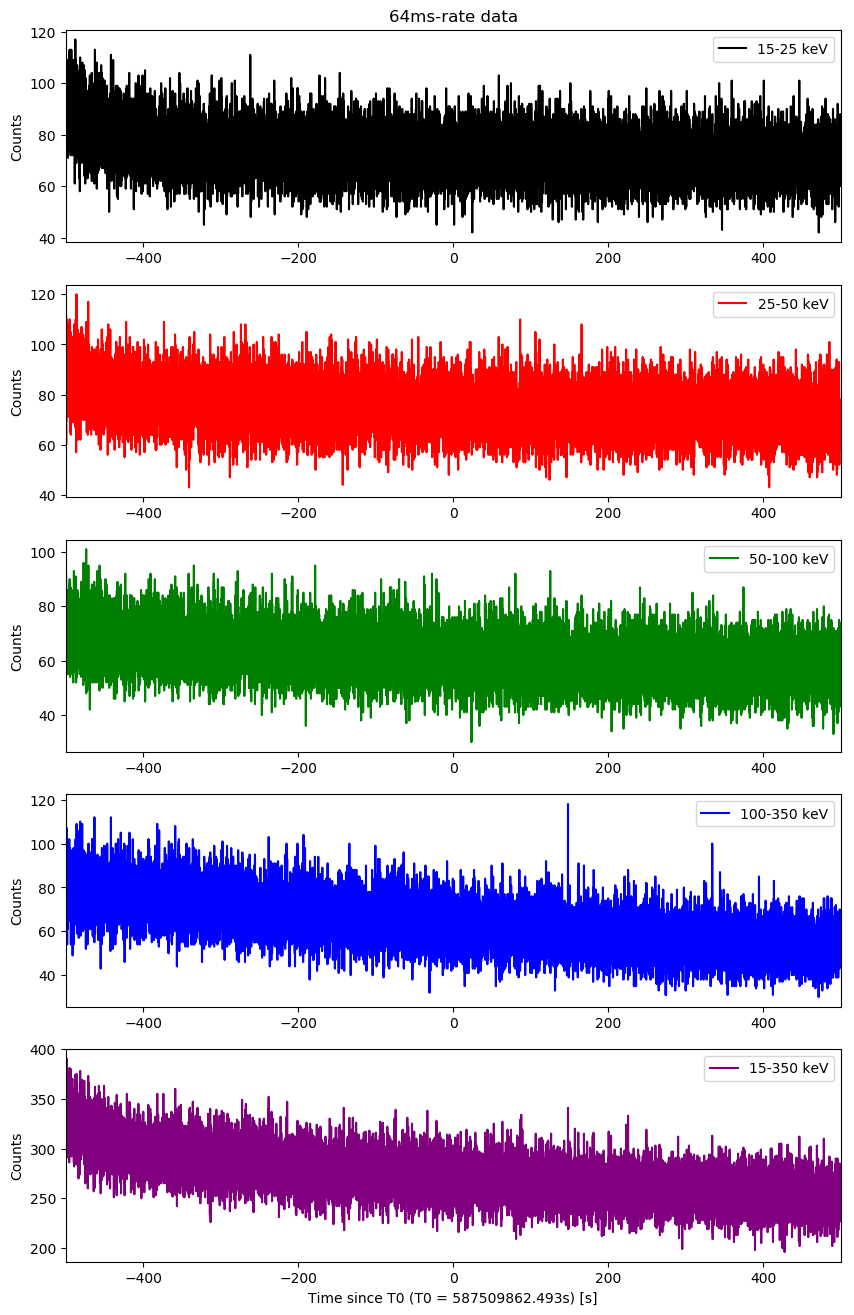
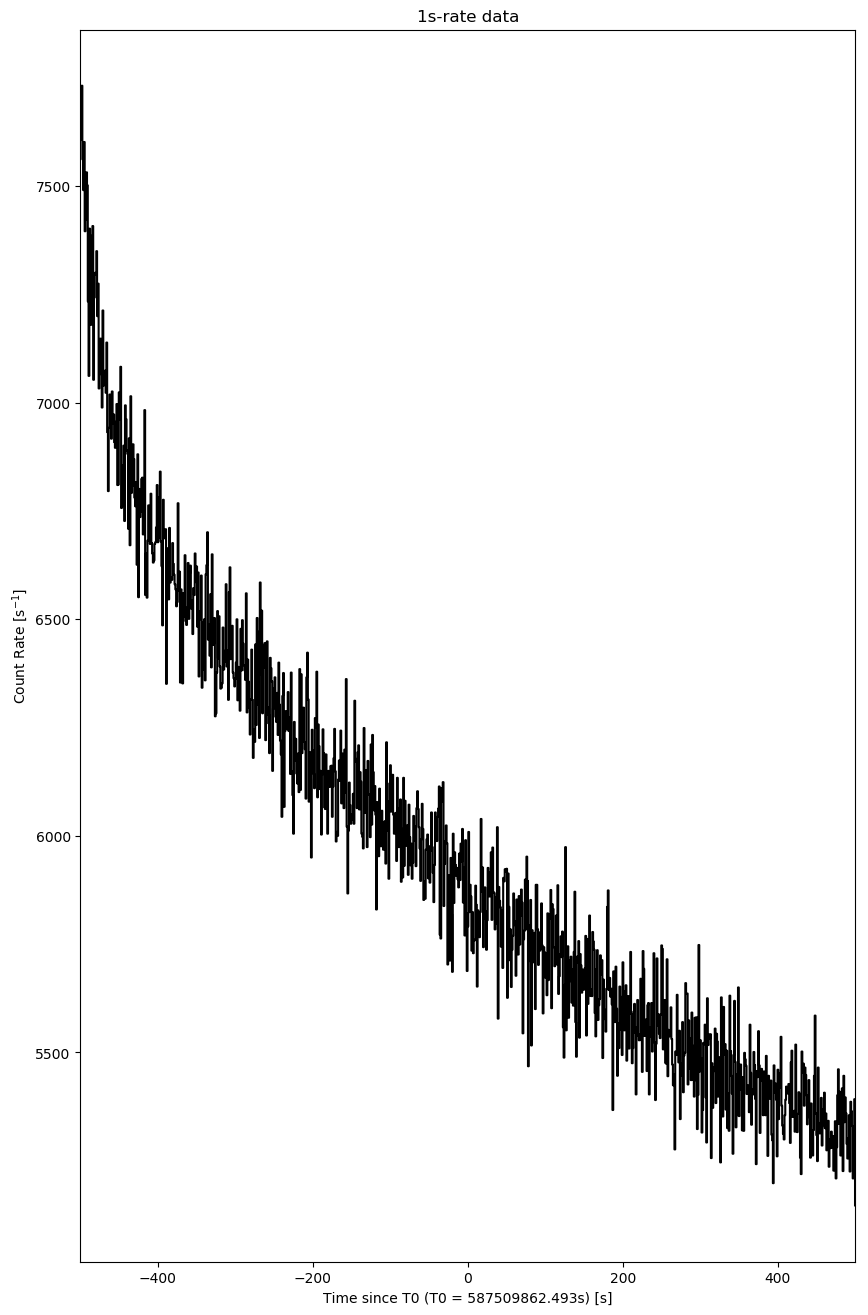
Raw Light Curves
Quad-rate light curves (with 1.6 s time bin)
64-ms light curves
1-s light curves
Event data image search
No event data found.
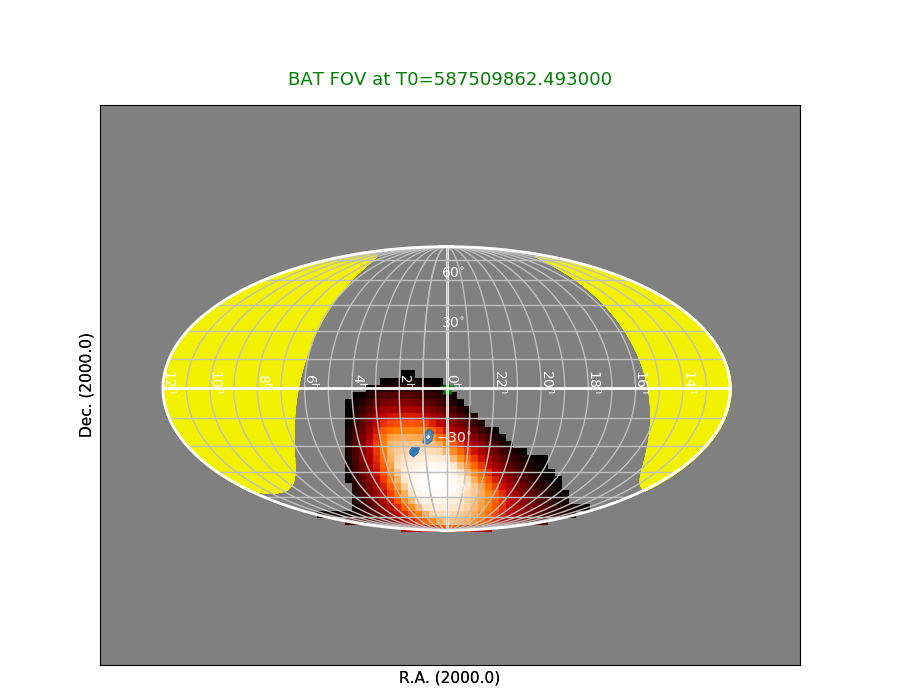
Survey data image search
We search for detections in the following images created using the survey data (obsid = 00010905033):
1. point_20192262103 (from T0-431.493 s to T0-131.493 s)  Sources with SNR(14-195 keV) > 3.5
2. point_20192262108 (from T0-131.493 s to T0+168.507 s)  Sources with SNR(14-195 keV) > 3.5
3. point_20192262113 (from T0+168.507 s to T0+420.507 s)  Sources with SNR(14-195 keV) > 3.5


-----------------------------------------
In the lists above, only one source within the 90% LVG credible region:
RA = 14.495 deg
DEC = -26.613 deg
SNR (14-195 keV) = 5.6493
Found in the image from point_20192262108
* Due to the low significance, this is likely from noise.
------------------------------------------


The following image shows all these sources (green stars) on the BAT FOV sky map:

Last update:
Thu Aug 15 16:00:06 EDT 2019