Transient Analysis Summary
Summary of the Input Information
- T0: 589073485.368999958 [MET] (2019-09-01T23:31:01.837 UTC)
- Search time window: T0 +/- 100.0 s
- Input source: RA=0.0, DEC=0.0 (source location is randomly seleected, since the true location is unknown.)
- Input image: /local/data/bat2/batusers/batgroup/BAT_GW/results/S190901ap/bayestar.fits.gz
FOV Check
- The input source is out of the BAT FOV
- The input image does not overlaps with the BAT FOV
- The integrated LIGO localization probability that are in BAT FOV (with pcode > 10%): 0.026952924956183243
- The integrated probability of Phil's convolved map that are in BAT FOV (with pcode > 10%): 0.02643908433531418
- The integrated LIGO localization probability that are outside of the BAT FOV (with pcode > 10%) but above the Earth's limb: 0.7666948833010234
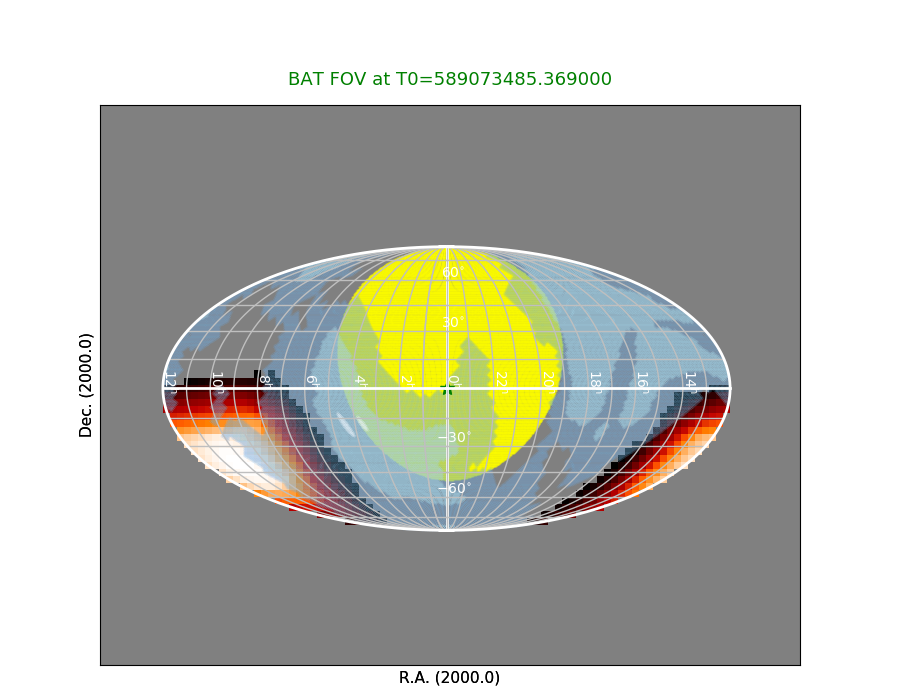 RED: BAT FOV (the brighter/whiter color refers to higher partial coding fraction).
YELLOW: Earth
BLUE: LIGO probability map
GREEN STAR: Input source (location is randomly seleected unless the true source location is available.)
RED: BAT FOV (the brighter/whiter color refers to higher partial coding fraction).
YELLOW: Earth
BLUE: LIGO probability map
GREEN STAR: Input source (location is randomly seleected unless the true source location is available.)
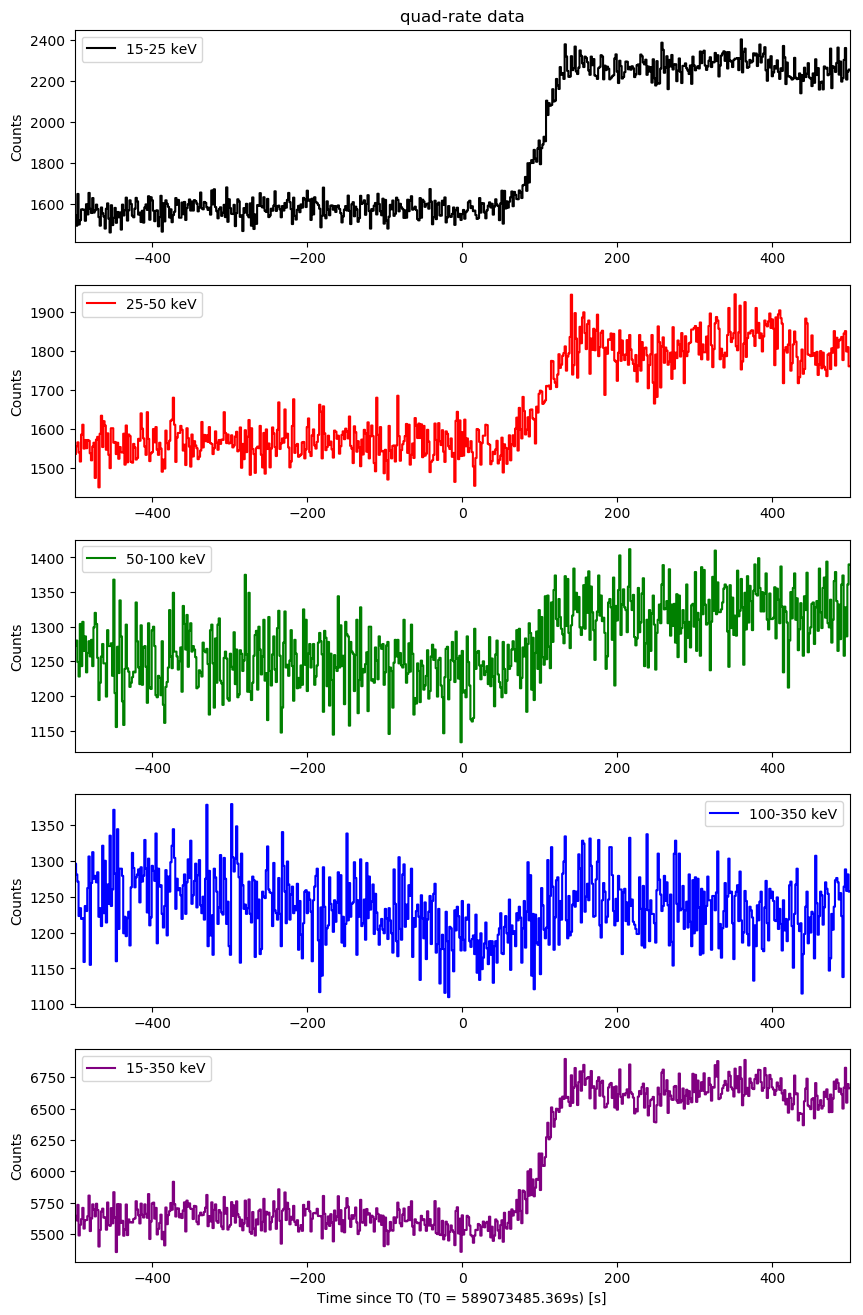
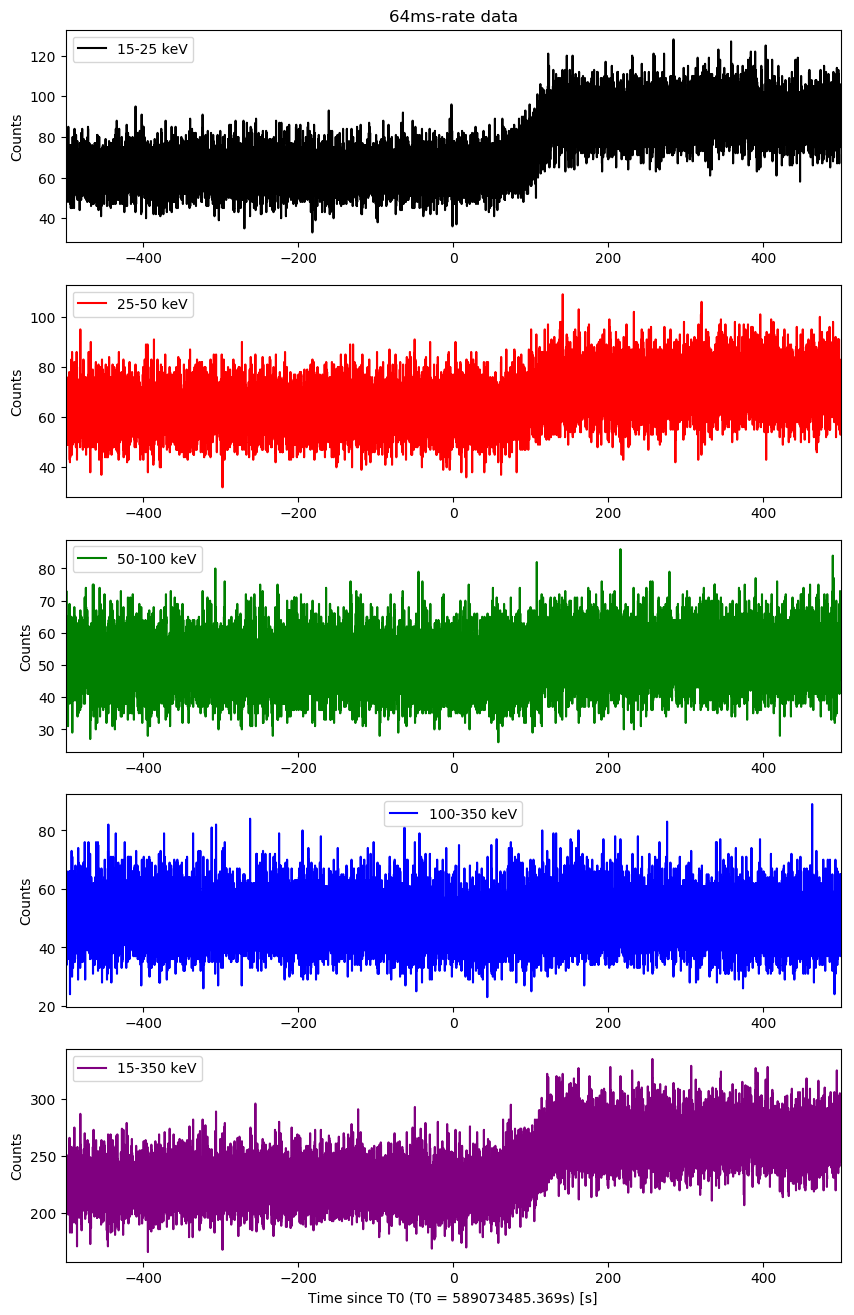
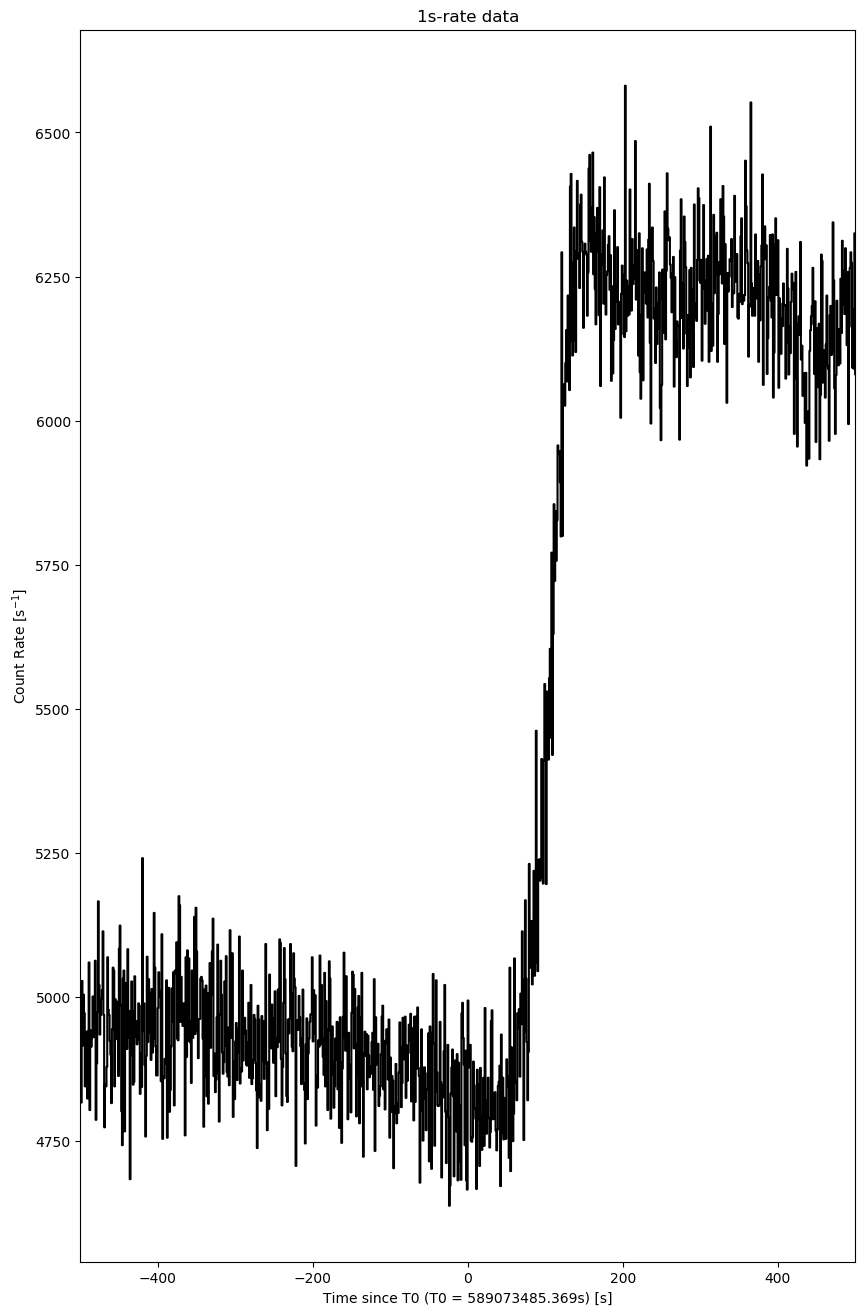
Raw Light Curves
Quad-rate light curves (with 1.6 s time bin)
64-ms light curves
1-s light curves
Event data image search
Event data found. The analysis results are listing below.


## list of detected sources for 00923405000

########################################

########################################
## tstart_since_T0: 0.0
## tstop_since_T0: 0.1
event data don't cover the request time
## tstart_since_T0: -2.0
## tstop_since_T0: 8.0
event data don't cover the request time
########################################

########################################
## tstart_since_T0: -50.369
## tstop_since_T0: -47.2568

                 TIME                           NAME     RA_OBJ    DEC_OBJ        SNR
                    s                                       deg        deg
  1  589073435.000000 Vela X-1                         135.5286   -40.5547      1.351
  2  589073435.000000 Cen X-3                          170.3158   -60.6230      0.585
  3  589073435.000000 GX 301-2                         186.6567   -62.7703      1.775
  4  589073435.000000 UNKNOWN                           82.3459   -42.6320      3.772
  5  589073435.000000 UNKNOWN                          188.4596   -11.6675      4.741
########################################
Last update:
Mon Sep 2 10:59:51 EDT 2019