Transient Analysis Summary
Summary of the Input Information
- T0: 589771602.827000022 [MET] (2019-09-10T01:26:19.242 UTC)
- Search time window: T0 +/- 100.0 s
- Input source: RA=0.0, DEC=0.0 (source location is randomly seleected, since the true location is unknown.)
- Input image: /local/data/bat2/batusers/batgroup/BAT_GW/results/S190910d/bayestar.fits.gz
FOV Check
- The input source is out of the BAT FOV
- The input image does not overlaps with the BAT FOV
- Max probability in LIGO map: 4.5025353722171884e-05
- Sum of (BAT pcode)*(LIGO probability) of the entire LIGO map: 0.24353085492789264
- The integrated LIGO localization probability that are in BAT FOV (with pcode > 10%): 0.4485059444917418
- The integrated probability of Phil's convolved map that are in BAT FOV (with pcode > 10%): 0.4555877200205841
- The integrated LIGO localization probability that are outside of the BAT FOV (with pcode > 10%) but above the Earth's limb: 0.21261098674735485
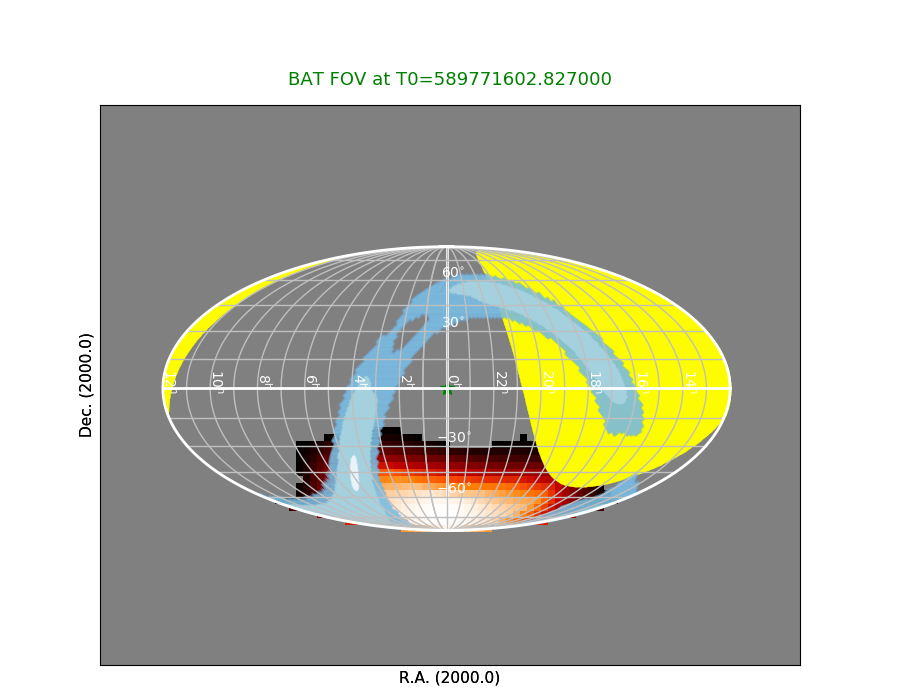 RED: BAT FOV (the brighter/whiter color refers to higher partial coding fraction).
YELLOW: Earth
BLUE: LIGO probability map
GREEN STAR: Input source (location is randomly seleected unless the true source location is available.)
RED: BAT FOV (the brighter/whiter color refers to higher partial coding fraction).
YELLOW: Earth
BLUE: LIGO probability map
GREEN STAR: Input source (location is randomly seleected unless the true source location is available.)
Click here for the BAT GCN circular template
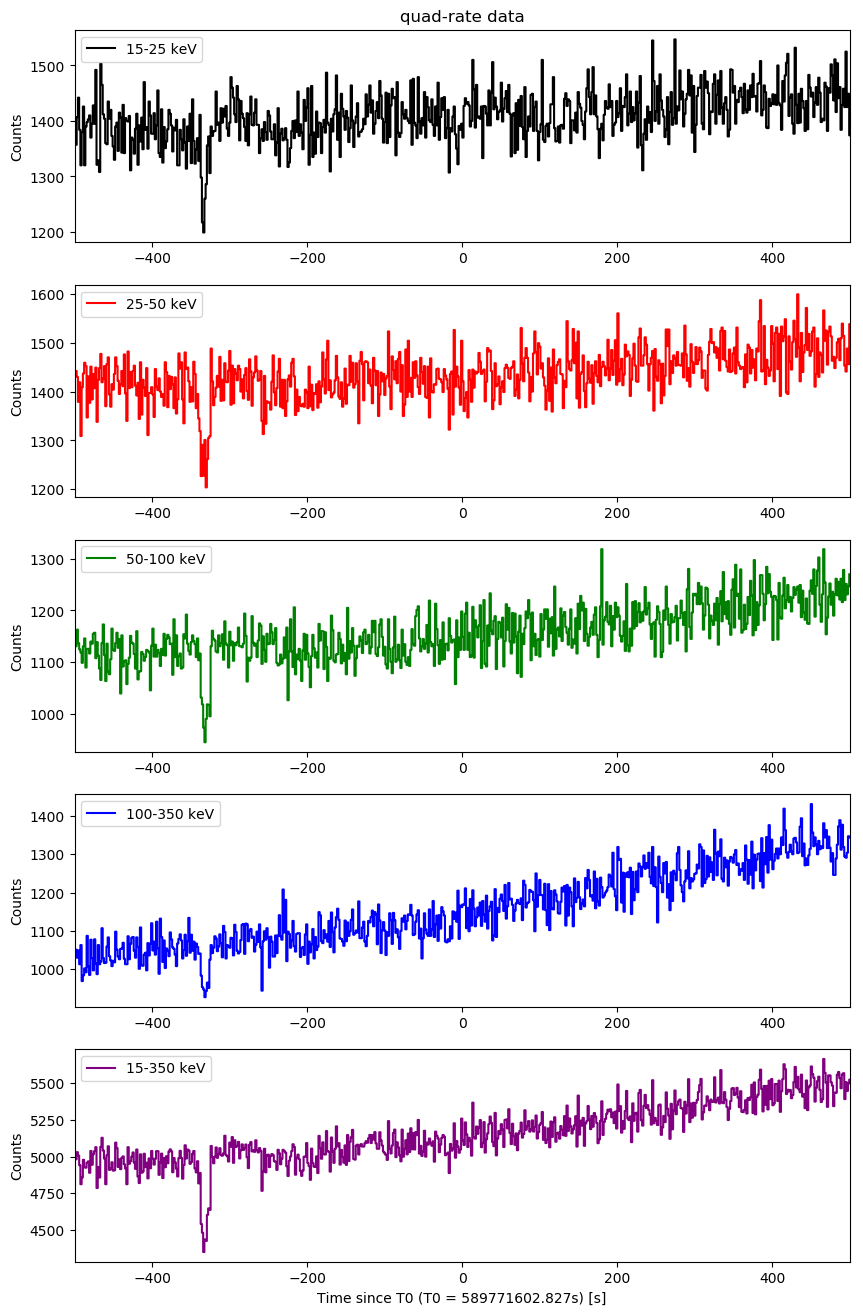
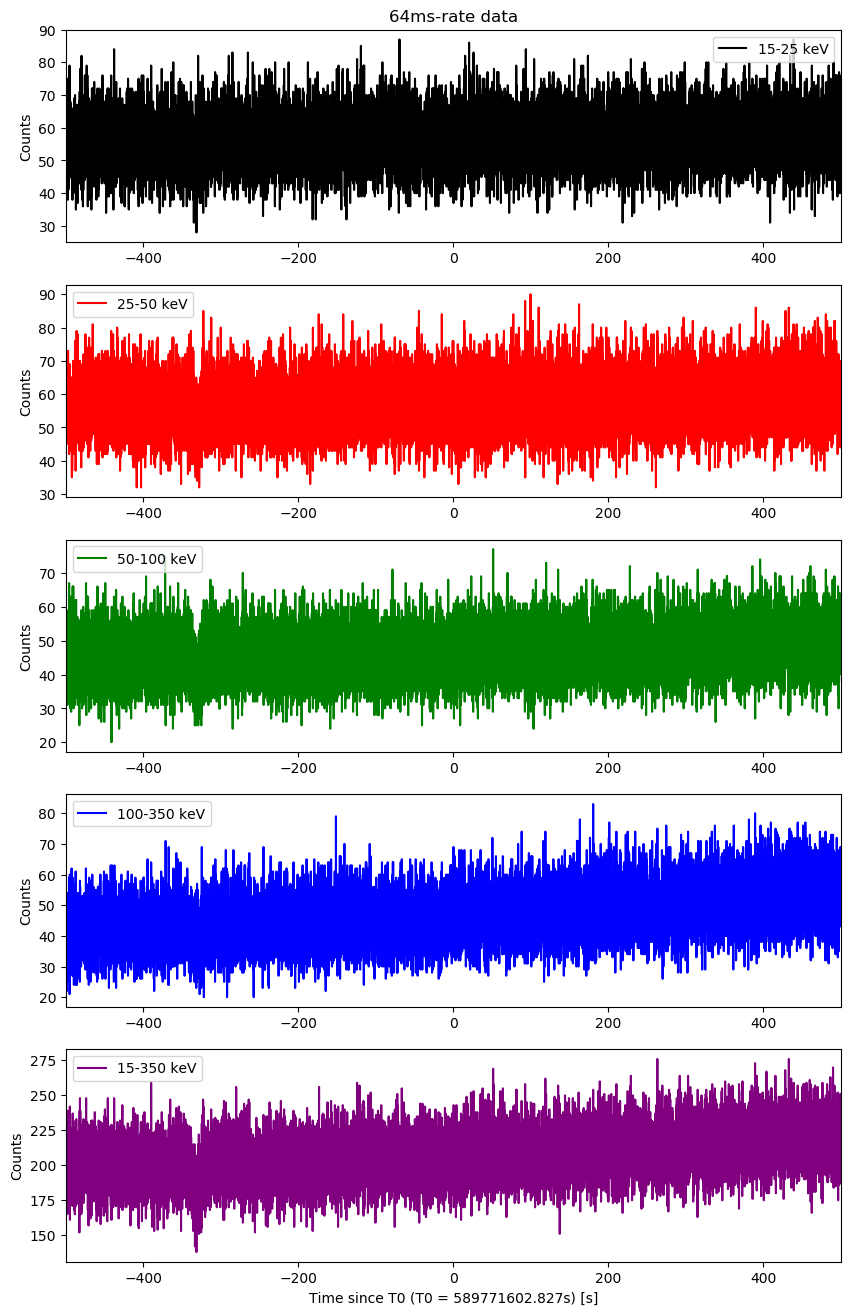
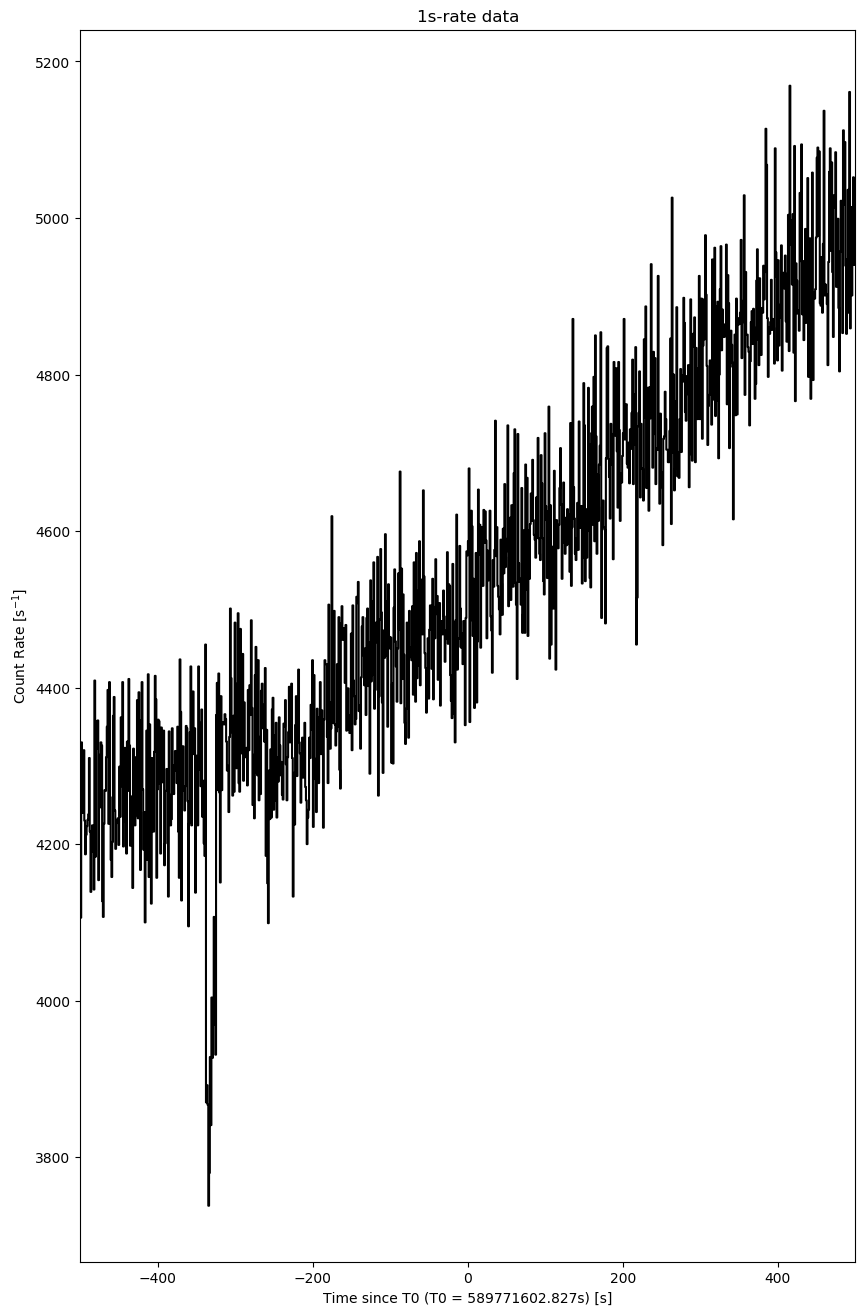
Raw Light Curves
Quad-rate light curves (with 1.6 s time bin)
64-ms light curves
1-s light curves
Event data image search
Event data found. The analysis results are listing below.


## list of detected sources for 00924603000

########################################

########################################
## tstart_since_T0: 0.0
## tstop_since_T0: 0.1
event data don't cover the request time
## tstart_since_T0: -2.0
## tstop_since_T0: 8.0
event data don't cover the request time
########################################

########################################
## tstart_since_T0: -21.827
## tstop_since_T0: -18.767

                 TIME                           NAME     RA_OBJ    DEC_OBJ        SNR
                    s                                       deg        deg
  1  589771581.000000 GX 301-2                         186.6567   -62.7703     -1.180
  2  589771581.000000 4U 1700-377                      255.9866   -37.8441      0.861
  3  589771581.000000 GX 349+2                         256.4354   -36.4231     -1.759
  4  589771581.000000 4U 1735-44                       264.7429   -44.4500      0.455
  5  589771581.000000 UNKNOWN                          299.3587   -36.2350      4.820
########################################
Last update:
Tue Sep 10 02:41:40 EDT 2019