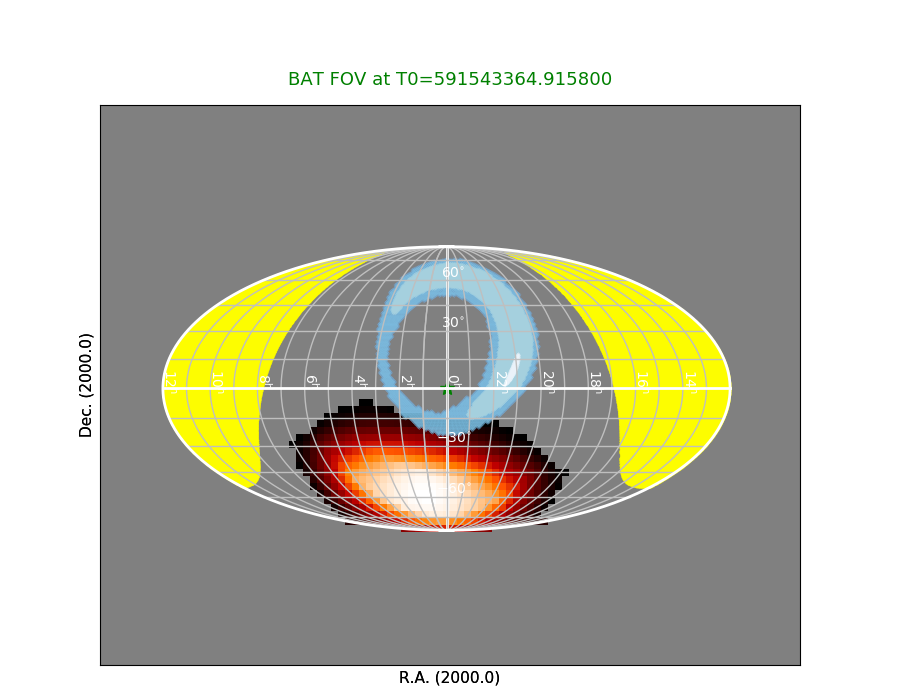
GREEN STAR: Input source (location is randomly seleected unless the true source location is available.)
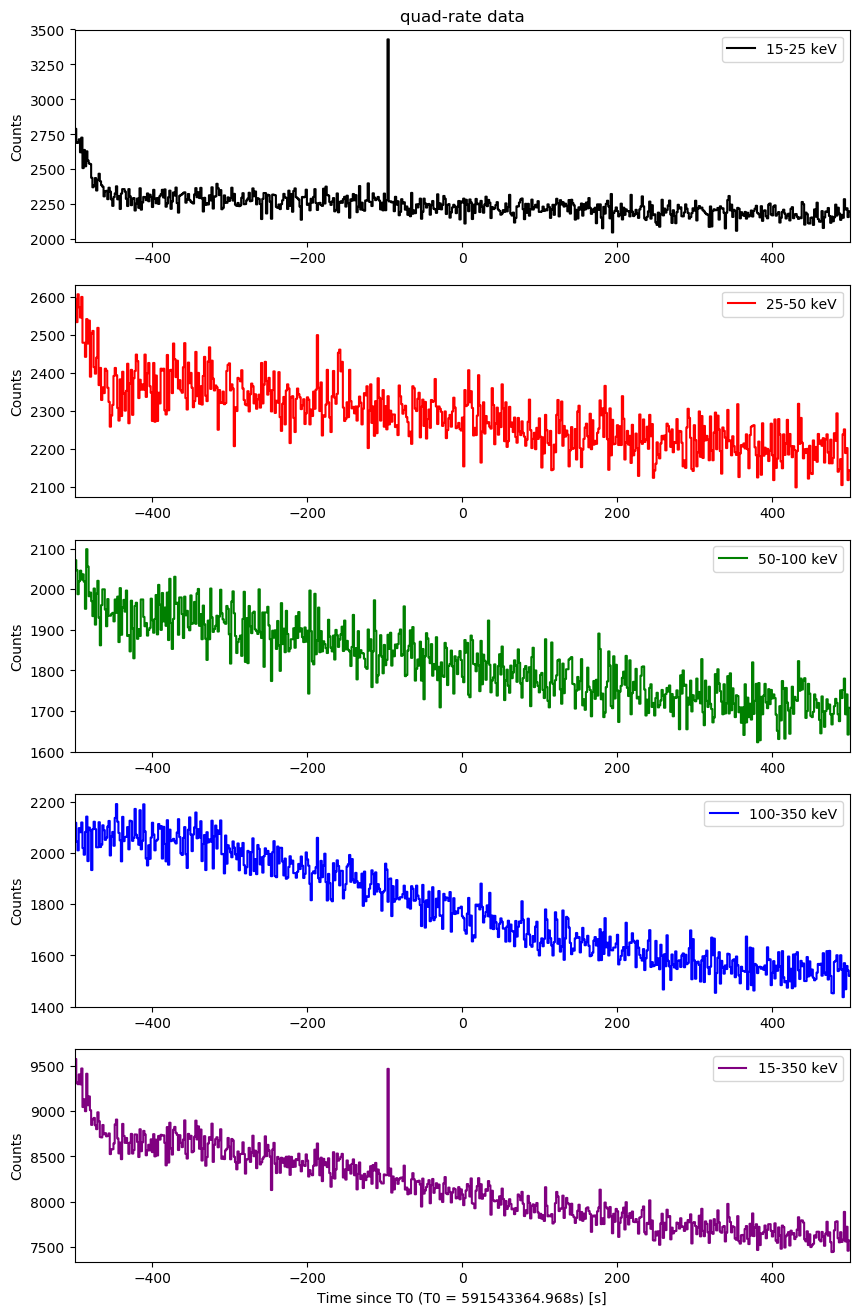
Raw Light Curves
Quad-rate light curves (with 1.6 s time bin)
64-ms light curves
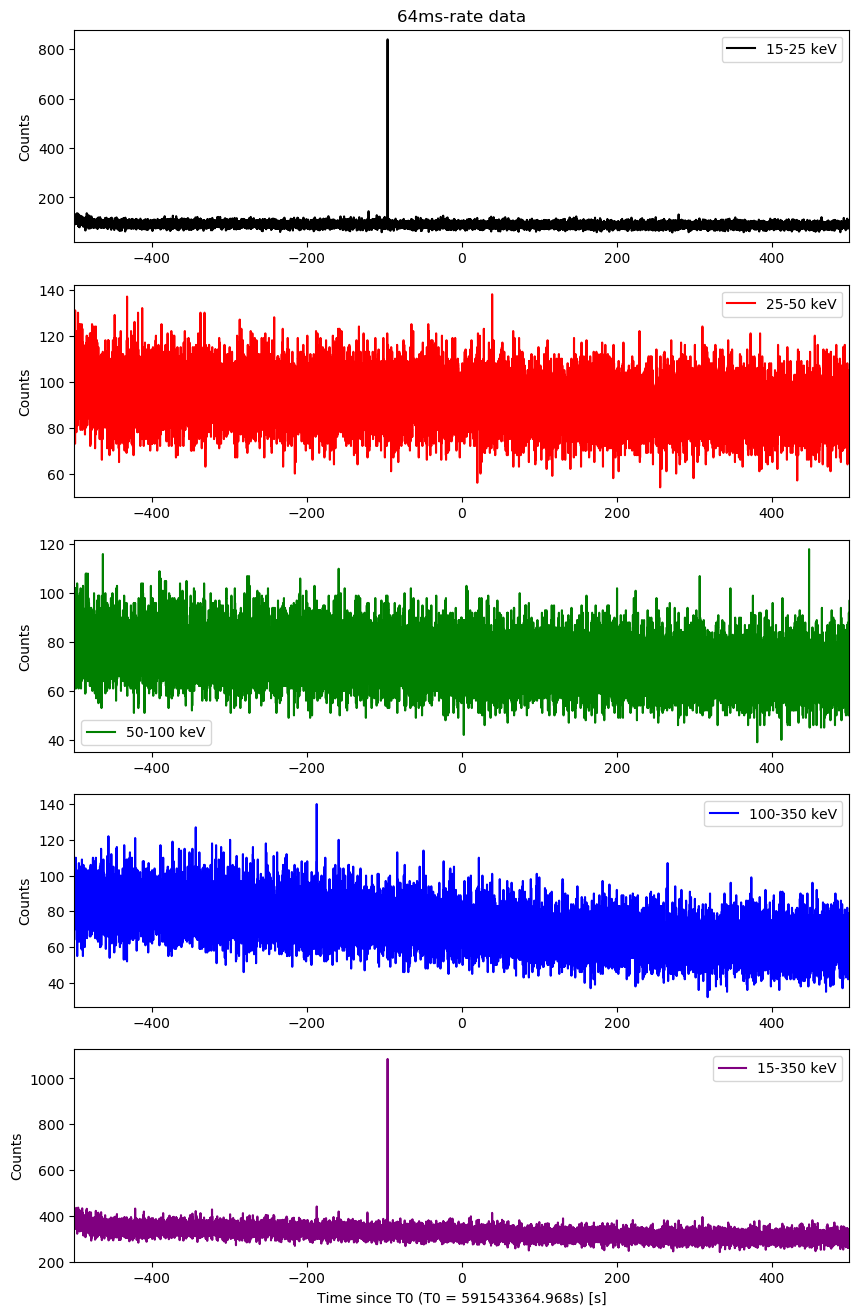
Detection > 5-sigma found:
## Time  Net_count SNR
-95.9760000705719 488.79424 18.64383697507684
-95.91200006008148 760.79424 29.018598464125688
1-s light curves
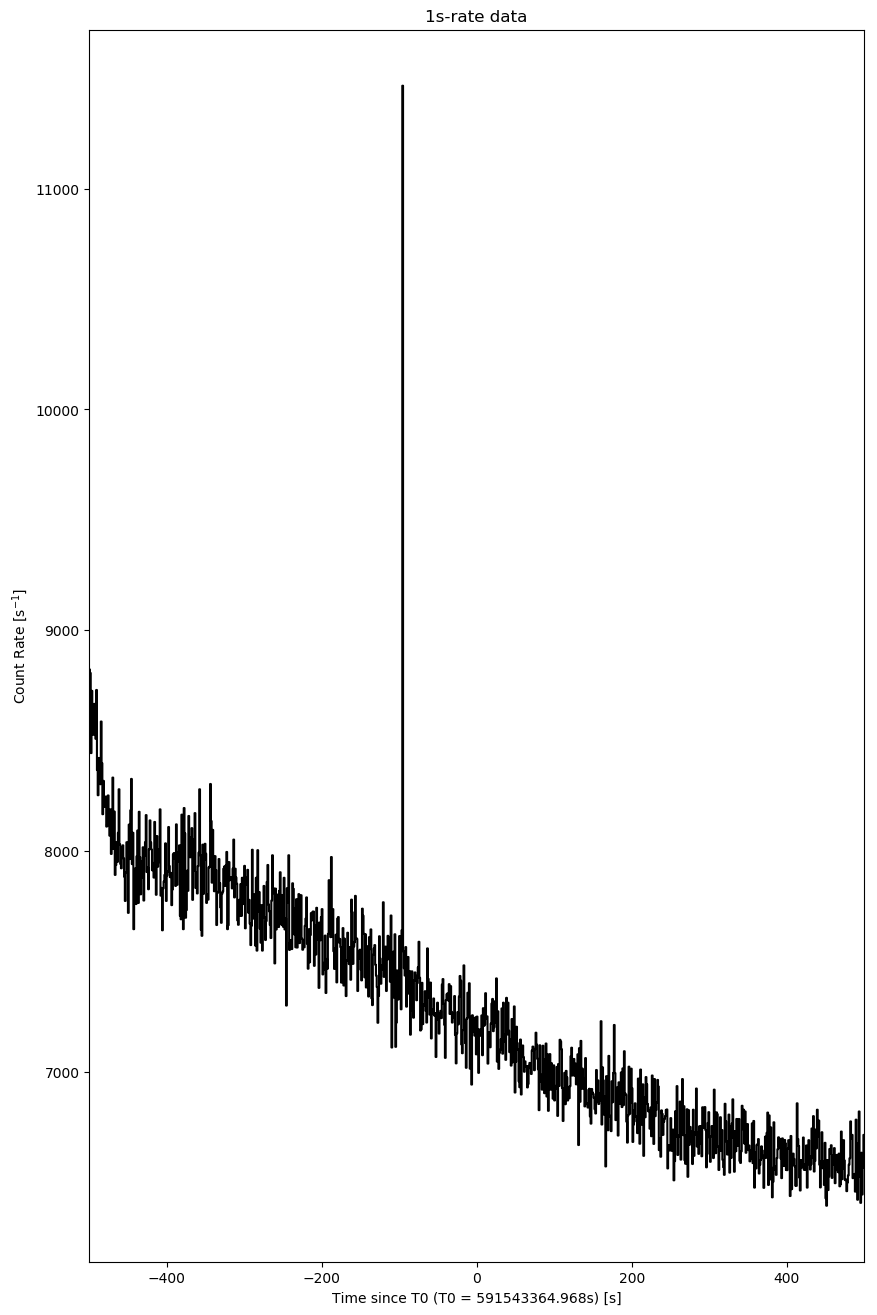
Detection > 5-sigma found:
## Time  Net_count SNR
-95.96800005435944 4244.675 12.358334425746751
Event data image search
Event data found. The analysis results are listing below.


## list of detected sources for 00926515005

########################################

########################################
## tstart_since_T0: 0.0
## tstop_since_T0: 0.1

                 TIME                           NAME     RA_OBJ    DEC_OBJ        SNR
                    s                                       deg        deg
  1  591543364.968000 UNKNOWN                           57.6533   -51.0796      3.991
## tstart_since_T0: -2.0
## tstop_since_T0: 8.0

                 TIME                           NAME     RA_OBJ    DEC_OBJ        SNR
                    s                                       deg        deg
  1  591543362.968000 UNKNOWN                          322.7268   -34.4455      6.283
  2  591543362.968000 UNKNOWN                           82.8522   -45.8833      5.307
  3  591543362.968000 UNKNOWN                          284.8055   -53.0180      5.301
########################################

########################################
## tstart_since_T0: -100.968
## tstop_since_T0: 99.102

                 TIME                           NAME     RA_OBJ    DEC_OBJ        SNR
                    s                                       deg        deg
  1  591543264.000000 UNKNOWN                           61.6003   -17.0083      3.735
  2  591543264.000000 UNKNOWN                          311.1291   -42.7189      4.231
  3  591543264.000000 UNKNOWN                          289.6601   -36.1704      2.877
########################################
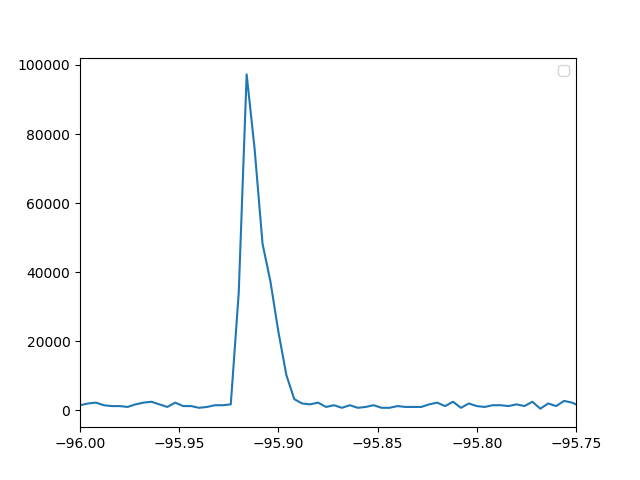
Investigation of the detector glitch around T-95.85 s
The short spike at ~T-95.9 s in 15-25 keV is due to detector glitch.

Reasons:
1. It is extremely short (~ 40 ms; see the zoomed-in light curve below).
2. The counts are from a few dozen of specific detectors (see the TIME vs DetID and the DPI plot below).

Here is the zoomed-in light curve of the short spike from T-95.95 s to T-95.85 s in 15-25 keV:


Here is the TIME vs DetID plot from T-95.95 s to T-95.85 s:
Last update:
Mon Sep 30 14:10:09 EDT 2019