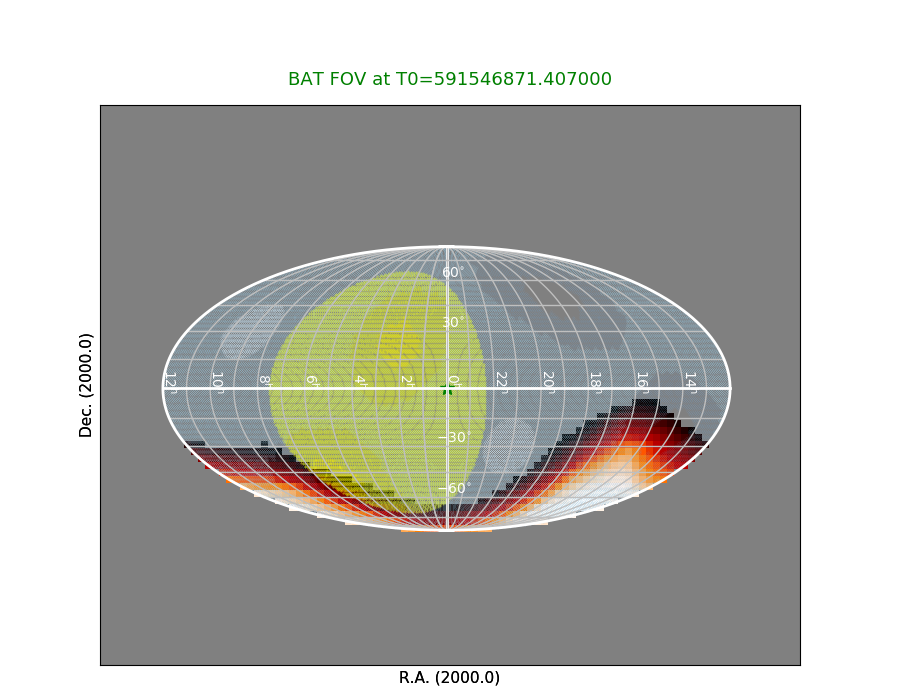
GREEN STAR: Input source (location is randomly seleected unless the true source location is available.)
Raw Light Curves
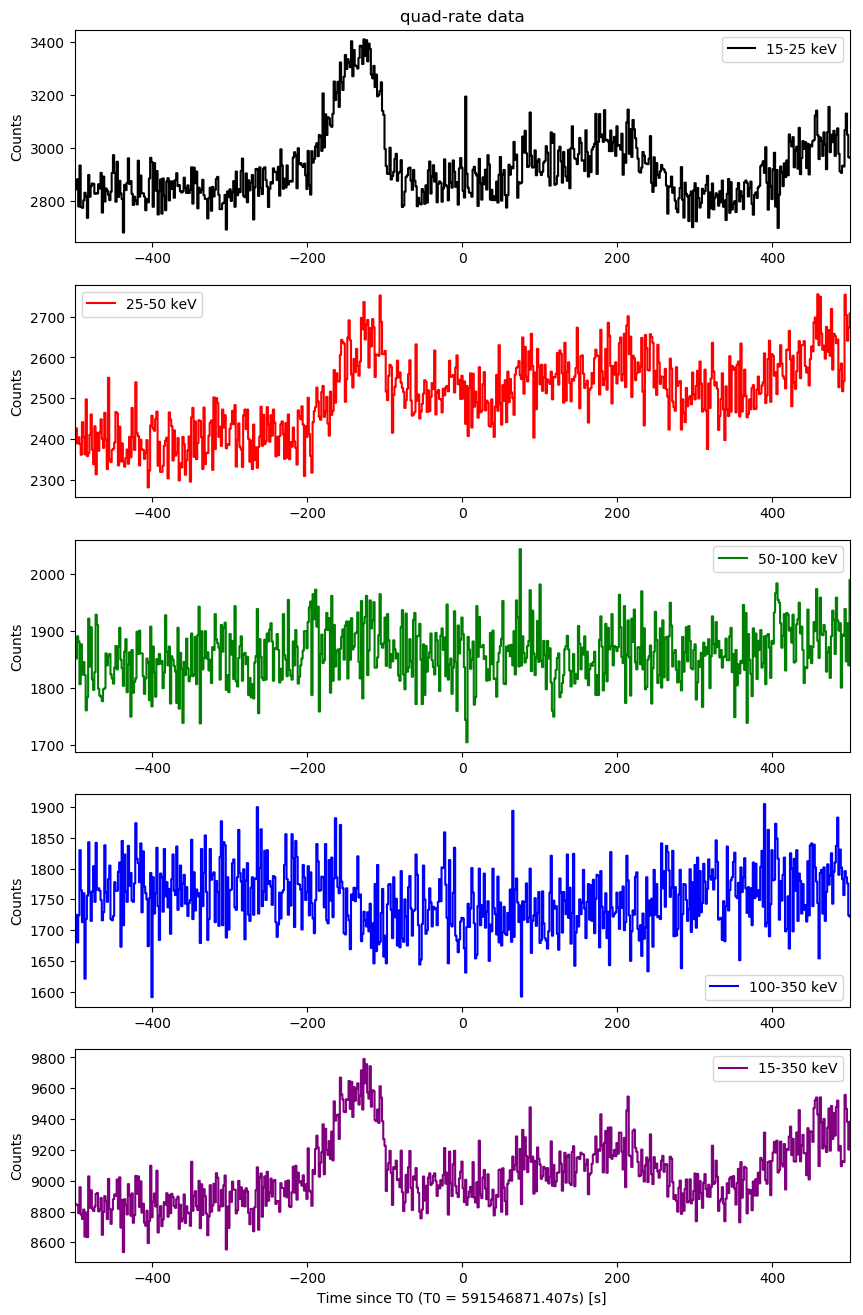
Quad-rate light curves (with 1.6 s time bin)
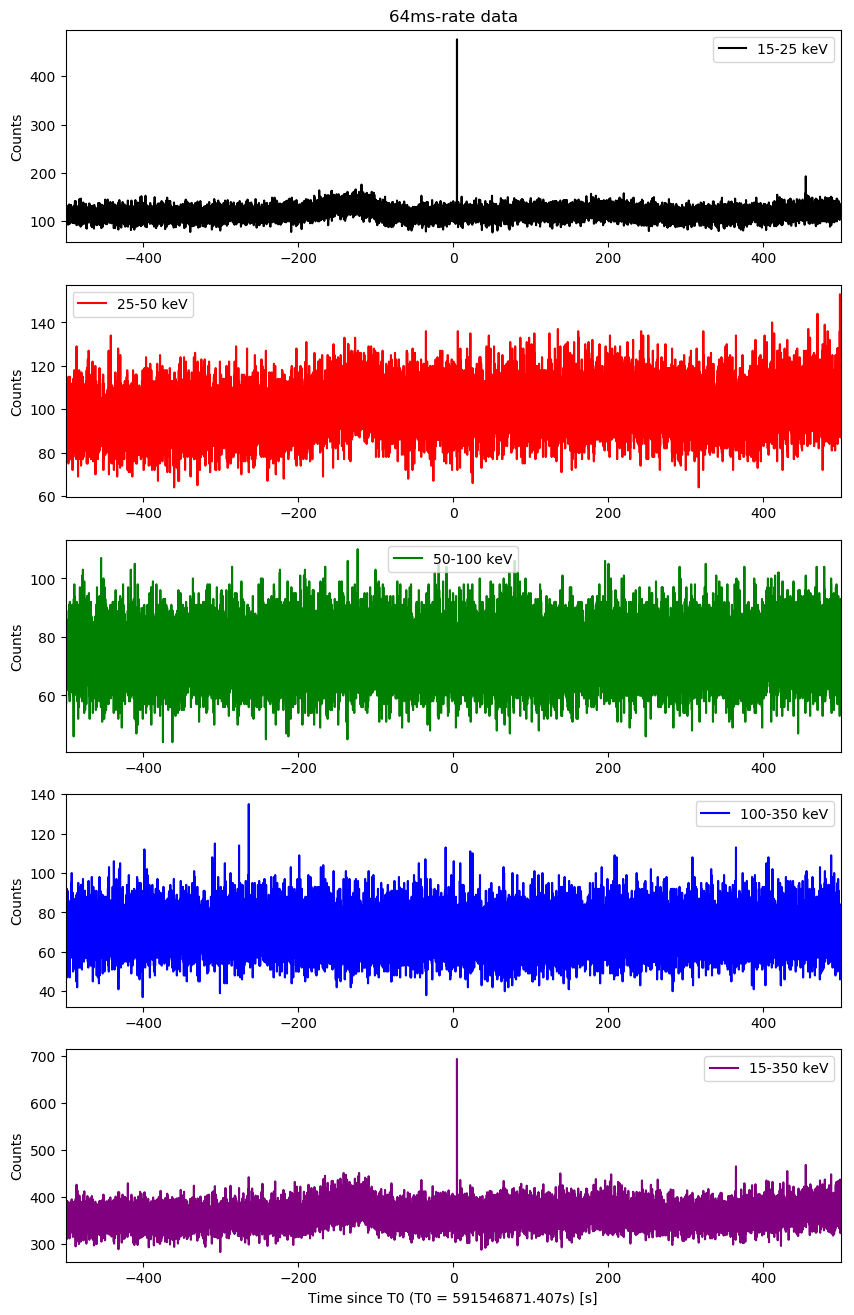
64-ms light curves
Detection > 5-sigma found:
## Time  Net_count SNR
4.881000280380249 332.90656 14.804395788276745
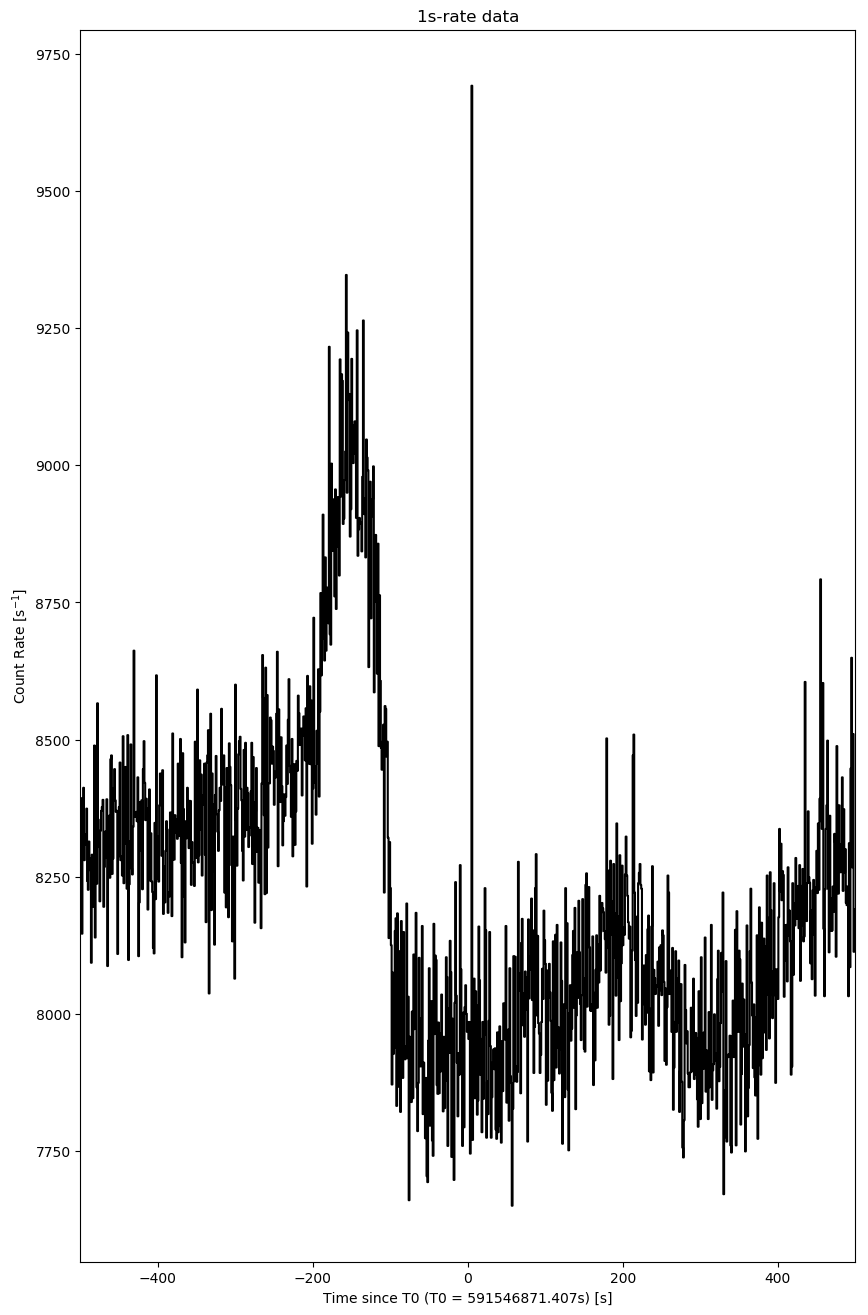
1-s light curves
Detection > 5-sigma found:
## Time  Net_count SNR
4.593000054359436 1721.29 9.464366315053784
Event data image search
Event data found. The analysis results are listing below.


## list of detected sources for 00032699026

########################################

########################################
## tstart_since_T0: 0.0
## tstop_since_T0: 0.1

                 TIME                           NAME     RA_OBJ    DEC_OBJ      THETA        PHI        SNR
                    s                                       deg        deg        deg        deg
  1  591546871.407000 Vela X-1                         135.5286   -40.5547    48.8317  -149.5312      0.808
  2  591546871.407000 Cen X-3                          170.3158   -60.6230    19.6511  -146.2441      0.083
  3  591546871.407000 GX 301-2                         186.6567   -62.7703    11.8320  -139.5379      0.451
  4  591546871.407000 Sco X-1                          244.9795   -15.6402    54.1152   -11.3956     -0.013
  5  591546871.407000 4U 1700-377                      255.9866   -37.8441    36.9294    13.0095      0.408
  6  591546871.407000 GX 349+2                         256.4354   -36.4231    38.3542    12.4480      1.884
  7  591546871.407000 GX 1+4                           263.0090   -24.7456    51.3214    12.5316      1.055
  8  591546871.407000 4U 1735-44                       264.7429   -44.4500    34.7289    28.5240     -2.240
  9  591546871.407000 GX 5-1                           270.2842   -25.0792    53.7930    20.2512      0.152
 10  591546871.407000 GRS 1758-258                     270.3025   -25.7431    53.2022    20.6285     -1.028
 11  591546871.407000 H1820-303                        275.9250   -30.3670    51.3415    28.8756     -2.443
 12  591546871.407000 GX 354-0                         262.9891   -33.8347    43.1261    17.9038      0.492
 13  591546871.407000 UNKNOWN                          261.3763   -15.9865    58.8247     6.7017      5.552


## tstart_since_T0: -2.0
## tstop_since_T0: 8.0

                 TIME                           NAME     RA_OBJ    DEC_OBJ      THETA        PHI        SNR
                    s                                       deg        deg        deg        deg
  1  591546869.407000 Vela X-1                         135.5286   -40.5547    48.8317  -149.5312      3.123
  2  591546869.407000 Cen X-3                          170.3158   -60.6230    19.6512  -146.2441      0.131
  3  591546869.407000 GX 301-2                         186.6567   -62.7703    11.8321  -139.5380      5.945
  4  591546869.407000 Sco X-1                          244.9795   -15.6402    54.1152   -11.3956      3.286
  5  591546869.407000 4U 1700-377                      255.9866   -37.8441    36.9294    13.0096      0.305
  6  591546869.407000 GX 349+2                         256.4354   -36.4231    38.3542    12.4480      1.122
  7  591546869.407000 GX 1+4                           263.0090   -24.7456    51.3214    12.5316      1.287
  8  591546869.407000 4U 1735-44                       264.7429   -44.4500    34.7288    28.5240      0.716
  9  591546869.407000 GX 5-1                           270.2842   -25.0792    53.7930    20.2513      0.960
 10  591546869.407000 GRS 1758-258                     270.3025   -25.7431    53.2022    20.6285      1.513
 11  591546869.407000 H1820-303                        275.9250   -30.3670    51.3414    28.8756     -0.083
 12  591546869.407000 GX 354-0                         262.9891   -33.8347    43.1261    17.9038      0.016
 13  591546869.407000 UNKNOWN                          326.9914   -62.2660    43.3729    91.6061      3.367
 14  591546869.407000 UNKNOWN                           31.9645   -64.6730    49.9209   129.2191      3.522
 15  591546869.407000 UNKNOWN                          293.1696   -73.2114    26.9247    91.0534      3.874
 16  591546869.407000 UNKNOWN                          210.3178   -20.0473    45.3973   -53.9543      4.480
########################################

########################################
## tstart_since_T0: -79.0 (end of spacecraft slews)
## tstop_since_T0: 98.654

                 TIME                           NAME     RA_OBJ    DEC_OBJ      THETA        PHI        SNR
                    s                                       deg        deg        deg        deg
  1  591546792.407000 Vela X-1                         135.5286   -40.5547    48.8316  -149.5312      1.521
  2  591546792.407000 Cen X-3                          170.3158   -60.6230    19.6511  -146.2438      0.661
  3  591546792.407000 GX 301-2                         186.6567   -62.7703    11.8320  -139.5374     25.789
  4  591546792.407000 Sco X-1                          244.9795   -15.6402    54.1153   -11.3957      9.687
  5  591546792.407000 4U 1700-377                      255.9866   -37.8441    36.9295    13.0094     -0.609
  6  591546792.407000 GX 349+2                         256.4354   -36.4231    38.3543    12.4479      4.476
  7  591546792.407000 GX 1+4                           263.0090   -24.7456    51.3215    12.5315      0.278
  8  591546792.407000 4U 1735-44                       264.7429   -44.4500    34.7290    28.5238     -0.093
  9  591546792.407000 GX 5-1                           270.2842   -25.0792    53.7931    20.2511      0.641
 10  591546792.407000 GRS 1758-258                     270.3025   -25.7431    53.2023    20.6284      2.075
 11  591546792.407000 H1820-303                        275.9250   -30.3670    51.3415    28.8755     -0.276
 12  591546792.407000 GX 354-0                         262.9891   -33.8347    43.1262    17.9037      1.616
 13  591546792.407000 UNKNOWN                          301.3853   -56.1890    40.2589    70.5703      4.019
 14  591546792.407000 UNKNOWN                           58.4333   -60.2845    52.9202   145.2673      3.631
 15  591546792.407000 UNKNOWN                           61.8975   -69.9886    43.1705   143.8152      3.418
 16  591546792.407000 UNKNOWN                           81.0586   -53.7712    55.3784   162.0854      3.139
 17  591546792.407000 UNKNOWN                          304.1250   -86.7037    24.8518   122.0910      4.357
 18  591546792.407000 UNKNOWN                          266.9476   -45.7611    34.5668    32.0915      4.677
 19  591546792.407000 UNKNOWN                           99.5146   -49.6821    54.2147   176.8382      4.152
 20  591546792.407000 UNKNOWN                          141.9747   -31.4042    54.0085  -137.7886      4.674
########################################
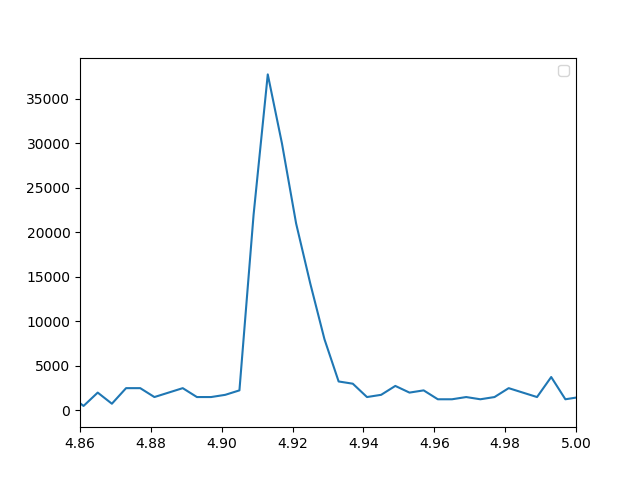
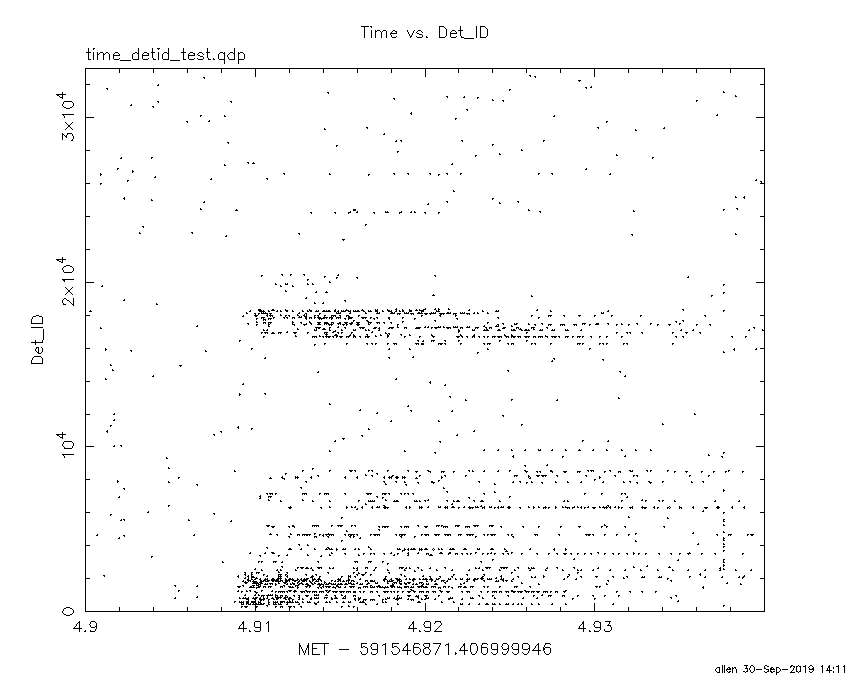
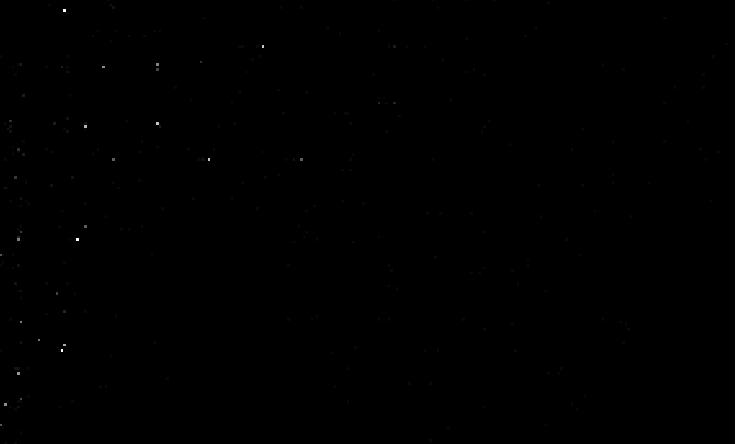
Investigation of the detector glitch around T+4.9 s
The short spike at ~T+4.9 s in 15-25 keV is due to detector glitch.

Reasons:
1. It is extremely short (~ 40 ms; see the zoomed-in light curve below).
2. The counts are from a few dozen of specific detectors (see the TIME vs DetID and the DPI plot below).
3. No credible sources are found in the image made from T+4.9 s to T+4.94 s in 15-25 keV.

Here is the zoomed-in light curve of the short spike from T+4.9 s to T+4.94 s in 15-25 keV:


Here is the TIME vs DetID plot from T+4.9 s to T+4.94 s:


Here is the DPI from T+4.9 s to T+4.94 s:
Last update:
Mon Sep 30 18:30:43 EDT 2019