Transient Analysis Summary
Summary of the Input Information
- T0: 595102146.136000037 [MET] (2019-11-10T18:08:42.210 UTC)
- Search time window: T0 +/- 100.0 s
- Input source: RA=0.0, DEC=0.0 (source location is randomly seleected, since the true location is unknown.)
- Input image: /local/data/bat2/batusers/batgroup/BAT_GW/results/S191110x/bayestar.fits.gz
FOV Check
- The input source is in the BAT FOV with partial coding = 0.474148407784
- The input image does not overlaps with the BAT FOV
- Max probability in LIGO map: 5.362741814640645e-05
- Sum of (BAT pcode)*(LIGO probability) of the entire LIGO map: 0.0024519922416973735
- The integrated LIGO localization probability that are in BAT FOV (with pcode > 10%): 0.000631694825910198
- The integrated probability of Phil's convolved map that are in BAT FOV (with pcode > 10%): 0.00039813772104523715
- The integrated LIGO localization probability that are outside of the BAT FOV (with pcode > 10%) but above the Earth's limb: 0.39698954698579964
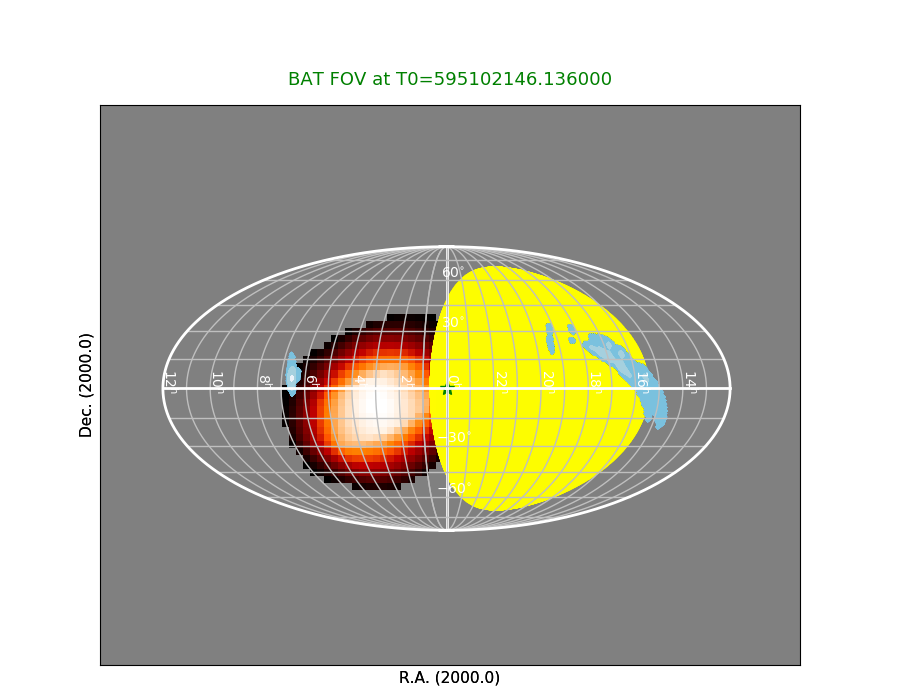 RED: BAT FOV (the brighter/whiter color refers to higher partial coding fraction).
YELLOW: Earth
BLUE: LIGO probability map
GREEN STAR: Input source (location is randomly seleected unless the true source location is available.)
RED: BAT FOV (the brighter/whiter color refers to higher partial coding fraction).
YELLOW: Earth
BLUE: LIGO probability map
GREEN STAR: Input source (location is randomly seleected unless the true source location is available.)
Click here for the BAT GCN circular template
Raw Light Curves
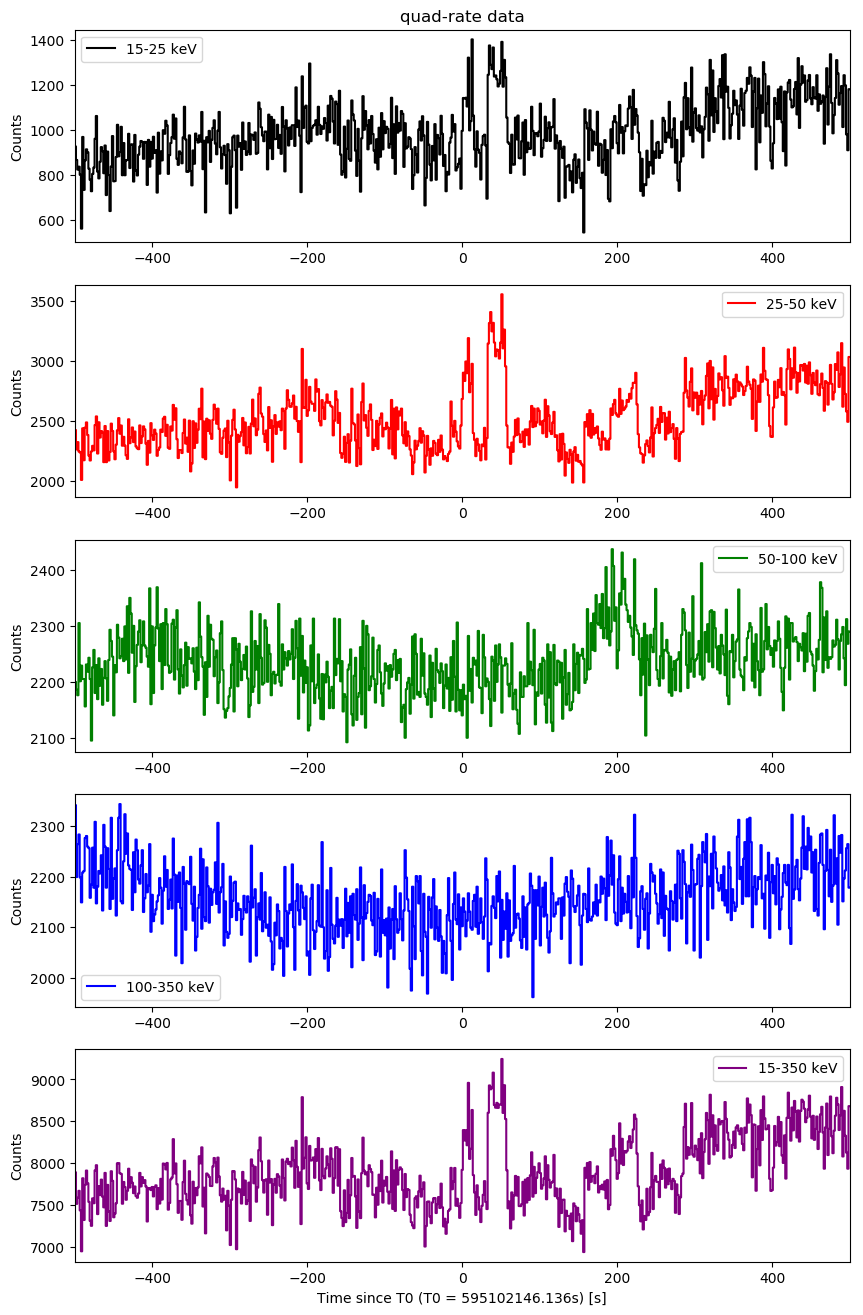
Quad-rate light curves (with 1.6 s time bin)
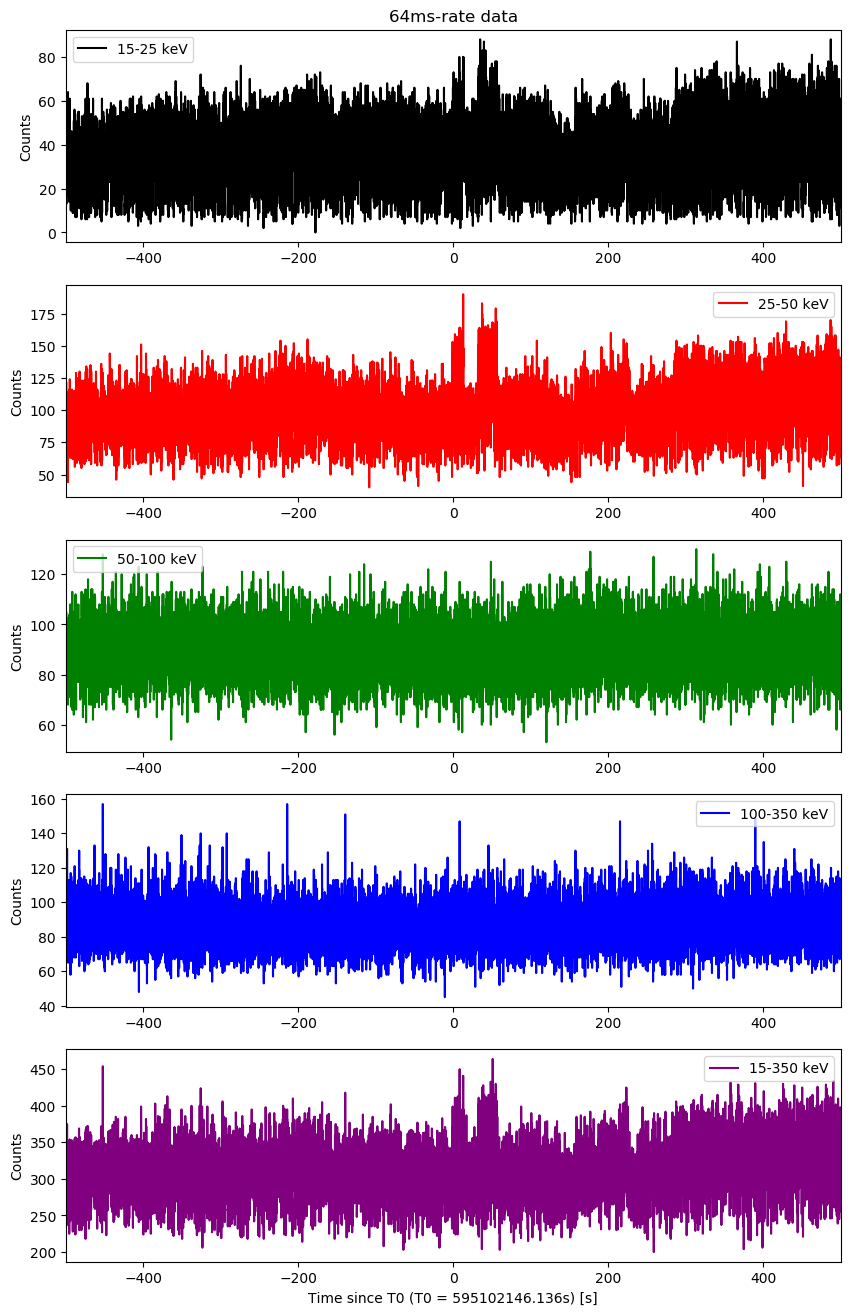
64-ms light curves
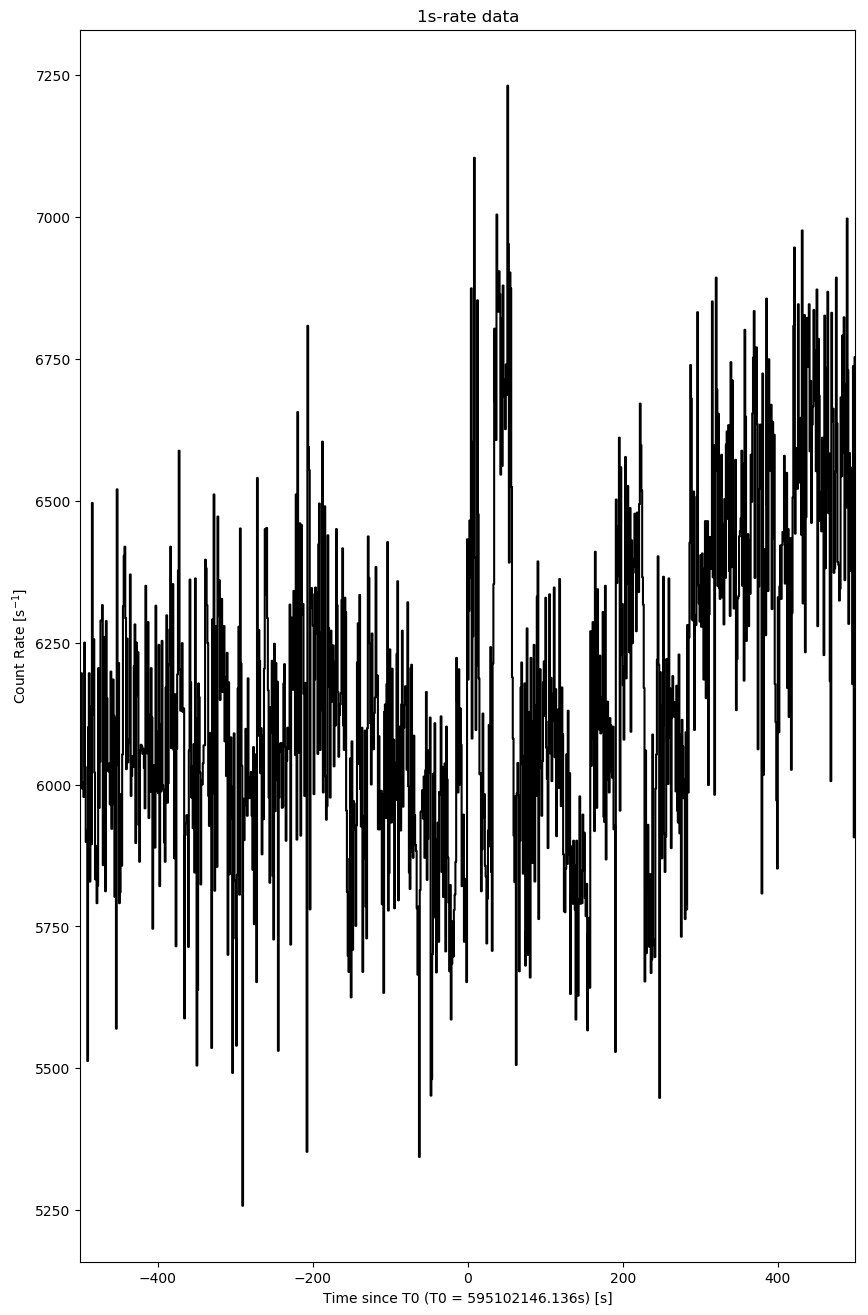
1-s light curves
Event data image search
Event data found. The analysis results are listing below.


## list of detected sources for 03110608006

########################################

########################################
## tstart_since_T0: 0.0
## tstop_since_T0: 0.1

                 TIME                           NAME     RA_OBJ    DEC_OBJ      THETA        PHI        SNR
                    s                                       deg        deg        deg        deg
  1  595102146.136000 Input_source                       0.0000     0.0000    45.2147   -10.5876      0.202
## tstart_since_T0: -2.0
## tstop_since_T0: 8.0

                 TIME                           NAME     RA_OBJ    DEC_OBJ      THETA        PHI        SNR
                    s                                       deg        deg        deg        deg
  1  595102144.136000 Input_source                       0.0000     0.0000    45.2147   -10.5875      2.981
  2  595102144.136000 UNKNOWN                           79.8589    22.2938    46.6477   117.8286      3.973
  3  595102144.136000 UNKNOWN                           32.9389   -39.6630    32.4067   -92.8334      4.524
########################################

########################################
## tstart_since_T0: -101.136
## tstop_since_T0: 98.9167

                 TIME                           NAME     RA_OBJ    DEC_OBJ      THETA        PHI        SNR
                    s                                       deg        deg        deg        deg
  1  595102045.000000 Input_source                       0.0000     0.0000    45.2147   -10.5877     -0.369
  2  595102045.000000 UNKNOWN                          342.6024    -5.4019    61.4618   -20.8883      3.467
########################################
Last update:
Mon Nov 11 01:57:19 EST 2019