Transient Analysis Summary
Summary of the Input Information
T0: 601973722.828999996 [MET] (2020-01-29T06:54:58.435 UTC)
Search time window: T0 +/- 100.0 s
Input source: RA=0.0, DEC=0.0 (source location is randomly seleected, since the true location is unknown.)
Input image: /local/data/bat2/batusers/batgroup/BAT_GW/results/S200129m/bayestar.fits.gz
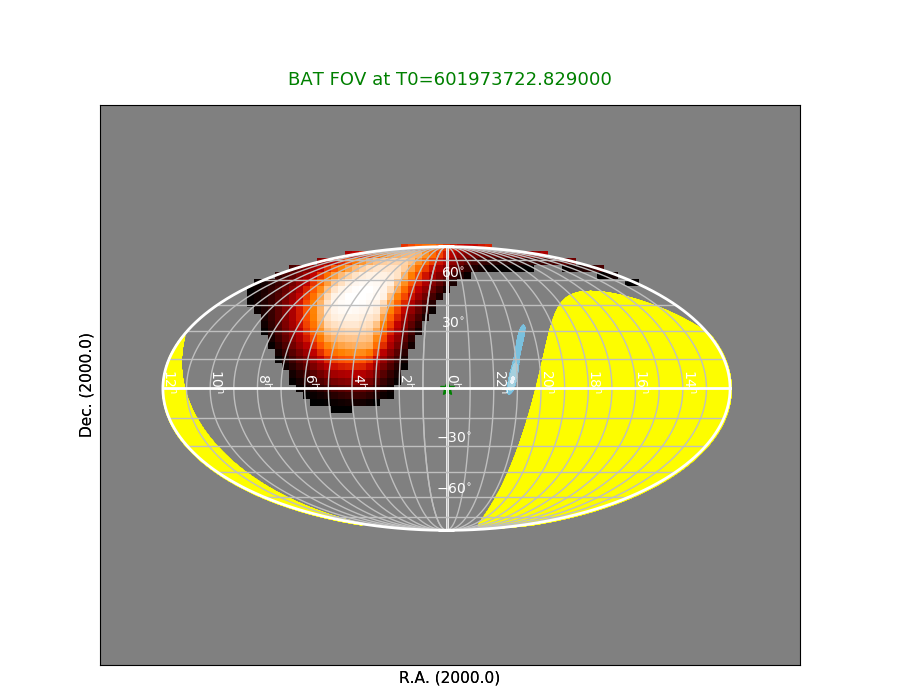
FOV Check
The input source is out of the BAT FOV
Max probability in LIGO map:
Sum of (BAT pcode)*(LIGO probability) of the entire LIGO map:
The integrated LIGO localization probability that are in BAT FOV (with pcode > 10%):
The integrated probability of Phil's convolved map that are in BAT FOV (with pcode > 10%): 0.0
The integrated LIGO localization probability that are outside of the BAT FOV (with pcode > 10%) but above the Earth's limb:
RED: BAT FOV (the brighter/whiter color refers to higher partial coding fraction).
YELLOW: Earth
BLUE: LIGO probability map
GREEN STAR: Input source (location is randomly seleected unless the true source location is available.)
Click here for the BAT GCN circular template
Raw Light Curves
The large struture from ~T-250 s to ~T-50 s is likely due to noisy detector since it only appears in one detector quadrant (see light curve for each detector quadrant here ), and it did not triggered onboard.
The 64-ms light curve made from event data (to exclude contribution from noisy detectors) can be found here
Quad-rate light curves (with 1.6 s time bin)
Bokeh Plot
64-ms light curves
Bokeh Plot
1-s light curves
Bokeh Plot
Event data image search
Event data found. The analysis results are listing below.
Last update:
Wed Jan 29 20:03:49 EST 2020