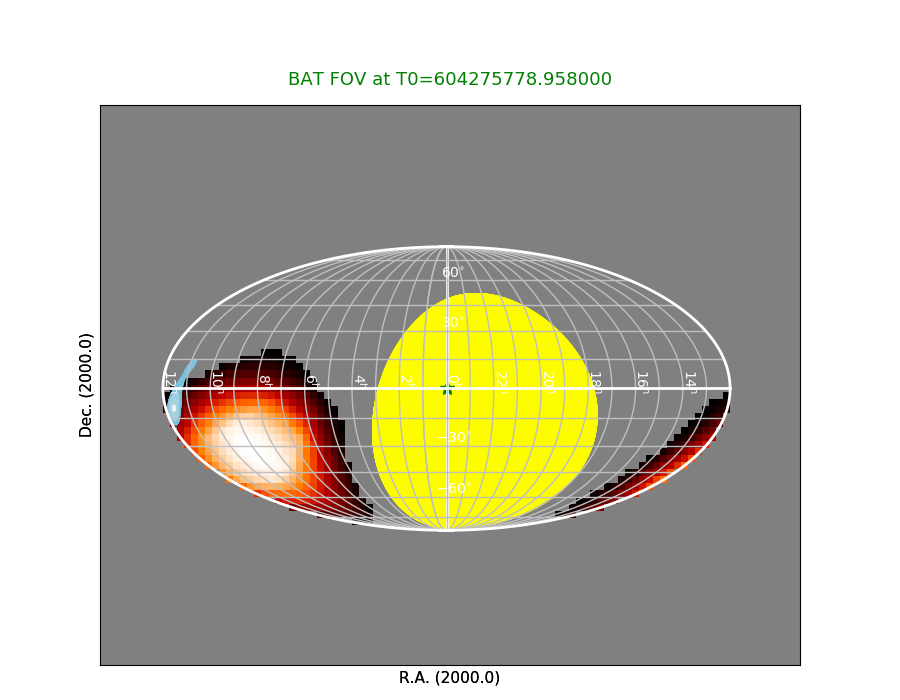
GREEN STAR: Input source (location is randomly seleected unless the true source location is available.)
Raw Light Curves
Quad-rate light curves (with 1.6 s time bin)
Bokeh Plot
64-ms light curves
Bokeh Plot
1-s light curves
Bokeh Plot
Event data image search
Event data found. The analysis results are listing below.


## list of detected sources for 00095121014

########################################

########################################
## tstart_since_T0: -0.1
## tstop_since_T0: 0.1
event data don't cover the request time
## tstart_since_T0: -2.0
## tstop_since_T0: 8.0
event data don't cover the request time
########################################

########################################
## tstart_since_T0: 29.042
## tstop_since_T0: 45.176
## (Because the time interval covers spacecraft slew interval, the
##  image s made from co-adding images of 0.5 s interval)
## Note: source location is reported in Galactic coordinate

# GLONcent GLATcent POSerr  Theta    Phi     Peak Cts     SNR  Name
  238.7236 +50.9654 0.0132   33.8 -148.7       0.0146     5.1  UNKNOWN
  233.0408 +30.8814 0.0136   44.6 -143.0       0.0163     4.8  UNKNOWN
  272.3666 +50.2116 0.0179   34.2  177.6       0.0091     3.8  UNKNOWN
  257.3501 +23.5907 0.0165   24.7 -116.6       0.0098     4.0  UNKNOWN
  326.0290 +38.1919 0.0279   39.8 -125.4       0.0171     2.4  UNKNOWN
########################################
########################################
Last update:
Tue Feb 25 11:48:56 EST 2020