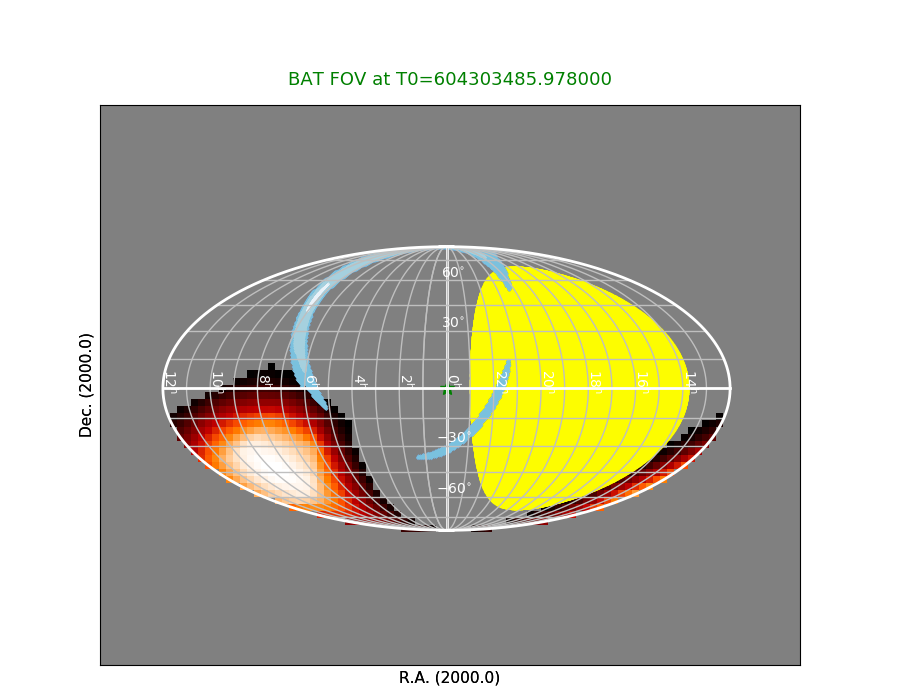
GREEN STAR: Input source (location is randomly seleected unless the true source location is available.)
Raw Light Curves
Quad-rate light curves (with 1.6 s time bin)
Bokeh Plot
64-ms light curves
Bokeh Plot
1-s light curves
Bokeh Plot
Event data image search
Event data found. The analysis results are listing below.


## list of detected sources for 00958363000

########################################

########################################
## tstart_since_T0: -0.1
## tstop_since_T0: 0.1
event data don't cover the request time
## tstart_since_T0: -2.0
## tstop_since_T0: 8.0
event data don't cover the request time
########################################

########################################
## tstart_since_T0: -89.978
## tstop_since_T0: -86.9111

                 TIME                           NAME     RA_OBJ    DEC_OBJ      THETA        PHI        SNR
                    s                                       deg        deg        deg        deg
  1  604303396.000000 Vela X-1                         135.5286   -40.5547     3.1935    98.2859      1.707
  2  604303396.000000 Cen X-3                          170.3158   -60.6230    28.3383  -158.3266      0.018
  3  604303396.000000 GX 301-2                         186.6566   -62.7703    36.3513  -157.9608      0.704
########################################
## list of detected sources for 07031611001

########################################

########################################
## tstart_since_T0: -0.1
## tstop_since_T0: 0.1

                 TIME                           NAME     RA_OBJ    DEC_OBJ      THETA        PHI        SNR
                    s                                       deg        deg        deg        deg
  1  604303485.878000 Vela X-1                         135.5286   -40.5547     3.1933    98.2837     -0.470
  2  604303485.878000 Cen X-3                          170.3158   -60.6230    28.3382  -158.3260     -0.488
  3  604303485.878000 GX 301-2                         186.6566   -62.7703    36.3512  -157.9602     -0.674
  4  604303485.878000 UNKNOWN                          171.6288   -10.7329    46.5860   118.2061      4.376
  5  604303485.878000 UNKNOWN                          193.8877   -71.3800    40.4600  -144.9586      5.180
  6  604303485.878000 UNKNOWN                          161.5284   -80.3702    38.6475  -126.8473      5.089
  7  604303485.878000 UNKNOWN                          171.1907   -80.5495    39.8020  -128.6211      5.135

## tstart_since_T0: -2.0
## tstop_since_T0: 8.0
## (Because the time interval covers spacecraft slew interval, the
##  image s made from co-adding images of 0.2 s interval)

                 TIME                           NAME     RA_OBJ    DEC_OBJ      THETA        PHI        SNR
                    s                                       deg        deg        deg        deg
  1  604303483.978000 UNKNOWN                          158.2357   -29.7798       22.7      -89.5        4.8
  2  604303483.978000 UNKNOWN                          179.2466   -42.2159       26.8      -43.1        4.5
  3  604303483.978000 UNKNOWN                          122.2436   -13.5479       13.5       80.0        3.8
########################################

########################################
## tstart_since_T0: -44.978
## tstop_since_T0: 45.1298
## (Because the time interval covers spacecraft slew interval, the
##  image s made from co-adding images of 0.5 s interval)
## Note: source location is reported in Galactic coordinate

# GLONcent GLATcent POSerr  Theta    Phi     Peak Cts     SNR  Name
  261.4943 -43.2842 0.0145   38.4  171.5       0.0289     4.6  UNKNOWN
  270.3871 +70.4615 0.0200   18.7  179.6       0.1735     3.3  UNKNOWN
  261.4929 -43.2853 0.0140   36.8   98.9       0.0294     4.8  UNKNOWN
  280.7847 +17.9641 0.0155   19.9  -60.0       0.0049     4.3  UNKNOWN
  274.8724 +40.2125 0.0165   34.7  -84.3       0.0094     4.1  UNKNOWN
  271.4816  +8.0154 0.0171    8.1  -79.6       0.0040     3.9  UNKNOWN
########################################
Last update:
Tue Feb 25 15:54:16 EST 2020