Analysis Summary
Notes:
- 1) No attempt has been made to eliminate the non-significant decimal places.
- 2) This batgrbproduct analysis is done using the HEASARC data.
- 3) This batgrbproduct analysis is using the flight position for the mask-weighting calculation.
======================================================================
                  BAT GRB EVENT DATA PROCESSING REPORT
    Process Script Ver: batgrbproduct v2.46
    Process Start Time: Wed Jan 22 22:13:48 EST 2014
             Host Name: batevent1
   Current Working Dir: /local/data/batevent/batevent_reproc/trigger115214
======================================================================

  Trigger: 00115214      Segment: 000

  BAT Trigger Time: 135849159.296   [s; MET]
      Trigger Stop: 135849171.456   [s; MET]
               UTC: 2005-04-22T07:52:39.807480    [includes UTCF correction]
       Where From?: TDRSS position message

  BAT
    RA: 324.454526255759   Dec: 55.7987882060191  [deg; J2000]

     Catalogged Source?: NO
     Point Source?:      YES
     GRB Indicated?:     YES    [ by BAT flight software ]
     Image S/N Ratio:    8
     Image Trigger?:     NO
     Rate S/N Ratio:     12.2474487139159  [ if not an image trigger ]
     Image S/N Ratio:    8

  Analysis Position:   [ source = BAT ]
    RA: 324.454526255759   Dec: 55.7987882060191  [deg; J2000]

  Refined Position:   [ source = BAT pre-slew burst ]
    RA: 324.501239345773   Dec: 55.7877289051303  [deg; J2000]
        { 21h 38m 00.3s , +55d 47' 15.8" }
         +/- 1.85772367388165 [arcmin] (estimated 90% radius based on SNR)
         +/- 0.885146190185677 [arcmin] (formal 1-sigma fit error)
    SNR: 12.5562410194054

  Angular difference between the analysis and refined position is 1.709693 arcmin

  Partial Coding Fraction: 0.9453125    [ including projection effects ]

  Duration
     T90: 80 +/- 22.6274169979695
        Measured from: -11.2960000038147
                   to: 68.7039999961853     [s; relative to TRIGTIME]
     T50: 48 +/- 16
        Measured from: 4.7039999961853
                   to: 52.7039999961853     [s; relative to TRIGTIME]


  Fluence
     Peak Flux  (peak 1 second)
        Measured from: 60.2039999961853
                   to: 61.2039999961853     [s; relative to TRIGTIME]
     Total Fluence
        Measured from: -11.2960000038147
                   to: 68.7039999961853     [s; relative to TRIGTIME]

             Band 1     Band 2     Band 3     Band 4
              15-25      25-50     50-100    100-350     keV
 Total     0.289943   0.315488   0.292478   0.017629
           0.039190   0.040360   0.034604   0.028776 [error]
 Peak      0.015546   0.009816   0.006304   0.000805
           0.004389   0.004546   0.003939   0.003262 [error]

     [ fluence units of on-axis counts / fully illuminated detector ]

======================================================================


====== Table of the duration information =============================

        Value   tstart    tstop
T100   80.000  -11.296   68.704
T90    80.000  -11.296   68.704
T50    48.000    4.704   52.704
Peak    1.000   60.204   61.204


====== Spectral Analysis Summary =====================================

Model      : spectral model: simple power-law (PL) and cutoff power-law (CPL)
Ph_index   : photon index: E^{Ph_index}
Ph_90err   : 90% error of the photon index
Epeak      : Epeak in keV
Epeak_90err: 90% error of Epeak
Norm       : normalization at 50 keV in both the PL model and CPL model
Nomr_90err : 90% error of the normalization
chi2       : Chi-Squared
dof        : degree of freedo

=== Time-averaged spectral analysis ===
(Best model with acceptable fit: PL)

Model Ph_index Ph_90err_low Ph_90err_hi  Epeak  Epeak_90err_low  Epeak_90err_hi  Norm       Nomr_90err_low    Norm_90err_hi    chi2    dof
PL      -1.406    -0.205      0.204       -           -               -         7.84e-04     -9.57e-05          9.53e-05      42.170   57
CPL     -0.668    -0.809      1.036       91.635     -28.366       -91.635      1.83e-03     -1.08e-03          3.91e-03      39.920   56


=== 1-s peak spectral analysis ===
(Best model with acceptable fit: N/A)

Model Ph_index Ph_90err_low Ph_90err_hi  Epeak  Epeak_90err_low  Epeak_90err_hi  Norm       Nomr_90err_low    Norm_90err_hi    chi2    dof
PL      -1.898     -0.950     0.758       -           -               -         1.87e-03     -1.87e-03          9.17e-04      50.920   57
CPL     -1.902      N/A       N/A        9986.260      N/A           N/A         1.87e-03        N/A               N/A         50.920   56


=== Fluence/Peak Flux Summary ===

              Model    Band1     Band2     Band3     Band4     Band5     Total
                       15-25     25-50    50-100    100-350    15-150    15-350    keV
Fluence         PL   7.34e-08  1.43e-07  2.16e-07  7.06e-07  6.06e-07  1.14e-06   erg/cm2
      90%_error_low -1.46e-08 -1.82e-08 -3.34e-08 -2.08e-07 -8.16e-08 -2.38e-07   erg/cm2
      90%_error_hi   1.54e-08  1.80e-08  3.32e-08  2.60e-07  8.26e-08  2.81e-07   erg/cm2
Peak flux       PL   1.13e-01  9.00e-02  4.83e-02  3.78e-02  2.69e-01  2.89e-01   ph/cm2/s
      90%_error_low -6.01e-02 -3.55e-02 -3.14e-02 -3.78e-02 -1.03e-01 -1.15e-01   ph/cm2/s
      90%_error_hi   6.47e-02  3.49e-02  3.37e-02  7.60e-02  1.03e-01  1.18e-01   ph/cm2/s

Fluence        CPL   6.44e-08  1.54e-07  2.26e-07  2.68e-07  5.75e-07  7.12e-07   erg/cm2
      90%_error_low -1.81e-08 -2.21e-08 -3.73e-08 -1.66e-07 -8.83e-08 -1.88e-07   erg/cm2
      90%_error_hi   1.84e-08  2.30e-08  3.82e-08  5.09e-07  8.98e-08  5.15e-07   erg/cm2
Peak flux      CPL     N/A      N/A      N/A      N/A      N/A      N/A     ph/cm2/s
      90%_error_low -6.01e-02 -3.55e-02 -3.14e-02 -3.78e-02 -1.03e-01 -1.15e-01   ph/cm2/s
      90%_error_hi   6.47e-02  3.49e-02  3.37e-02  7.60e-02  1.03e-01  1.18e-01   ph/cm2/s

======================================================================
Image
Pre-slew 15.0-350.0 keV image (Event data)
#   RAcent    DECcent   POSerr    Theta     Phi              Peak Cts       SNR   Name
  324.5012    55.7877   0.0153    19.1736   -35.1029         0.8787404     12.556 TRIG_00115214

Foreground time interval of the image:
-11.296  58.205 (delta_t =  69.501 [sec])
Background time interval of the image:
-299.296 -11.296 (delta_t = 288.000 [sec])
Light Curves
Note: The mask-weighted lightcurves have units of either count/det or counts/sec/det, where a det is 0.4 x 0.4 = 0.16 sq cm.
Full-time range; 1 s binning
Other quick-look light curves:
- 64 ms binning (zoomed)
- 16 ms binning (zoomed)
- 8 ms binning (zoomed)
- 2 ms binning (zoomed)
- SN=5 or 10 s binning (full-time range)
- Raw light curve
Spectra
- 64 ms binning (zoomed)
- 16 ms binning (zoomed)
- 8 ms binning (zoomed)
- 2 ms binning (zoomed)
- SN=5 or 10 s binning (full-time range)
- Raw light curve
Spectra
Notes:
- 1) The fitting includes the systematic errors.
- 2) When the burst includes telescope slew time periods, the fitting uses an average response file made from multiple 5-s response files through out the slew time plus single time preiod for the non-slew times, and weighted by the total counts in the corresponding time period using addrmf. An average response file is needed becuase a spectral fit using the pre-slew DRM will introduce some errors in both a spectral shape and a normalization if the PHA file contains a lot of the slew/post-slew time interval.
- 3) For fits to more complicated models (e.g. a power-law over a cutoff power-law), the BAT team has decided to require a chi-square improvement of more than 6 for each extra dof.
Time averaged spectrum fit using the average DRM
Power-law model
Time interval is from  -11.296 sec. to   68.704 sec.

Spectral model in power-law:
------------------------------------------------------------
Parameters  : value       lower 90%   higher 90%
Photon index: -1.4058     ( -0.204754   0.203983 )
Norm@50keV  : 7.84418E-04    ( -9.57121e-05   9.53279e-05 )
------------------------------------------------------------
#Fit statistic : Chi-Squared =          42.17 using 59 PHA bins.
# Reduced chi-squared =         0.7398 for     57 degrees of freedom
# Null hypothesis probability =   9.289614e-01

Photon flux (15-150 keV)    in 80 sec: 9.56555E-02 ( -0.0116354  0.0116525 ) ph/cm2/s
Energy fluence (15-150 keV)             : 6.05731e-07 ( -8.1636e-08  8.2588e-08 ) ergs/cm2
Cutoff power-law model
Time interval is from  -11.296 sec. to   68.704 sec.
Spectral model in the cutoff power-law:
------------------------------------------------------------
Parameters  : value       lower 90%   higher 90%
Photon index: -0.668047     ( -0.809141   1.03646 )
Epeak [keV] : 91.6345      ( -28.366 -91.634 )
Norm@50keV  : 1.82874E-03    ( -0.00108163   0.00390597 )
------------------------------------------------------------
#Fit statistic : Chi-Squared =          39.92 using 59 PHA bins.
# Reduced chi-squared =         0.7129 for     56 degrees of freedom
# Null hypothesis probability =   9.485315e-01

Photon flux (15-150 keV)    in 80 sec: 9.27179E-02 ( -0.012216  0.0121581 ) ph/cm2/s
Energy fluence (15-150 keV)             : 5.7491e-07 ( -8.82792e-08  8.97656e-08 ) ergs/cm2
1-s peak spectrum fit
Power-law model
Time interval is from   60.204 sec. to   61.204 sec.

Spectral model in power-law:
------------------------------------------------------------
Parameters  : value       lower 90%   higher 90%
Photon index: -1.89769     ( -0.950407   0.757643 )
Norm@50keV  : 1.87296E-03    ( -0.00187296   0.000917349 )
------------------------------------------------------------
#Fit statistic : Chi-Squared =          50.92 using 59 PHA bins.
# Reduced chi-squared =         0.8933 for     57 degrees of freedom
# Null hypothesis probability =   7.012840e-01

Photon flux (15-150 keV)    in 1 sec: 0.268543 ( -0.103464  0.103493 ) ph/cm2/s
Energy fluence (15-150 keV)             : 1.72223e-08 ( -8.2635e-09  9.1125e-09 ) ergs/cm2
Cutoff power-law model
Time interval is from   60.204 sec. to   61.204 sec.
Spectral model in the cutoff power-law:
------------------------------------------------------------
Parameters  : value       lower 90%   higher 90%
Photon index: -1.90244     (       )
Epeak [keV] : 9986.26      (   )
Norm@50keV  : 1.87136E-03    (     )
------------------------------------------------------------
#Fit statistic : Chi-Squared =          50.92 using 59 PHA bins.
# Reduced chi-squared =         0.9093 for     56 degrees of freedom
# Null hypothesis probability =   6.670875e-01

Photon flux (15-150 keV)    in 1 sec:  (    ) ph/cm2/s
Energy fluence (15-150 keV)             : 1.55085e-08 ( -1.27992e-08  7.92623e-09 ) ergs/cm2
Time-resolved spectra
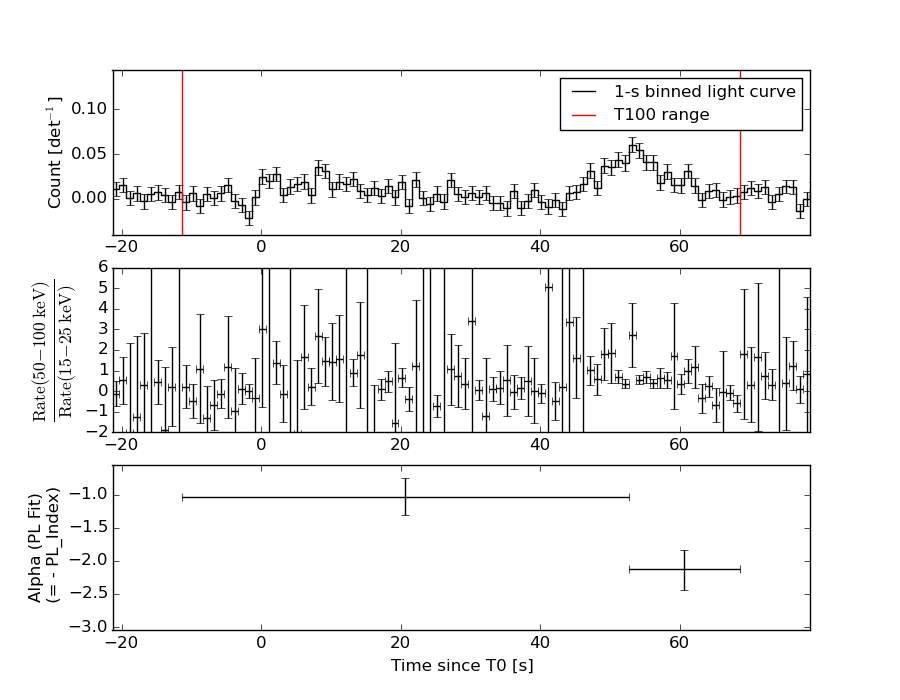
Distribution
T90 vs. Hardness ratio plot
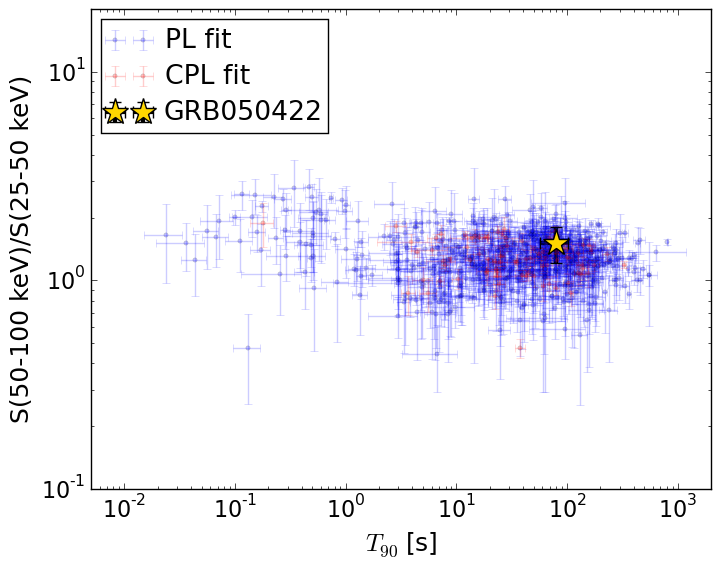
T90                                   = 80.0 sec.
Hardness ratio (energy fluence ratio) = 1.50969862147
S(15-50 keV) vs. S(50-150 keV) plot
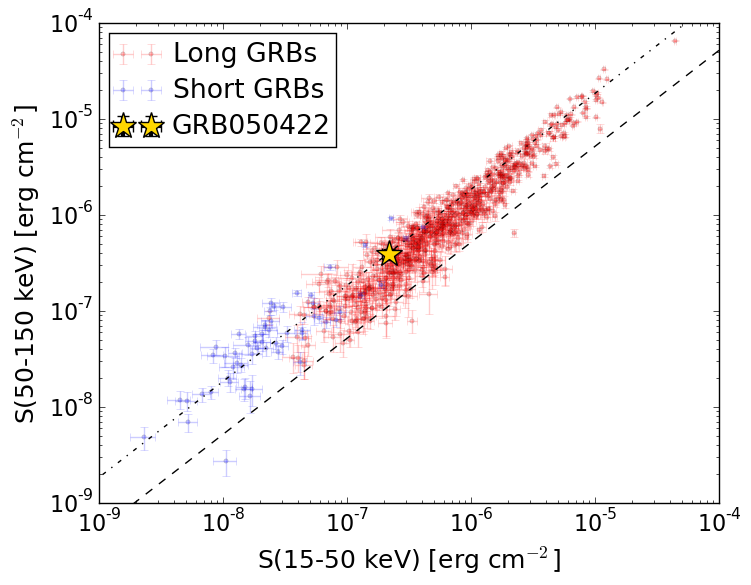
S(15-50 keV)  = 2.161656e-07
S(50-150 keV) = 3.895709e-07
The dash-dotted line and the dashed line traces the fluences calculated from the Band function with Epeak = 15 and 150 keV, respectively. Both lines assume a canonical values of alpha = -1 and beta = -2.5.
Mask shadow pattern
IMX = 2.844767274583667E-01, IMY = 1.999549731332068E-01
Spacecraft aspect plot
Bright source in the pre-burst/pre-slew/post-slew images
Pre-burst image of 15-350 keV band
Time interval of the image:
-299.296000 -11.296000

# RAcent  DECcent POSerr Theta    Phi  PeakCts   SNR AngSep     Name
#  [deg]    [deg]    ['] [deg]  [deg]                   [']
299.5876  35.1951    0.4  38.6    5.5   8.0015  32.3    0.4	Cyg X-1
308.0878  40.9826    1.0  32.7   -5.7   2.2154  11.0    2.1	Cyg X-3
326.1613  38.3176   56.2  36.5  -29.8   0.0458   0.2    0.5	Cyg X-2
298.8513  32.0826    2.2  41.8    6.2   1.5023   5.4 ------	UNKNOWN
322.9941  32.4149    2.2  42.0  -24.5   1.4604   5.3 ------	UNKNOWN
104.3667  46.2937    5.0  59.0 -166.2   3.3620   2.3 ------	UNKNOWN
 65.7784  48.9442    3.9  50.6 -136.1   2.7181   3.0 ------	UNKNOWN
Pre-slew background subtracted image of 15-350 keV band
Time interval of the image:
-11.296000 58.204590

# RAcent  DECcent POSerr Theta    Phi  PeakCts   SNR AngSep     Name
#  [deg]    [deg]    ['] [deg]  [deg]                   [']
299.4486  35.1721   12.1  38.7    5.7   0.1097   0.9    7.2	Cyg X-1
307.9398  40.9386   10.8  32.7   -5.5   0.0951   1.1    7.8	Cyg X-3
326.2300  38.3448    4.7  36.5  -29.9   0.2500   2.5    3.1	Cyg X-2
323.0339  66.9606    2.5   8.5  -50.7   0.3309   4.6 ------	UNKNOWN
324.5013  55.7878    0.9  19.2  -35.1   0.8791  12.6 ------	UNKNOWN
Post-slew image of 15-350 keV band
Time interval of the image:
98.604600 302.810700

# RAcent  DECcent POSerr Theta    Phi  PeakCts   SNR AngSep     Name
#  [deg]    [deg]    ['] [deg]  [deg]                   [']
299.5910  35.2007    0.3  26.7   36.4   6.0546  37.6    0.1	Cyg X-1
308.0921  40.9479    1.0  18.3   29.1   1.6224  12.1    0.9	Cyg X-3
326.1551  38.3959   18.8  17.4  -18.0   0.0843   0.6    4.5	Cyg X-2
292.7716  65.9850    2.9  18.2  123.3   0.6220   4.0 ------	UNKNOWN
332.2976  -2.7094    2.9  58.9  -22.7   4.0241   4.0 ------	UNKNOWN
 53.5457  49.4835    2.8  50.6 -136.3   3.1469   4.1 ------	UNKNOWN
359.1567  20.7419    4.4  43.5  -64.1   1.9841   2.6 ------	UNKNOWN
348.3568   8.6761    3.6  50.8  -44.6   2.6737   3.2 ------	UNKNOWN