Analysis Summary
Notes:
- 1) No attempt has been made to eliminate the non-significant decimal places.
- 2) This batgrbproduct analysis is done using the HEASARC data.
- 3) This batgrbproduct analysis is using the flight position for the mask-weighting calculation.
======================================================================
                  BAT GRB EVENT DATA PROCESSING REPORT
    Process Script Ver: batgrbproduct v2.46
    Process Start Time: Wed Jun 24 01:28:37 EDT 2015
             Host Name: bat1
   Current Working Dir: /local/data/bat1/alien/Swift_3rdBATcatalog/event/batevent_reproc/trigger240766
======================================================================

  Trigger: 00240766      Segment: 000

  BAT Trigger Time: 186223678.016   [s; MET]
      Trigger Stop: 186223679.04   [s; MET]
               UTC: 2006-11-26T08:47:56.420860    [includes UTCF correction]
       Where From?: TDRSS position message

  BAT
    RA: 86.6247167166277   Dec: 64.1900414481625  [deg; J2000]

     Catalogged Source?: NO
     Point Source?:      YES
     GRB Indicated?:     YES    [ by BAT flight software ]
     Image S/N Ratio:    8.76
     Image Trigger?:     NO
     Rate S/N Ratio:     24.6170672501823  [ if not an image trigger ]
     Image S/N Ratio:    8.76

  Analysis Position:   [ source = BAT ]
    RA: 86.6247167166277   Dec: 64.1900414481625  [deg; J2000]

  Refined Position:   [ source = BAT pre-slew burst ]
    RA: 86.6170343148871   Dec: 64.2052348257638  [deg; J2000]
        { 05h 46m 28.1s , +64d 12' 18.8" }
         +/- 0.701287795139724 [arcmin] (estimated 90% radius based on SNR)
         +/- 0.172785523399791 [arcmin] (formal 1-sigma fit error)
    SNR: 50.4971130999758

  Angular difference between the analysis and refined position is 0.933420 arcmin

  Partial Coding Fraction: 0.4921875    [ including projection effects ]

  Duration
     T90: 52.6240000128746 +/- 10.7603732051911
        Measured from: -0.967999994754791
                   to: 51.6560000181198     [s; relative to TRIGTIME]
     T50: 14.8560000061989 +/- 0.451220573564801
        Measured from: 6
                   to: 20.8560000061989     [s; relative to TRIGTIME]


  Fluence
     Peak Flux  (peak 1 second)
        Measured from: 6.66400000452995
                   to: 7.66400000452995     [s; relative to TRIGTIME]
     Total Fluence
        Measured from: -5.20800000429153
                   to: 90.2159999907017     [s; relative to TRIGTIME]

             Band 1     Band 2     Band 3     Band 4
              15-25      25-50     50-100    100-350     keV
 Total     2.075817   3.142490   3.173302   1.054855
           0.070256   0.074947   0.069718   0.059509 [error]
 Peak      0.191699   0.388346   0.476143   0.200387
           0.010648   0.013647   0.014977   0.013114 [error]

     [ fluence units of on-axis counts / fully illuminated detector ]

======================================================================


====== Table of the duration information =============================

        Value   tstart    tstop
T100   95.424   -5.208   90.216
T90    52.624   -0.968   51.656
T50    14.856    6.000   20.856
Peak    1.000    6.664    7.664


====== Spectral Analysis Summary =====================================

Model      : spectral model: simple power-law (PL) and cutoff power-law (CPL)
Ph_index   : photon index: E^{Ph_index}
Ph_90err   : 90% error of the photon index
Epeak      : Epeak in keV
Epeak_90err: 90% error of Epeak
Norm       : normalization at 50 keV in both the PL model and CPL model
Nomr_90err : 90% error of the normalization
chi2       : Chi-Squared
dof        : degree of freedo

=== Time-averaged spectral analysis ===
(Best model with acceptable fit: PL)

Model Ph_index Ph_90err_low Ph_90err_hi  Epeak  Epeak_90err_low  Epeak_90err_hi  Norm       Nomr_90err_low    Norm_90err_hi    chi2    dof
PL      -1.231    -0.050      0.050       -           -               -         6.93e-03     -1.84e-04          1.84e-04      49.900   57
CPL     -1.167    -0.085      0.176      718.068    -718.068      -718.068      7.38e-03     -8.98e-04          1.28e-03      50.000   56


=== 1-s peak spectral analysis ===
(Best model with acceptable fit: N/A)

Model Ph_index Ph_90err_low Ph_90err_hi  Epeak  Epeak_90err_low  Epeak_90err_hi  Norm       Nomr_90err_low    Norm_90err_hi    chi2    dof
PL      -0.885     -0.066     0.066       -           -               -         8.50e-02     -3.17e-03          3.16e-03      83.700   57
CPL     -0.764     -0.148     0.260      609.595    -609.595      -609.595      9.59e-02     -7.38e-03          2.70e-02      83.010   56


=== Fluence/Peak Flux Summary ===

              Model    Band1     Band2     Band3     Band4     Band5     Total
                       15-25     25-50    50-100    100-350    15-150    15-350    keV
Fluence         PL   6.57e-07  1.42e-06  2.43e-06  9.52e-06  6.65e-06  1.40e-05   erg/cm2
      90%_error_low -3.75e-08 -4.76e-08 -7.12e-08 -6.52e-07 -1.81e-07 -6.80e-07   erg/cm2
      90%_error_hi   3.84e-08  4.74e-08  7.10e-08  6.86e-07  1.81e-07  7.08e-07   erg/cm2
Peak flux       PL   3.28e-04  9.20e-03  1.03e-01  9.92e+00  4.61e-01  9.92e+00   ph/cm2/s
      90%_error_low     N/A       N/A       N/A       N/A       N/A       N/A     ph/cm2/s
      90%_error_hi      N/A       N/A       N/A       N/A       N/A       N/A     ph/cm2/s

Fluence        CPL   6.56e-07  1.43e-06  2.43e-06  9.59e-06  6.64e-06  1.34e-05   erg/cm2
      90%_error_low -5.85e-08 -4.93e-08 -8.04e-08 -2.50e-06 -1.93e-07 -1.79e-06   erg/cm2
      90%_error_hi   3.08e-08  4.93e-08  9.00e-08  3.08e-07  1.83e-07  6.38e-07   erg/cm2
Peak flux      CPL     N/A      N/A      N/A      N/A      N/A      N/A     ph/cm2/s
      90%_error_low     N/A       N/A       N/A       N/A       N/A       N/A     ph/cm2/s
      90%_error_hi      N/A       N/A       N/A       N/A       N/A       N/A     ph/cm2/s

======================================================================
Image
Pre-slew 15.0-350.0 keV image (Event data)
#   RAcent    DECcent   POSerr    Theta     Phi              Peak Cts       SNR   Name
   86.6170    64.2052   0.0038    36.1747    18.9473        10.0093052     50.497 TRIG_00240766

Foreground time interval of the image:
 -5.208  90.216 (delta_t =  95.424 [sec])
Background time interval of the image:
-239.016  -5.208 (delta_t = 233.808 [sec])
Light Curves
Note: The mask-weighted lightcurves have units of either count/det or counts/sec/det, where a det is 0.4 x 0.4 = 0.16 sq cm.
Full-time range; 1 s binning
Other quick-look light curves:
- 64 ms binning (zoomed)
- 16 ms binning (zoomed)
- 8 ms binning (zoomed)
- 2 ms binning (zoomed)
- SN=5 or 10 s binning (full-time range)
- Raw light curve
Spectra
- 64 ms binning (zoomed)
- 16 ms binning (zoomed)
- 8 ms binning (zoomed)
- 2 ms binning (zoomed)
- SN=5 or 10 s binning (full-time range)
- Raw light curve
Spectra
Notes:
- 1) The fitting includes the systematic errors.
- 2) When the burst includes telescope slew time periods, the fitting uses an average response file made from multiple 5-s response files through out the slew time plus single time preiod for the non-slew times, and weighted by the total counts in the corresponding time period using addrmf. An average response file is needed becuase a spectral fit using the pre-slew DRM will introduce some errors in both a spectral shape and a normalization if the PHA file contains a lot of the slew/post-slew time interval.
- 3) For fits to more complicated models (e.g. a power-law over a cutoff power-law), the BAT team has decided to require a chi-square improvement of more than 6 for each extra dof.
Time averaged spectrum fit using the average DRM
Power-law model
Time interval is from   -5.208 sec. to   90.216 sec.

Spectral model in power-law:
------------------------------------------------------------
Parameters  : value       lower 90%   higher 90%
Photon index: -1.23095     ( -0.0496593   0.0498784 )
Norm@50keV  : 6.93195E-03    ( -0.000183921   0.000183594 )
------------------------------------------------------------
#Fit statistic : Chi-Squared =          49.90 using 59 PHA bins.
# Reduced chi-squared =         0.8754 for     57 degrees of freedom
# Null hypothesis probability =   7.362471e-01

Photon flux (15-150 keV)    in 95.42 sec: 0.817397 ( -0.023678  0.023781 ) ph/cm2/s
Energy fluence (15-150 keV)             : 6.65426e-06 ( -1.812e-07  1.81387e-07 ) ergs/cm2
Cutoff power-law model

Time interval is from   -5.208 sec. to   90.216 sec.
Spectral model in the cutoff power-law:
------------------------------------------------------------
Parameters  : value       lower 90%   higher 90%
Photon index: -1.16658     ( -0.0734339   0.187444 )
Epeak [keV] : 718.068      ( -947.383 -947.383 )
Norm@50keV  : 7.38302E-03    ( -0.000798077   0.00138264 )
------------------------------------------------------------
#Fit statistic : Chi-Squared =          50.00 using 59 PHA bins.
# Reduced chi-squared =         0.8929 for     56 degrees of freedom
# Null hypothesis probability =   7.000148e-01

Photon flux (15-150 keV)    in 95.42 sec: 0.815460 ( -0.027767  0.026662 ) ph/cm2/s
Energy fluence (15-150 keV)             : 6.63788e-06 ( -1.92638e-07  1.82511e-07 ) ergs/cm2
1-s peak spectrum fit
Power-law model
Time interval is from    6.664 sec. to    7.664 sec.

Spectral model in power-law:
------------------------------------------------------------
Parameters  : value       lower 90%   higher 90%
Photon index: -0.885226     ( -0.065759   0.0663688 )
Norm@50keV  : 8.50477E-02    ( -0.00316903   0.00315804 )
------------------------------------------------------------
#Fit statistic : Chi-Squared =          83.70 using 59 PHA bins.
# Reduced chi-squared =          1.468 for     57 degrees of freedom
# Null hypothesis probability =   1.216634e-02

Photon flux (15-150 keV)    in 1 sec: 0.461441 (    ) ph/cm2/s
Energy fluence (15-150 keV)             : 9.60086e-07 ( -3.84063e-08  3.85104e-08 ) ergs/cm2
Cutoff power-law model
Time interval is from    6.664 sec. to    7.664 sec.
Spectral model in the cutoff power-law:
------------------------------------------------------------
Parameters  : value       lower 90%   higher 90%
Photon index: -0.763882     ( -0.148371   0.259882 )
Epeak [keV] : 609.595      ( -609.595 -609.595 )
Norm@50keV  : 9.58656E-02    ( -0.00737951   0.0270387 )
------------------------------------------------------------
#Fit statistic : Chi-Squared =          83.01 using 59 PHA bins.
# Reduced chi-squared =          1.482 for     56 degrees of freedom
# Null hypothesis probability =   1.102156e-02

Photon flux (15-150 keV)    in 1 sec:  (    ) ph/cm2/s
Energy fluence (15-150 keV)             : 9.55586e-07 ( -3.98295e-08  3.96361e-08 ) ergs/cm2
Time-resolved spectra
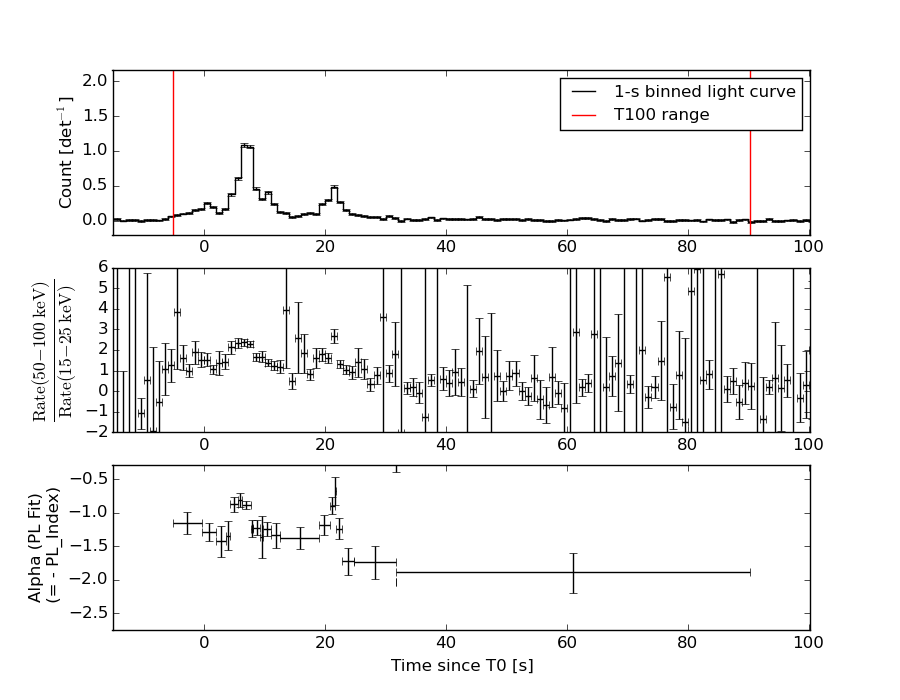
Distribution
T90 vs. Hardness ratio plot
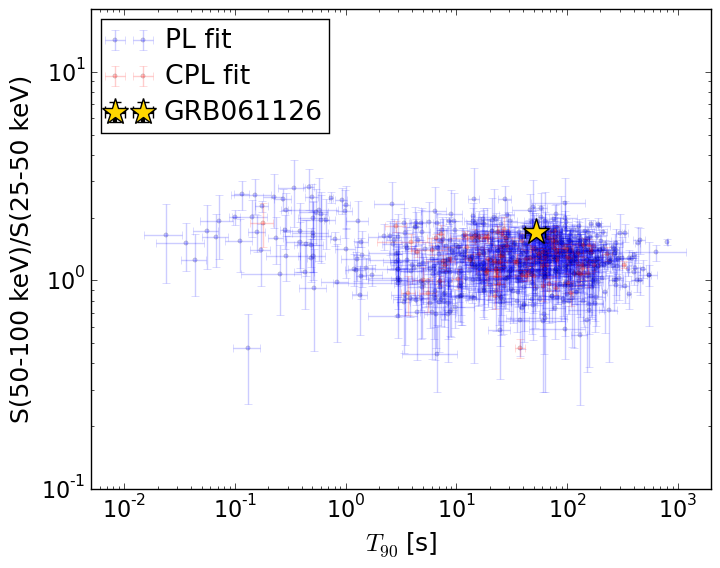
T90                                   = 52.624 sec.
Hardness ratio (energy fluence ratio) = 1.70415757506
S(15-50 keV) vs. S(50-150 keV) plot
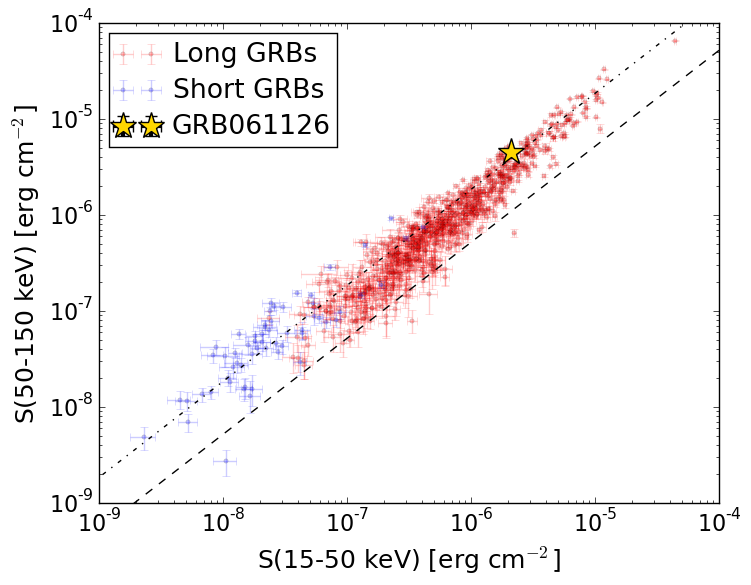
S(15-50 keV)  = 2.0802532e-06
S(50-150 keV) = 4.573998e-06
The dash-dotted line and the dashed line traces the fluences calculated from the Band function with Epeak = 15 and 150 keV, respectively. Both lines assume a canonical values of alpha = -1 and beta = -2.5.
Mask shadow pattern
IMX = 6.915929901568856E-01, IMY = -2.374231425521771E-01
Spacecraft aspect plot
Bright source in the pre-burst/pre-slew/post-slew images
Pre-burst image of 15-350 keV band
Time interval of the image:
-239.016000 -5.208000

# RAcent  DECcent POSerr Theta    Phi  PeakCts   SNR AngSep     Name
#  [deg]    [deg]    ['] [deg]  [deg]                   [']
308.0607  40.9364    2.8  39.4 -119.5   1.4454   4.1    2.4	Cyg X-3
326.1088  38.3519    7.6  32.4 -140.6   0.2871   1.5    3.5	Cyg X-2
 16.1722  11.3184    2.4  48.7  137.7   3.2541   4.7 ------	UNKNOWN
 52.3964  39.9324    2.4  35.1   74.2   1.6498   4.8 ------	UNKNOWN
 19.1434  30.7440    2.6  30.1  127.7   1.0365   4.4 ------	UNKNOWN
 12.2996  44.0947    3.1  15.8  133.0   0.5591   3.7 ------	UNKNOWN
330.1431   9.6867    2.8  56.2 -164.9   2.4222   4.1 ------	UNKNOWN
293.3266  48.8490    3.7  41.2  -99.5   2.5389   3.1 ------	UNKNOWN
Pre-slew background subtracted image of 15-350 keV band
Time interval of the image:
-5.208000 90.216000

# RAcent  DECcent POSerr Theta    Phi  PeakCts   SNR AngSep     Name
#  [deg]    [deg]    ['] [deg]  [deg]                   [']
308.0801  41.0504    7.1  39.3 -119.4   0.4535   1.6    6.0	Cyg X-3
326.1883  38.2450   13.2  32.4 -140.8  -0.1355  -0.9    4.7	Cyg X-2
 86.6170  64.2052    0.2  36.2   18.9  10.0096  50.5 ------	UNKNOWN
244.0166  67.6188    2.3  46.0  -54.8   2.3551   5.0 ------	UNKNOWN
Post-slew image of 15-350 keV band
Time interval of the image: