Analysis Summary
Notes:
- 1) No attempt has been made to eliminate the non-significant decimal places.
- 2) This batgrbproduct analysis is done using the HEASARC data.
- 3) This batgrbproduct analysis is using the flight position for the mask-weighting calculation.
======================================================================
BAT GRB EVENT DATA PROCESSING REPORT
Process Script Ver: batgrbproduct v2.46
Process Start Time: Mon Jan 20 09:32:02 EST 2014
Host Name: batevent1
Current Working Dir: /local/data/batevent/batevent_reproc/trigger279898
======================================================================
Trigger: 00279898 Segment: 000
BAT Trigger Time: 201375895.232 [s; MET]
Trigger Stop: 201375899.328 [s; MET]
UTC: 2007-05-20T17:44:53.264200 [includes UTCF correction]
Where From?: TDRSS position message
BAT
RA: 121.951513642403 Dec: 57.6167755712018 [deg; J2000]
Catalogged Source?: NO
Point Source?: YES
GRB Indicated?: YES [ by BAT flight software ]
Image S/N Ratio: 7.32
Image Trigger?: NO
Rate S/N Ratio: 10 [ if not an image trigger ]
Image S/N Ratio: 7.32
Analysis Position: [ source = BAT ]
RA: 121.951513642403 Dec: 57.6167755712018 [deg; J2000]
Refined Position: [ source = BAT pre-slew burst ]
RA: 121.884543601363 Dec: 57.6040422374475 [deg; J2000]
{ 08h 07m 32.3s , +57d 36' 14.6" }
+/- 2.05374278052933 [arcmin] (estimated 90% radius based on SNR)
+/- 0.827842339031581 [arcmin] (formal 1-sigma fit error)
SNR: 10.87987794157
Angular difference between the analysis and refined position is 2.284012 arcmin
Partial Coding Fraction: 0.59375 [ including projection effects ]
Duration
T90: 96 +/- 35.7770876399966
Measured from: -15.2319999933243
to: 80.7680000066757 [s; relative to TRIGTIME]
T50: 48 +/- 16
Measured from: 0.76800000667572
to: 48.7680000066757 [s; relative to TRIGTIME]
Fluence
Peak Flux (peak 1 second)
Measured from: 8.26800000667572
to: 9.26800000667572 [s; relative to TRIGTIME]
Total Fluence
Measured from: -15.2319999933243
to: 96.7680000066757 [s; relative to TRIGTIME]
Band 1 Band 2 Band 3 Band 4
15-25 25-50 50-100 100-350 keV
Total 0.338528 0.460883 0.520753 0.164677
0.055549 0.058019 0.051689 0.044368 [error]
Peak -0.000480 0.017660 0.012065 0.003589
0.005980 0.006183 0.005571 0.004629 [error]
[ fluence units of on-axis counts / fully illuminated detector ]
======================================================================
====== Table of the duration information =============================
Value tstart tstop
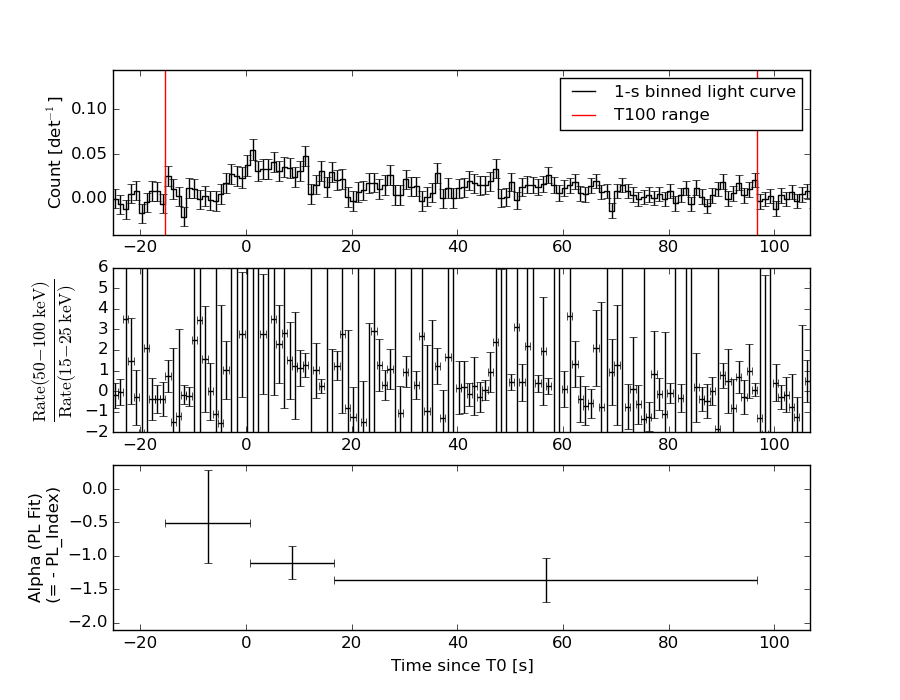
T100 112.000 -15.232 96.768
T90 96.000 -15.232 80.768
T50 48.000 0.768 48.768
Peak 1.000 8.268 9.268
====== Spectral Analysis Summary =====================================
Model : spectral model: simple power-law (PL) and cutoff power-law (CPL)
Ph_index : photon index: E^{Ph_index}
Ph_90err : 90% error of the photon index
Epeak : Epeak in keV
Epeak_90err: 90% error of Epeak
Norm : normalization at 50 keV in both the PL model and CPL model
Nomr_90err : 90% error of the normalization
chi2 : Chi-Squared
dof : degree of freedo
=== Time-averaged spectral analysis ===
(Best model with acceptable fit: PL)
Model Ph_index Ph_90err_low Ph_90err_hi Epeak Epeak_90err_low Epeak_90err_hi Norm Nomr_90err_low Norm_90err_hi chi2 dof
PL -1.130 -0.206 0.212 - - - 9.24e-04 -1.03e-04 1.02e-04 70.650 57
CPL -1.123 -0.210 0.212 9999.300 -9999.300 -9999.300 9.29e-04 -1.02e-04 5.54e-04 70.670 56
=== 1-s peak spectral analysis ===
(Best model with acceptable fit: N/A)
Model Ph_index Ph_90err_low Ph_90err_hi Epeak Epeak_90err_low Epeak_90err_hi Norm Nomr_90err_low Norm_90err_hi chi2 dof
PL -0.871 -0.853 1.239 - - - 2.34e-03 -2.34e-03 1.23e-03 39.430 57
CPL -0.650 2.904 5.296 340.158 N/A N/A 2.97e-03 N/A N/A 39.420 56
=== Fluence/Peak Flux Summary ===
Model Band1 Band2 Band3 Band4 Band5 Total
15-25 25-50 50-100 100-350 15-150 15-350 keV
Fluence PL 9.36e-08 2.16e-07 3.95e-07 1.72e-06 1.07e-06 2.42e-06 erg/cm2
90%_error_low -2.12e-08 -2.97e-08 -5.06e-08 -4.66e-07 -1.28e-07 -4.97e-07 erg/cm2
90%_error_hi 2.28e-08 2.89e-08 4.97e-08 5.84e-07 1.29e-07 5.98e-07 erg/cm2
Peak flux PL 5.30e-02 7.77e-02 8.50e-02 1.74e-01 2.69e-01 3.90e-01 ph/cm2/s
90%_error_low -5.30e-02 -5.58e-02 -4.26e-02 -1.74e-01 -1.41e-01 -1.96e-01 ph/cm2/s
90%_error_hi 7.16e-02 5.39e-02 4.20e-02 3.26e-01 1.45e-01 2.47e-01 ph/cm2/s
Fluence CPL 9.35e-08 2.14e-07 3.88e-07 1.73e-06 1.08e-06 2.29e-06 erg/cm2
90%_error_low N/A -3.93e-08 -6.40e-08 -8.63e-07 -1.81e-07 -7.18e-07 erg/cm2
90%_error_hi N/A 4.12e-08 7.74e-08 5.78e-07 1.73e-07 7.11e-07 erg/cm2
Peak flux CPL 5.04e-02 7.91e-02 8.74e-02 1.36e-01 2.68e-01 3.53e-01 ph/cm2/s
90%_error_low -5.04e-02 -5.67e-02 -4.50e-02 -1.36e-01 -1.39e-01 -2.20e-01 ph/cm2/s
90%_error_hi 7.36e-02 6.90e-02 5.66e-02 2.18e-01 1.46e-01 2.37e-01 ph/cm2/s
======================================================================
Image
Pre-slew 15.0-350.0 keV image (Event data)

#   RAcent    DECcent   POSerr    Theta     Phi              Peak Cts       SNR   Name
  121.8845    57.6040   0.0177    30.7140  -132.9350         0.9447114     10.880 TRIG_00279898

Foreground time interval of the image:
-15.232  35.669 (delta_t =  50.901 [sec])
Background time interval of the image:
-239.232 -15.232 (delta_t = 224.000 [sec])
Light Curves
Note: The mask-weighted lightcurves have units of either count/det or counts/sec/det, where a det is 0.4 x 0.4 = 0.16 sq cm.
Full-time range; 1 s binning
Other quick-look light curves:
- 64 ms binning (zoomed)
- 16 ms binning (zoomed)
- 8 ms binning (zoomed)
- 2 ms binning (zoomed)
- SN=5 or 10 s binning (full-time range)
- Raw light curve
Spectra
- 64 ms binning (zoomed)
- 16 ms binning (zoomed)
- 8 ms binning (zoomed)
- 2 ms binning (zoomed)
- SN=5 or 10 s binning (full-time range)
- Raw light curve
Spectra
Notes:
- 1) The fitting includes the systematic errors.
- 2) When the burst includes telescope slew time periods, the fitting uses an average response file made from multiple 5-s response files through out the slew time plus single time preiod for the non-slew times, and weighted by the total counts in the corresponding time period using addrmf. An average response file is needed becuase a spectral fit using the pre-slew DRM will introduce some errors in both a spectral shape and a normalization if the PHA file contains a lot of the slew/post-slew time interval.
- 3) For fits to more complicated models (e.g. a power-law over a cutoff power-law), the BAT team has decided to require a chi-square improvement of more than 6 for each extra dof.
Time averaged spectrum fit using the average DRM
Power-law model
Time interval is from  -15.232 sec. to   96.768 sec.

Spectral model in power-law:
------------------------------------------------------------
Parameters  : value       lower 90%   higher 90%
Photon index: -1.12997     ( -0.20622   0.212101 )
Norm@50keV  : 9.24477E-04    ( -0.000102547   0.00010226 )
------------------------------------------------------------
#Fit statistic : Chi-Squared =          70.65 using 59 PHA bins.
# Reduced chi-squared =          1.239 for     57 degrees of freedom
# Null hypothesis probability =   1.056422e-01

Photon flux (15-150 keV)    in 112 sec: 0.107566 ( -0.0124632  0.012506 ) ph/cm2/s
Energy fluence (15-150 keV)             : 1.07253e-06 ( -1.28448e-07  1.29152e-07 ) ergs/cm2
Cutoff power-law model

Time interval is from  -15.232 sec. to   96.768 sec.
Spectral model in the cutoff power-law:
------------------------------------------------------------
Parameters  : value       lower 90%   higher 90%
Photon index: -1.12307     ( -0.209488   0.212088 )
Epeak [keV] : 9999.30      ( -9999.36 -9999.36 )
Norm@50keV  : 9.29080E-04    ( -0.000101956   0.000553726 )
------------------------------------------------------------
#Fit statistic : Chi-Squared =          70.67 using 59 PHA bins.
# Reduced chi-squared =          1.262 for     56 degrees of freedom
# Null hypothesis probability =   8.967404e-02

Photon flux (15-150 keV)    in 112 sec: 0.107541 ( -0.0124639  0.012504 ) ph/cm2/s
Energy fluence (15-150 keV)             : 1.07765e-06 ( -1.80908e-07  1.72776e-07 ) ergs/cm2
1-s peak spectrum fit
Power-law model
Time interval is from    8.268 sec. to    9.268 sec.

Spectral model in power-law:
------------------------------------------------------------
Parameters  : value       lower 90%   higher 90%
Photon index: -0.870843     ( -0.852867   1.23875 )
Norm@50keV  : 2.34332E-03    ( -0.00234332   0.00122923 )
------------------------------------------------------------
#Fit statistic : Chi-Squared =          39.43 using 59 PHA bins.
# Reduced chi-squared =         0.6917 for     57 degrees of freedom
# Null hypothesis probability =   9.632290e-01

Photon flux (15-150 keV)    in 1 sec: 0.268940 ( -0.140622  0.14533 ) ph/cm2/s
Energy fluence (15-150 keV)             : 2.66042e-08 ( -1.3311e-08  1.34714e-08 ) ergs/cm2
Cutoff power-law model
Time interval is from    8.268 sec. to    9.268 sec.
Spectral model in the cutoff power-law:
------------------------------------------------------------
Parameters  : value       lower 90%   higher 90%
Photon index: -4.32574     ( 6.57997   8.9722 )
Epeak [keV] : 340.158      (   )
Norm@50keV  : 2.02619E-11    (     )
------------------------------------------------------------
#Fit statistic : Chi-Squared =          39.30 using 59 PHA bins.
# Reduced chi-squared =         0.7017 for     56 degrees of freedom
# Null hypothesis probability =   9.559061e-01

Photon flux (15-150 keV)    in 1 sec: 0.267587 ( -0.138906  0.145531 ) ph/cm2/s
Energy fluence (15-150 keV)             : 2.63263e-08 ( -1.54758e-08  1.36811e-08 ) ergs/cm2
Time-resolved spectra
Distribution
T90 vs. Hardness ratio plot

T90                                   = 96.0 sec.
Hardness ratio (energy fluence ratio) = 1.82772169537
S(15-50 keV) vs. S(50-150 keV) plot

S(15-50 keV)  = 3.0945819e-07
S(50-150 keV) = 7.630813e-07
The dash-dotted line and the dashed line traces the fluences calculated from the Band function with Epeak = 15 and 150 keV, respectively. Both lines assume a canonical values of alpha = -1 and beta = -2.5.
Mask shadow pattern
IMX = -4.046736628681478E-01, IMY = 4.349471981261410E-01
Spacecraft aspect plot

Bright source in the pre-burst/pre-slew/post-slew images
Pre-burst image of 15-350 keV band
Time interval of the image:
-239.232000 -15.232000

# RAcent  DECcent POSerr Theta    Phi  PeakCts   SNR AngSep     Name
#  [deg]    [deg]    ['] [deg]  [deg]                   [']
163.8851  23.0641    2.5  54.1  164.9   3.3149   4.7 ------	UNKNOWN
185.4765  52.5562    3.1  22.7  143.5   0.5592   3.7 ------	UNKNOWN
301.1099  57.9528    2.4  39.0    4.4   1.0452   4.8 ------	UNKNOWN
135.0757  57.6315    2.5  27.3 -145.7   0.7291   4.6 ------	UNKNOWN
 14.6201  56.6865    2.8  48.3  -49.9   3.3428   4.2 ------	UNKNOWN
 19.0011  57.7697    3.5  47.2  -53.1   2.4888   3.3 ------	UNKNOWN
Pre-slew background subtracted image of 15-350 keV band
Time interval of the image:
-15.232000 35.668600

# RAcent  DECcent POSerr Theta    Phi  PeakCts   SNR AngSep     Name
#  [deg]    [deg]    ['] [deg]  [deg]                   [']
151.8699  69.7939    2.2  13.2 -140.8   0.3325   5.1 ------	UNKNOWN
121.8845  57.6040    1.1  30.7 -132.9   0.9447  10.9 ------	UNKNOWN
Post-slew image of 15-350 keV band
Time interval of the image:
86.868590 489.968590

# RAcent  DECcent POSerr Theta    Phi  PeakCts   SNR AngSep     Name
#  [deg]    [deg]    ['] [deg]  [deg]                   [']
 75.5849  61.7247    3.1  23.2  -50.0   0.8626   3.8 ------	UNKNOWN