Analysis Summary
Notes:
- 1) No attempt has been made to eliminate the non-significant decimal places.
- 2) This batgrbproduct analysis is done using the HEASARC data.
- 3) This batgrbproduct analysis is using the flight position for the mask-weighting calculation.
======================================================================
BAT GRB EVENT DATA PROCESSING REPORT
Process Script Ver: batgrbproduct v2.46
Process Start Time: Mon Jan 20 04:20:00 EST 2014
Host Name: batevent1
Current Working Dir: /local/data/batevent/batevent_reproc/trigger303609
======================================================================
Trigger: 00303609 Segment: 000
BAT Trigger Time: 225058125.376 [s; MET]
Trigger Stop: 225058129.472 [s; MET]
UTC: 2008-02-18T20:08:42.791800 [includes UTCF correction]
Where From?: TDRSS position message
BAT
RA: 355.921970640896 Dec: 12.174721597336 [deg; J2000]
Catalogged Source?: NO
Point Source?: YES
GRB Indicated?: YES [ by BAT flight software ]
Image S/N Ratio: 6.62
Image Trigger?: NO
Rate S/N Ratio: 9.8488578017961 [ if not an image trigger ]
Image S/N Ratio: 6.62
Analysis Position: [ source = BAT ]
RA: 355.921970640896 Dec: 12.174721597336 [deg; J2000]
Refined Position: [ source = BAT pre-slew burst ]
RA: 355.955733858322 Dec: 12.1667125338499 [deg; J2000]
{ 23h 43m 49.4s , +12d 10' 00.2" }
+/- 2.29222156053732 [arcmin] (estimated 90% radius based on SNR)
+/- 1.35114289955377 [arcmin] (formal 1-sigma fit error)
SNR: 9.29963929771105
Angular difference between the analysis and refined position is 2.037733 arcmin
Partial Coding Fraction: 0.2109375 [ including projection effects ]
Duration
T90: 22.7999999523163 +/- 2.78418386954099
Measured from: -11.5039999783039
to: 11.2959999740124 [s; relative to TRIGTIME]
T50: 14.7199999690056 +/- 8.62494985567195
Measured from: -6.81599998474121
to: 7.90399998426437 [s; relative to TRIGTIME]
Fluence
Peak Flux (peak 1 second)
Measured from: 1.21999999880791
to: 2.21999999880791 [s; relative to TRIGTIME]
Total Fluence
Measured from: -12.3519999980927
to: 12.7520000040531 [s; relative to TRIGTIME]
Band 1 Band 2 Band 3 Band 4
15-25 25-50 50-100 100-350 keV
Total 0.373863 0.469474 0.197880 0.053229
0.062098 0.065834 0.059077 0.055153 [error]
Peak 0.055314 0.057624 0.018971 0.010712
0.013452 0.014361 0.012193 0.011189 [error]
[ fluence units of on-axis counts / fully illuminated detector ]
======================================================================
====== Table of the duration information =============================
Value tstart tstop
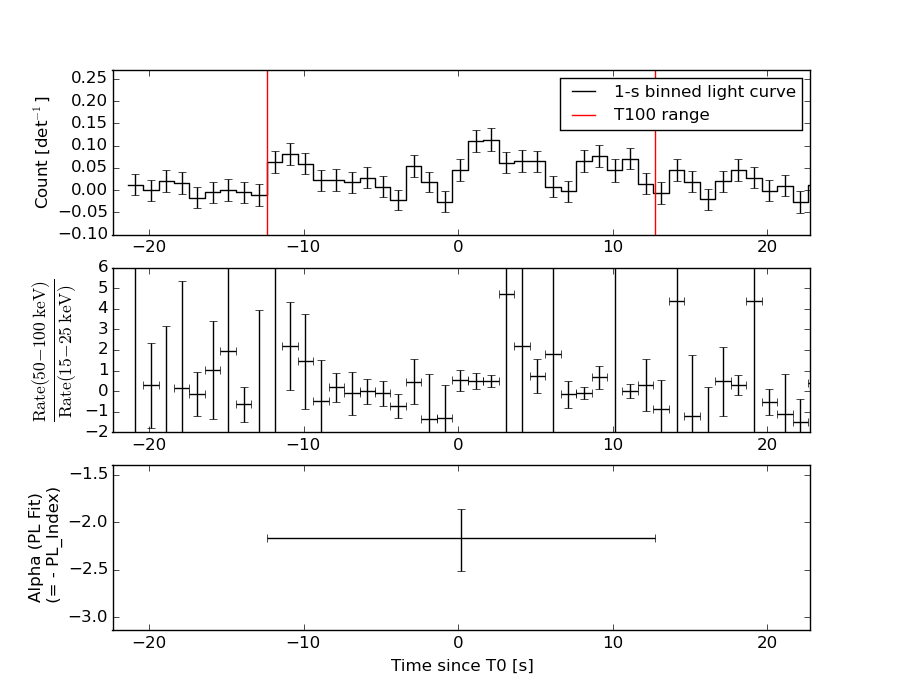
T100 25.104 -12.352 12.752
T90 22.800 -11.504 11.296
T50 14.720 -6.816 7.904
Peak 1.000 1.220 2.220
====== Spectral Analysis Summary =====================================
Model : spectral model: simple power-law (PL) and cutoff power-law (CPL)
Ph_index : photon index: E^{Ph_index}
Ph_90err : 90% error of the photon index
Epeak : Epeak in keV
Epeak_90err: 90% error of Epeak
Norm : normalization at 50 keV in both the PL model and CPL model
Nomr_90err : 90% error of the normalization
chi2 : Chi-Squared
dof : degree of freedo
=== Time-averaged spectral analysis ===
(Best model with acceptable fit: PL)
Model Ph_index Ph_90err_low Ph_90err_hi Epeak Epeak_90err_low Epeak_90err_hi Norm Nomr_90err_low Norm_90err_hi chi2 dof
PL -2.167 -0.341 0.304 - - - 2.64e-03 -6.23e-04 6.05e-04 50.970 57
CPL -0.696 -1.307 2.221 35.538 N/A N/A 1.95e-02 N/A N/A 47.720 56
=== 1-s peak spectral analysis ===
(Best model with acceptable fit: N/A)
Model Ph_index Ph_90err_low Ph_90err_hi Epeak Epeak_90err_low Epeak_90err_hi Norm Nomr_90err_low Norm_90err_hi chi2 dof
PL -2.393 -0.712 0.553 - - - 7.79e-03 -3.53e-03 3.32e-03 43.120 57
CPL -1.989 N/A N/A 1.041 N/A N/A 1.37e-02 N/A N/A 43.340 56
=== Fluence/Peak Flux Summary ===
Model Band1 Band2 Band3 Band4 Band5 Total
15-25 25-50 50-100 100-350 15-150 15-350 keV
Fluence PL 1.59e-07 1.95e-07 1.73e-07 2.67e-07 6.19e-07 7.93e-07 erg/cm2
90%_error_low -3.51e-08 -3.48e-08 -5.30e-08 -1.30e-07 -1.26e-07 -2.08e-07 erg/cm2
90%_error_hi 3.62e-08 3.45e-08 5.58e-08 1.91e-07 1.31e-07 2.52e-07 erg/cm2
Peak flux PL 7.62e-01 4.55e-01 1.73e-01 8.79e-02 1.44e+00 1.48e+00 ph/cm2/s
90%_error_low -2.69e-01 -1.39e-01 -9.44e-02 -8.79e-02 -3.92e-01 -4.06e-01 ph/cm2/s
90%_error_hi 2.80e-01 1.32e-01 1.05e-01 1.29e-01 3.92e-01 4.08e-01 ph/cm2/s
Fluence CPL N/A N/A N/A N/A N/A N/A erg/cm2
90%_error_low -3.51e-08 -3.48e-08 -5.30e-08 -1.30e-07 -1.26e-07 -2.08e-07 erg/cm2
90%_error_hi 3.62e-08 3.45e-08 5.58e-08 1.91e-07 1.31e-07 2.52e-07 erg/cm2
Peak flux CPL 7.44e-01 3.87e-01 1.30e-01 6.65e-02 1.29e+00 1.33e+00 ph/cm2/s
90%_error_low -3.02e-01 -3.87e-01 -1.30e-01 N/A -6.47e-01 N/A ph/cm2/s
90%_error_hi 2.94e-01 1.96e-01 1.46e-01 N/A 5.31e-01 N/A ph/cm2/s
======================================================================
Image
Pre-slew 15.0-350.0 keV image (Event data)
#   RAcent    DECcent   POSerr    Theta     Phi              Peak Cts       SNR   Name
  355.9557    12.1667   0.0207    47.3763   -36.1005         1.1956267      9.300 TRIG_00303609

Foreground time interval of the image:
-12.352  12.752 (delta_t =  25.104 [sec])
Background time interval of the image:
-662.175 -617.301 (delta_t =  44.875 [sec])
-239.376 -12.352 (delta_t = 227.024 [sec])
Light Curves
Note: The mask-weighted lightcurves have units of either count/det or counts/sec/det, where a det is 0.4 x 0.4 = 0.16 sq cm.
Full-time range; 1 s binning
Other quick-look light curves:
- 64 ms binning (zoomed)
- 16 ms binning (zoomed)
- 8 ms binning (zoomed)
- 2 ms binning (zoomed)
- SN=5 or 10 s binning (full-time range)
- Raw light curve
Spectra
- 64 ms binning (zoomed)
- 16 ms binning (zoomed)
- 8 ms binning (zoomed)
- 2 ms binning (zoomed)
- SN=5 or 10 s binning (full-time range)
- Raw light curve
Spectra
Notes:
- 1) The fitting includes the systematic errors.
- 2) When the burst includes telescope slew time periods, the fitting uses an average response file made from multiple 5-s response files through out the slew time plus single time preiod for the non-slew times, and weighted by the total counts in the corresponding time period using addrmf. An average response file is needed becuase a spectral fit using the pre-slew DRM will introduce some errors in both a spectral shape and a normalization if the PHA file contains a lot of the slew/post-slew time interval.
- 3) For fits to more complicated models (e.g. a power-law over a cutoff power-law), the BAT team has decided to require a chi-square improvement of more than 6 for each extra dof.
Time averaged spectrum fit using the average DRM
Power-law model
Time interval is from  -12.352 sec. to   12.752 sec.

Spectral model in power-law:
------------------------------------------------------------
Parameters  : value       lower 90%   higher 90%
Photon index: -2.16724     ( -0.341298   0.303714 )
Norm@50keV  : 2.63522E-03    ( -0.00062305   0.000604668 )
------------------------------------------------------------
#Fit statistic : Chi-Squared =          50.97 using 59 PHA bins.
# Reduced chi-squared =         0.8942 for     57 degrees of freedom
# Null hypothesis probability =   6.994214e-01

Photon flux (15-150 keV)    in 25.1 sec: 0.428934 ( -0.073893  0.073904 ) ph/cm2/s
Energy fluence (15-150 keV)             : 6.1929e-07 ( -1.26396e-07  1.3068e-07 ) ergs/cm2
Cutoff power-law model
Time interval is from  -12.352 sec. to   12.752 sec.
Spectral model in the cutoff power-law:
------------------------------------------------------------
Parameters  : value       lower 90%   higher 90%
Photon index: -0.696231     ( -1.30734   2.2207 )
Epeak [keV] : 35.5382      (   )
Norm@50keV  : 1.95239E-02    (     )
------------------------------------------------------------
#Fit statistic : Chi-Squared =          47.72 using 59 PHA bins.
# Reduced chi-squared =         0.8521 for     56 degrees of freedom
# Null hypothesis probability =   7.766134e-01

Photon flux (15-150 keV)    in 25.1 sec: 0.413484 ( -0.075  0.075127 ) ph/cm2/s
Energy fluence (15-150 keV)             : 0 ( 0  0 ) ergs/cm2
1-s peak spectrum fit
Power-law model
Time interval is from    1.220 sec. to    2.220 sec.

Spectral model in power-law:
------------------------------------------------------------
Parameters  : value       lower 90%   higher 90%
Photon index: -2.39286     ( -0.711955   0.553013 )
Norm@50keV  : 7.79252E-03    ( -0.00352909   0.00332343 )
------------------------------------------------------------
#Fit statistic : Chi-Squared =          43.12 using 59 PHA bins.
# Reduced chi-squared =         0.7565 for     57 degrees of freedom
# Null hypothesis probability =   9.129956e-01

Photon flux (15-150 keV)    in 1 sec: 1.43599 ( -0.39242  0.39242 ) ph/cm2/s
Energy fluence (15-150 keV)             : 7.59084e-08 ( -2.53806e-08  2.70448e-08 ) ergs/cm2
Cutoff power-law model
Time interval is from    1.220 sec. to    2.220 sec.
Spectral model in the cutoff power-law:
------------------------------------------------------------
Parameters  : value       lower 90%   higher 90%
Photon index: -1.98889     (       )
Epeak [keV] : 1.04055      (   )
Norm@50keV  : 1.36955E-02    (     )
------------------------------------------------------------
#Fit statistic : Chi-Squared =          43.34 using 59 PHA bins.
# Reduced chi-squared =         0.7740 for     56 degrees of freedom
# Null hypothesis probability =   8.917628e-01

Photon flux (15-150 keV)    in 1 sec: 1.29421 ( -0.647131  0.53075 ) ph/cm2/s
Energy fluence (15-150 keV)             : 0 ( 0  0 ) ergs/cm2
Time-resolved spectra
Distribution
T90 vs. Hardness ratio plot
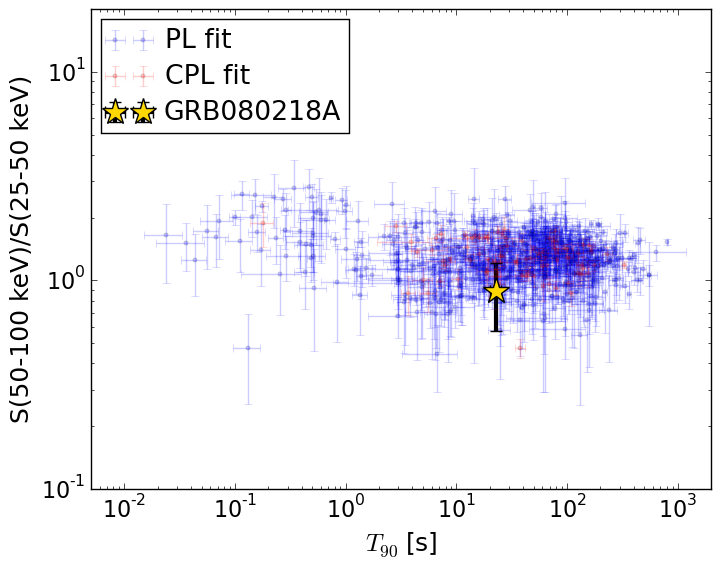
T90                                   = 22.8 sec.
Hardness ratio (energy fluence ratio) = 0.890573956344
S(15-50 keV) vs. S(50-150 keV) plot
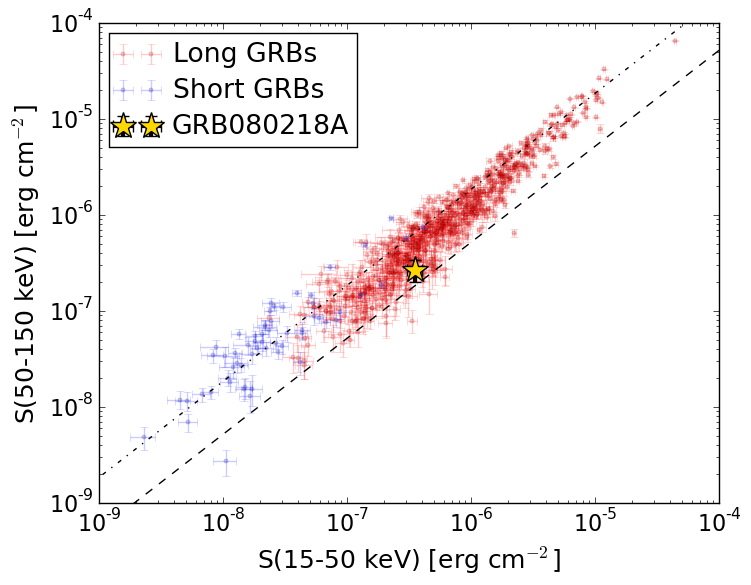
S(15-50 keV)  = 3.533938e-07
S(50-150 keV) = 2.6590809e-07
The dash-dotted line and the dashed line traces the fluences calculated from the Band function with Epeak = 15 and 150 keV, respectively. Both lines assume a canonical values of alpha = -1 and beta = -2.5.
Mask shadow pattern
IMX = 8.779473014463297E-01, IMY = 6.402230271866078E-01
Spacecraft aspect plot
Bright source in the pre-burst/pre-slew/post-slew images
Pre-burst image of 15-350 keV band
Time interval of the image:
-662.175400 -617.300800
-239.376000 -12.352000

# RAcent  DECcent POSerr Theta    Phi  PeakCts   SNR AngSep     Name
#  [deg]    [deg]    ['] [deg]  [deg]                   [']
 59.2396 -34.8281    2.6  29.4  129.0   1.3014   4.5 ------	UNKNOWN
  9.4609  19.4772    2.6  46.5  -15.7   1.6275   4.4 ------	UNKNOWN
  1.3495  25.1147    3.2  54.9  -21.0   2.6406   3.6 ------	UNKNOWN
Pre-slew background subtracted image of 15-350 keV band
Time interval of the image:
-12.352000 12.752000

# RAcent  DECcent POSerr Theta    Phi  PeakCts   SNR AngSep     Name
#  [deg]    [deg]    ['] [deg]  [deg]                   [']
355.9556  12.1667    1.2  47.4  -36.1   1.1959   9.3 ------	UNKNOWN
Post-slew image of 15-350 keV band
Time interval of the image:
862.924590 962.697800

# RAcent  DECcent POSerr Theta    Phi  PeakCts   SNR AngSep     Name
#  [deg]    [deg]    ['] [deg]  [deg]                   [']
135.5362 -40.5620    0.7  19.8 -145.2   1.5956  15.6    0.6	Vela X-1
170.3680 -60.7354   30.5  49.0 -148.0  -0.1004  -0.4    6.9	Cen X-3
186.4928 -62.6947    7.9  56.8 -149.3  -0.9623  -1.5    6.4	GX 301-2
126.4117 -68.2525    2.9  45.3 -121.3   1.6407   4.0 ------	UNKNOWN