Analysis Summary
Notes:
- 1) No attempt has been made to eliminate the non-significant decimal places.
- 2) This batgrbproduct analysis is done using the HEASARC data.
- 3) This batgrbproduct analysis is using the flight position for the mask-weighting calculation.
======================================================================
BAT GRB EVENT DATA PROCESSING REPORT
Process Script Ver: batgrbproduct v2.46
Process Start Time: Mon Jan 20 03:45:12 EST 2014
Host Name: batevent1
Current Working Dir: /local/data/batevent/batevent_reproc/trigger306757
======================================================================
Trigger: 00306757 Segment: 000
BAT Trigger Time: 227599971.904 [s; MET]
Trigger Stop: 227599972.928 [s; MET]
UTC: 2008-03-19T06:12:49.250280 [includes UTCF correction]
Where From?: TDRSS position message
BAT
RA: 217.925715751808 Dec: 36.3029283586765 [deg; J2000]
Catalogged Source?: NO
Point Source?: YES
GRB Indicated?: YES [ by BAT flight software ]
Image S/N Ratio: 22.5
Image Trigger?: NO
Rate S/N Ratio: 206.729291586848 [ if not an image trigger ]
Image S/N Ratio: 22.5
Analysis Position: [ source = BAT ]
RA: 217.925715751808 Dec: 36.3029283586765 [deg; J2000]
Refined Position: [ source = BAT pre-slew burst ]
RA: 217.919211664027 Dec: 36.2998652608731 [deg; J2000]
{ 14h 31m 40.6s , +36d 17' 59.5" }
+/- 0.343203591950714 [arcmin] (estimated 90% radius based on SNR)
+/- 0.0792496452329713 [arcmin] (formal 1-sigma fit error)
SNR: 140.157316435534
Angular difference between the analysis and refined position is 0.364266 arcmin
Partial Coding Fraction: 1 [ including projection effects ]
Duration
T90: 124.859999984503 +/- 3.09526864580048
Measured from: 5.04399999976158
to: 129.903999984264 [s; relative to TRIGTIME]
T50: 25.8040000200272 +/- 0.11063454434877
Measured from: 15.9279999732971
to: 41.7319999933243 [s; relative to TRIGTIME]
Fluence
Peak Flux (peak 1 second)
Measured from: 16.8719999790192
to: 17.8719999790192 [s; relative to TRIGTIME]
Total Fluence
Measured from: -3.84400001168251
to: 302.047999978065 [s; relative to TRIGTIME]
Band 1 Band 2 Band 3 Band 4
15-25 25-50 50-100 100-350 keV
Total 26.720848 41.005477 41.445959 14.857236
0.092004 0.105938 0.106957 0.088348 [error]
Peak 0.658792 1.082273 1.175623 0.432635
0.010801 0.013718 0.015119 0.012015 [error]
[ fluence units of on-axis counts / fully illuminated detector ]
======================================================================
====== Table of the duration information =============================
Value tstart tstop
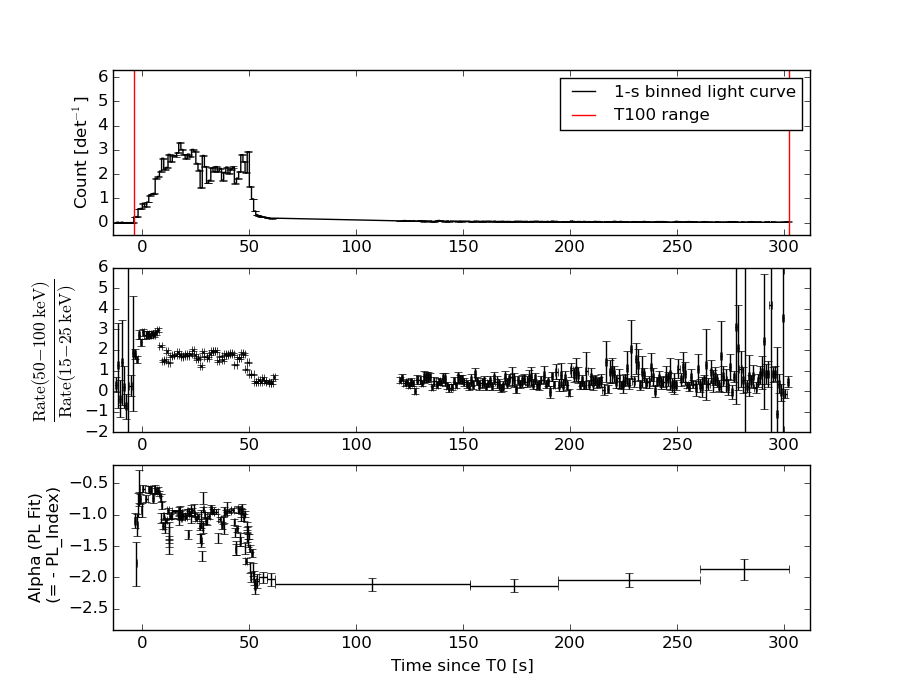
T100 305.892 -3.844 302.048
T90 124.860 5.044 129.904
T50 25.804 15.928 41.732
Peak 1.000 16.872 17.872
====== Spectral Analysis Summary =====================================
Model : spectral model: simple power-law (PL) and cutoff power-law (CPL)
Ph_index : photon index: E^{Ph_index}
Ph_90err : 90% error of the photon index
Epeak : Epeak in keV
Epeak_90err: 90% error of Epeak
Norm : normalization at 50 keV in both the PL model and CPL model
Nomr_90err : 90% error of the normalization
chi2 : Chi-Squared
dof : degree of freedo
=== Time-averaged spectral analysis ===
(Best model with acceptable fit: PL)
Model Ph_index Ph_90err_low Ph_90err_hi Epeak Epeak_90err_low Epeak_90err_hi Norm Nomr_90err_low Norm_90err_hi chi2 dof
PL -1.039 -0.019 0.019 - - - 3.23e-02 -4.04e-04 4.01e-04 39.720 57
CPL -0.964 -0.022 0.020 999.060 -111.907 -999.060 3.43e-02 -2.15e-03 -1.34e-03 56.760 56
=== 1-s peak spectral analysis ===
(Best model with acceptable fit: N/A)
Model Ph_index Ph_90err_low Ph_90err_hi Epeak Epeak_90err_low Epeak_90err_hi Norm Nomr_90err_low Norm_90err_hi chi2 dof
PL -0.989 -0.034 0.034 - - - 2.18e-01 -3.92e-03 3.91e-03 37.510 57
CPL -0.984 -0.033 0.066 9999.360 -9999.360 -9999.360 2.19e-01 -3.93e-03 7.83e-03 37.750 56
=== Fluence/Peak Flux Summary ===
Model Band1 Band2 Band3 Band4 Band5 Total
15-25 25-50 50-100 100-350 15-150 15-350 keV
Fluence PL 6.66e-06 1.62e-05 3.16e-05 1.52e-04 8.55e-05 2.06e-04 erg/cm2
90%_error_low -1.82e-07 -2.74e-07 -3.07e-07 -3.36e-06 -8.37e-07 -3.30e-06 erg/cm2
90%_error_hi 1.85e-07 2.74e-07 3.07e-07 3.41e-06 8.35e-07 3.33e-06 erg/cm2
Peak flux PL 2.13e-03 3.25e-02 2.80e-01 3.19e+01 1.24e+00 3.13e+01 ph/cm2/s
90%_error_low N/A N/A N/A N/A N/A N/A ph/cm2/s
90%_error_hi N/A N/A N/A N/A N/A N/A ph/cm2/s
Fluence CPL 6.64e-06 1.62e-05 3.17e-05 1.51e-04 8.55e-05 2.05e-04 erg/cm2
90%_error_low -1.82e-07 -2.74e-07 -3.07e-07 N/A -8.31e-07 -3.46e-06 erg/cm2
90%_error_hi 1.84e-07 2.74e-07 3.07e-07 N/A 8.27e-07 3.30e-06 erg/cm2
Peak flux CPL 5.50e+00 7.52e+00 7.58e+00 1.38e+01 2.51e+01 3.44e+01 ph/cm2/s
90%_error_low N/A N/A N/A N/A -4.64e-01 N/A ph/cm2/s
90%_error_hi N/A N/A N/A N/A 4.65e-01 N/A ph/cm2/s
======================================================================
Image
Pre-slew 15.0-350.0 keV image (Event data)
#   RAcent    DECcent   POSerr    Theta     Phi              Peak Cts       SNR   Name
  217.9192    36.2999   0.0014    11.7371     0.8665        25.3558505    140.157 TRIG_00306757

Foreground time interval of the image:
 -3.844  13.797 (delta_t =  17.641 [sec])
Background time interval of the image:
-239.904  -3.844 (delta_t = 236.060 [sec])
Light Curves
Note: The mask-weighted lightcurves have units of either count/det or counts/sec/det, where a det is 0.4 x 0.4 = 0.16 sq cm.
Full-time range; 1 s binning
Other quick-look light curves:
- 64 ms binning (zoomed)
- 16 ms binning (zoomed)
- 8 ms binning (zoomed)
- 2 ms binning (zoomed)
- SN=5 or 10 s binning (full-time range)
- Raw light curve
Spectra
- 64 ms binning (zoomed)
- 16 ms binning (zoomed)
- 8 ms binning (zoomed)
- 2 ms binning (zoomed)
- SN=5 or 10 s binning (full-time range)
- Raw light curve
Spectra
Notes:
- 1) The fitting includes the systematic errors.
- 2) When the burst includes telescope slew time periods, the fitting uses an average response file made from multiple 5-s response files through out the slew time plus single time preiod for the non-slew times, and weighted by the total counts in the corresponding time period using addrmf. An average response file is needed becuase a spectral fit using the pre-slew DRM will introduce some errors in both a spectral shape and a normalization if the PHA file contains a lot of the slew/post-slew time interval.
- 3) For fits to more complicated models (e.g. a power-law over a cutoff power-law), the BAT team has decided to require a chi-square improvement of more than 6 for each extra dof.
Time averaged spectrum fit using the average DRM
Power-law model
Multiple GTIs in the spectrum
tstart tstop
-3.844000 62.196000
120.096000 302.048000

Spectral model in power-law:
------------------------------------------------------------
Parameters  : value       lower 90%   higher 90%
Photon index: -1.03879     ( -0.0192978   0.0193978 )
Norm@50keV  : 3.23134E-02    ( -0.000403656   0.000401333 )
------------------------------------------------------------
#Fit statistic : Chi-Squared =          39.72 using 59 PHA bins.
# Reduced chi-squared =         0.6969 for     57 degrees of freedom
# Null hypothesis probability =   9.602986e-01

Photon flux (15-150 keV)    in 248 sec: 3.72906 ( -0.0496  0.04992 ) ph/cm2/s
Energy fluence (15-150 keV)             : 8.55049e-05 ( -8.36479e-07  8.34984e-07 ) ergs/cm2
Cutoff power-law model

Multiple GTIs in the spectrum
tstart tstop
-3.844000 62.196000
120.096000 302.048000
Spectral model in the cutoff power-law:
------------------------------------------------------------
Parameters  : value       lower 90%   higher 90%
Photon index: -1.03184     ( -0.0224617   0.0204746 )
Epeak [keV] : 9996.11      ( -9109.97 -9997.13 )
Norm@50keV  : 3.24907E-02    ( -0.000349449   0.000455681 )
------------------------------------------------------------
#Fit statistic : Chi-Squared =          41.10 using 59 PHA bins.
# Reduced chi-squared =         0.7340 for     56 degrees of freedom
# Null hypothesis probability =   9.321325e-01

Photon flux (15-150 keV)    in 248 sec: 1.38759 ( -0.08804  0.12735 ) ph/cm2/s
Energy fluence (15-150 keV)             : 8.54992e-05 ( -8.30775e-07  8.26772e-07 ) ergs/cm2
1-s peak spectrum fit
Power-law model

Time interval is from   16.872 sec. to   17.872 sec.

Spectral model in power-law:
------------------------------------------------------------
Parameters  : value       lower 90%   higher 90%
Photon index: -0.98922     ( -0.0339992   0.0341892 )
Norm@50keV  : 0.217868    ( -0.00392163   0.003911 )
------------------------------------------------------------
#Fit statistic : Chi-Squared =          37.51 using 59 PHA bins.
# Reduced chi-squared =         0.6580 for     57 degrees of freedom
# Null hypothesis probability =   9.785322e-01

Photon flux (15-150 keV)    in 1 sec: 1.24323 (    ) ph/cm2/s
Energy fluence (15-150 keV)             : 2.36521e-06 ( -4.33822e-08  4.3475e-08 ) ergs/cm2
Cutoff power-law model
Time interval is from   16.872 sec. to   17.872 sec.
Spectral model in the cutoff power-law:
------------------------------------------------------------
Parameters  : value       lower 90%   higher 90%
Photon index: -0.984461     ( -0.0328477   0.0661144 )
Epeak [keV] : 9999.36      ( -9999.36 -9999.36 )
Norm@50keV  : 0.219212    ( -0.00391987   0.0078439 )
------------------------------------------------------------
#Fit statistic : Chi-Squared =          37.75 using 59 PHA bins.
# Reduced chi-squared =         0.6740 for     56 degrees of freedom
# Null hypothesis probability =   9.708759e-01

Photon flux (15-150 keV)    in 1 sec: 25.0587 ( -0.4642  0.4648 ) ph/cm2/s
Energy fluence (15-150 keV)             : 4.17273e-07 ( -4.93389e-08  5.06345e-08 ) ergs/cm2
Time-resolved spectra
Distribution
T90 vs. Hardness ratio plot
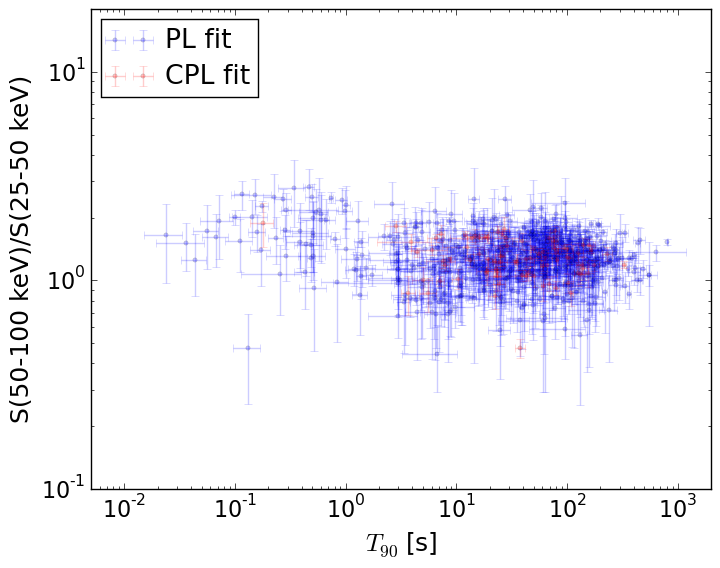
T90                                   = N/A sec.
Hardness ratio (energy fluence ratio) = N/A
S(15-50 keV) vs. S(50-150 keV) plot
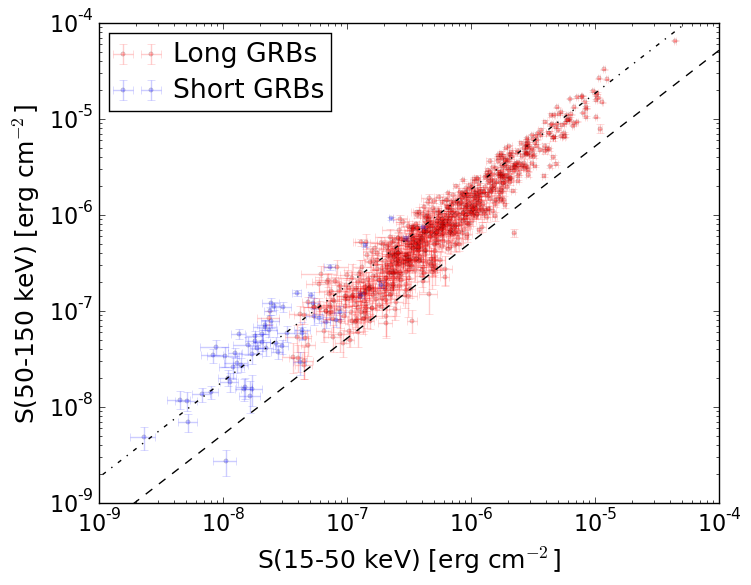
S(15-50 keV)  = N/A
S(50-150 keV) = N/A
The dash-dotted line and the dashed line traces the fluences calculated from the Band function with Epeak = 15 and 150 keV, respectively. Both lines assume a canonical values of alpha = -1 and beta = -2.5.
Mask shadow pattern
IMX = 2.077416231864064E-01, IMY = -3.142059531047589E-03
Spacecraft aspect plot
Bright source in the pre-burst/pre-slew/post-slew images
Pre-burst image of 15-350 keV band
Time interval of the image:
-239.904000 -3.844000

# RAcent  DECcent POSerr Theta    Phi  PeakCts   SNR AngSep     Name
#  [deg]    [deg]    ['] [deg]  [deg]                   [']
254.4537  35.3407   29.1  37.5  -40.0  -0.1019  -0.4    0.2	Her X-1
236.2848   8.3961    2.6  44.1    8.3   1.3487   4.5 ------	UNKNOWN
256.3129   5.1754    2.5  58.5  -10.0   4.2496   4.5 ------	UNKNOWN
256.0041  44.3895    2.6  35.0  -55.0   1.2310   4.4 ------	UNKNOWN
113.6178  72.3511    3.1  49.3 -150.1   1.5634   3.7 ------	UNKNOWN
Pre-slew background subtracted image of 15-350 keV band
Time interval of the image:
-3.844000 13.796600

# RAcent  DECcent POSerr Theta    Phi  PeakCts   SNR AngSep     Name
#  [deg]    [deg]    ['] [deg]  [deg]                   [']
254.3551  35.1419    0.0  37.5  -39.7   0.8176   2.7   13.0	Her X-1
185.4138  28.7862    2.6  22.6  108.0   1.0222   4.4 ------	UNKNOWN
133.7403  46.1668    2.6  49.4  173.0   2.2404   4.4 ------	UNKNOWN
217.9192  36.2999    0.1  11.7    0.9  25.3554 140.2 ------	UNKNOWN
211.2773  63.7210    3.7  19.9 -120.2   0.6723   3.2 ------	UNKNOWN
263.6960  30.6157    2.3  46.5  -40.0   2.3559   5.0 ------	UNKNOWN
265.0908  31.4628    3.0  47.1  -41.8   2.0031   3.9 ------	UNKNOWN
Post-slew image of 15-350 keV band
Time interval of the image:
49.396590 62.196000
120.096000 302.186000
660.096000 782.176000

# RAcent  DECcent POSerr Theta    Phi  PeakCts   SNR AngSep     Name
#  [deg]    [deg]    ['] [deg]  [deg]                   [']
254.4578  35.3424  907.8  29.5  -63.0   0.0039   0.0    0.0	Her X-1
217.9468  36.2851    0.2   0.0  -37.9  14.6950  68.9 ------	UNKNOWN