Analysis Summary
Notes:
- 1) No attempt has been made to eliminate the non-significant decimal places.
- 2) This batgrbproduct analysis is done using the HEASARC data.
- 3) This batgrbproduct analysis is using the flight position for the mask-weighting calculation.
======================================================================
BAT GRB EVENT DATA PROCESSING REPORT
Process Script Ver: batgrbproduct v2.46
Process Start Time: Mon Jan 13 23:58:08 EST 2014
Host Name: batevent1
Current Working Dir: /local/data/batevent/batevent_reproc/trigger446677
======================================================================
Trigger: 00446677 Segment: 000
BAT Trigger Time: 320189154.752 [s; MET]
Trigger Stop: 320189156.8 [s; MET]
UTC: 2011-02-23T21:25:48.058660 [includes UTCF correction]
Where From?: TDRSS position message
BAT
RA: 150.275688090159 Dec: -68.3291791093942 [deg; J2000]
Catalogged Source?: NO
Point Source?: YES
GRB Indicated?: YES [ by BAT flight software ]
Image S/N Ratio: 7.1
Image Trigger?: NO
Rate S/N Ratio: 15.5884572681199 [ if not an image trigger ]
Image S/N Ratio: 7.1
Analysis Position: [ source = BAT ]
RA: 150.275688090159 Dec: -68.3291791093942 [deg; J2000]
Refined Position: [ source = BAT pre-slew burst ]
RA: 150.318007935747 Dec: -68.3146242604098 [deg; J2000]
{ 10h 01m 16.3s , -68d 18' 52.6" }
+/- 1.73154649497643 [arcmin] (estimated 90% radius based on SNR)
+/- 0.803004393754581 [arcmin] (formal 1-sigma fit error)
SNR: 13.8834741139095
Angular difference between the analysis and refined position is 1.281561 arcmin
Partial Coding Fraction: 1.015625 [ including projection effects ]
Duration
T90: 61.4479999542236 +/- 11.0534042221947
Measured from: -44.8359999656677
to: 16.6119999885559 [s; relative to TRIGTIME]
T50: 29.9439999461174 +/- 8.65394522916218
Measured from: -28.3679999709129
to: 1.57599997520447 [s; relative to TRIGTIME]
Fluence
Peak Flux (peak 1 second)
Measured from: 0.992000043392181
to: 1.99200004339218 [s; relative to TRIGTIME]
Total Fluence
Measured from: -45.7919999957085
to: 19.3120000362396 [s; relative to TRIGTIME]
Band 1 Band 2 Band 3 Band 4
15-25 25-50 50-100 100-350 keV
Total 0.373618 0.395527 0.253725 0.087981
0.039551 0.040286 0.035636 0.031561 [error]
Peak 0.019733 0.015329 0.034519 0.005089
0.005144 0.005387 0.004851 0.004079 [error]
[ fluence units of on-axis counts / fully illuminated detector ]
======================================================================
====== Table of the duration information =============================
Value tstart tstop
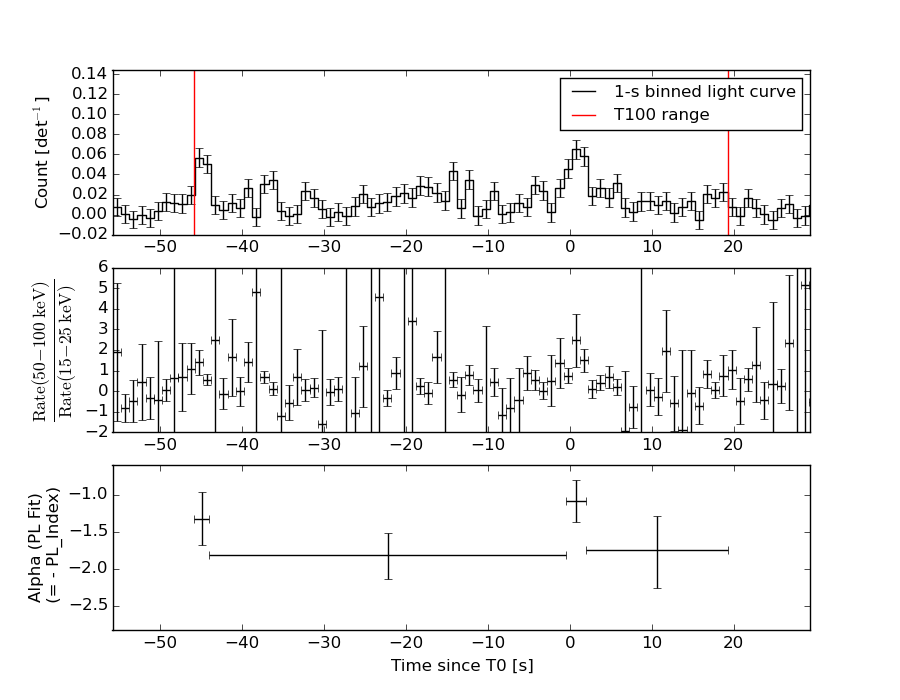
T100 65.104 -45.792 19.312
T90 61.448 -44.836 16.612
T50 29.944 -28.368 1.576
Peak 1.000 0.992 1.992
====== Spectral Analysis Summary =====================================
Model : spectral model: simple power-law (PL) and cutoff power-law (CPL)
Ph_index : photon index: E^{Ph_index}
Ph_90err : 90% error of the photon index
Epeak : Epeak in keV
Epeak_90err: 90% error of Epeak
Norm : normalization at 50 keV in both the PL model and CPL model
Nomr_90err : 90% error of the normalization
chi2 : Chi-Squared
dof : degree of freedo
=== Time-averaged spectral analysis ===
(Best model with acceptable fit: PL)
Model Ph_index Ph_90err_low Ph_90err_hi Epeak Epeak_90err_low Epeak_90err_hi Norm Nomr_90err_low Norm_90err_hi chi2 dof
PL -1.652 -0.212 0.206 - - - 1.01e-03 -1.25e-04 1.22e-04 50.600 57
CPL -1.651 -0.213 0.208 9999.360 -9999.350 -9999.360 1.01e-03 -7.84e-04 -2.90e-04 50.610 56
=== 1-s peak spectral analysis ===
(Best model with acceptable fit: PL)
Model Ph_index Ph_90err_low Ph_90err_hi Epeak Epeak_90err_low Epeak_90err_hi Norm Nomr_90err_low Norm_90err_hi chi2 dof
PL -1.080 -0.383 0.395 - - - 5.04e-03 -9.98e-04 9.95e-04 67.630 57
CPL -1.072 -0.388 0.396 9999.360 -9999.360 -9999.360 5.07e-03 -9.96e-04 1.02e-02 67.640 56
=== Fluence/Peak Flux Summary ===
Model Band1 Band2 Band3 Band4 Band5 Total
15-25 25-50 50-100 100-350 15-150 15-350 keV
Fluence PL 9.68e-08 1.62e-07 2.06e-07 5.26e-07 6.11e-07 9.91e-07 erg/cm2
90%_error_low -1.66e-08 -1.76e-08 -3.51e-08 -1.66e-07 -8.04e-08 -2.01e-07 erg/cm2
90%_error_hi 1.72e-08 1.75e-08 3.52e-08 2.13e-07 8.21e-08 2.40e-07 erg/cm2
Peak flux PL 1.39e-01 1.80e-01 1.70e-01 2.84e-01 5.84e-01 7.72e-01 ph/cm2/s
90%_error_low -5.48e-02 -4.59e-02 -3.91e-02 -1.24e-01 -1.19e-01 -1.64e-01 ph/cm2/s
90%_error_hi 6.37e-02 4.38e-02 3.77e-02 1.75e-01 1.19e-01 1.75e-01 ph/cm2/s
Fluence CPL 9.87e-08 1.59e-07 1.39e-07 5.85e-07 6.17e-07 9.78e-07 erg/cm2
90%_error_low -8.72e-09 -2.24e-08 -3.09e-08 -3.42e-07 -8.69e-08 -2.80e-07 erg/cm2
90%_error_hi 2.28e-08 3.04e-08 1.52e-08 3.48e-08 7.55e-08 1.79e-07 erg/cm2
Peak flux CPL 1.39e-01 1.80e-01 1.70e-01 2.82e-01 5.83e-01 8.07e-01 ph/cm2/s
90%_error_low N/A N/A N/A N/A N/A N/A ph/cm2/s
90%_error_hi N/A N/A N/A N/A N/A N/A ph/cm2/s
======================================================================
Image
Pre-slew 15.0-350.0 keV image (Event data)
#   RAcent    DECcent   POSerr    Theta     Phi              Peak Cts       SNR   Name
  150.3180   -68.3146   0.0139     8.6355   173.3767         1.0596356     13.883 TRIG_00446677

Foreground time interval of the image:
-45.792  19.312 (delta_t =  65.104 [sec])
Background time interval of the image:
-239.752 -45.792 (delta_t = 193.960 [sec])
Light Curves
Note: The mask-weighted lightcurves have units of either count/det or counts/sec/det, where a det is 0.4 x 0.4 = 0.16 sq cm.
Full-time range; 1 s binning
Other quick-look light curves:
- 64 ms binning (zoomed)
- 16 ms binning (zoomed)
- 8 ms binning (zoomed)
- 2 ms binning (zoomed)
- SN=5 or 10 s binning (full-time range)
- Raw light curve
Spectra
- 64 ms binning (zoomed)
- 16 ms binning (zoomed)
- 8 ms binning (zoomed)
- 2 ms binning (zoomed)
- SN=5 or 10 s binning (full-time range)
- Raw light curve
Spectra
Notes:
- 1) The fitting includes the systematic errors.
- 2) When the burst includes telescope slew time periods, the fitting uses an average response file made from multiple 5-s response files through out the slew time plus single time preiod for the non-slew times, and weighted by the total counts in the corresponding time period using addrmf. An average response file is needed becuase a spectral fit using the pre-slew DRM will introduce some errors in both a spectral shape and a normalization if the PHA file contains a lot of the slew/post-slew time interval.
- 3) For fits to more complicated models (e.g. a power-law over a cutoff power-law), the BAT team has decided to require a chi-square improvement of more than 6 for each extra dof.
Time averaged spectrum fit using the average DRM
Power-law model

Time interval is from  -45.792 sec. to   19.312 sec.

Spectral model in power-law:
------------------------------------------------------------
Parameters  : value       lower 90%   higher 90%
Photon index: -1.65211     ( -0.211822   0.20646 )
Norm@50keV  : 1.00924E-03    ( -0.000124899   0.000121976 )
------------------------------------------------------------
#Fit statistic : Chi-Squared =          50.60 using 59 PHA bins.
# Reduced chi-squared =         0.8877 for     57 degrees of freedom
# Null hypothesis probability =   7.124045e-01

Photon flux (15-150 keV)    in 65.1 sec: 0.131878 ( -0.014262  0.014271 ) ph/cm2/s
Energy fluence (15-150 keV)             : 6.11e-07 ( -8.04441e-08  8.2108e-08 ) ergs/cm2
Cutoff power-law model
Time interval is from  -45.792 sec. to   19.312 sec.
Spectral model in the cutoff power-law:
------------------------------------------------------------
Parameters  : value       lower 90%   higher 90%
Photon index: -2.34026     ( -0.212691   0.207772 )
Epeak [keV] : 121.196      ( -9999.35 -9999.36 )
Norm@50keV  : 4.49728E-04    ( -0.000222765   0.000271684 )
------------------------------------------------------------
#Fit statistic : Chi-Squared =          49.31 using 59 PHA bins.
# Reduced chi-squared =         0.8805 for     56 degrees of freedom
# Null hypothesis probability =   7.244030e-01

Photon flux (15-150 keV)    in 65.1 sec: 0.132108 ( -0.01477  0.014222 ) ph/cm2/s
Energy fluence (15-150 keV)             : 6.17335e-07 ( -8.69013e-08  7.54704e-08 ) ergs/cm2
1-s peak spectrum fit
Power-law model
Time interval is from    0.992 sec. to    1.992 sec.

Spectral model in power-law:
------------------------------------------------------------
Parameters  : value       lower 90%   higher 90%
Photon index: -1.08048     ( -0.382626   0.39534 )
Norm@50keV  : 5.03971E-03    ( -0.000997909   0.000994747 )
------------------------------------------------------------
#Fit statistic : Chi-Squared =          67.63 using 59 PHA bins.
# Reduced chi-squared =          1.186 for     57 degrees of freedom
# Null hypothesis probability =   1.583756e-01

Photon flux (15-150 keV)    in 1 sec: 0.583516 ( -0.118698  0.119103 ) ph/cm2/s
Energy fluence (15-150 keV)             : 5.30298e-08 ( -1.17013e-08  1.18157e-08 ) ergs/cm2
Cutoff power-law model

Time interval is from    0.992 sec. to    1.992 sec.
Spectral model in the cutoff power-law:
------------------------------------------------------------
Parameters  : value       lower 90%   higher 90%
Photon index: -1.07203     ( -0.387636   0.396212 )
Epeak [keV] : 9999.36      ( -9999.36 -9999.36 )
Norm@50keV  : 5.06610E-03    ( -0.000995881   0.0101882 )
------------------------------------------------------------
#Fit statistic : Chi-Squared =          67.64 using 59 PHA bins.
# Reduced chi-squared =          1.208 for     56 degrees of freedom
# Null hypothesis probability =   1.370855e-01

Photon flux (15-150 keV)    in 1 sec: 0.583426 (    ) ph/cm2/s
Energy fluence (15-150 keV)             : 5.3108e-08 ( 0  0 ) ergs/cm2
Time-resolved spectra
Distribution
T90 vs. Hardness ratio plot
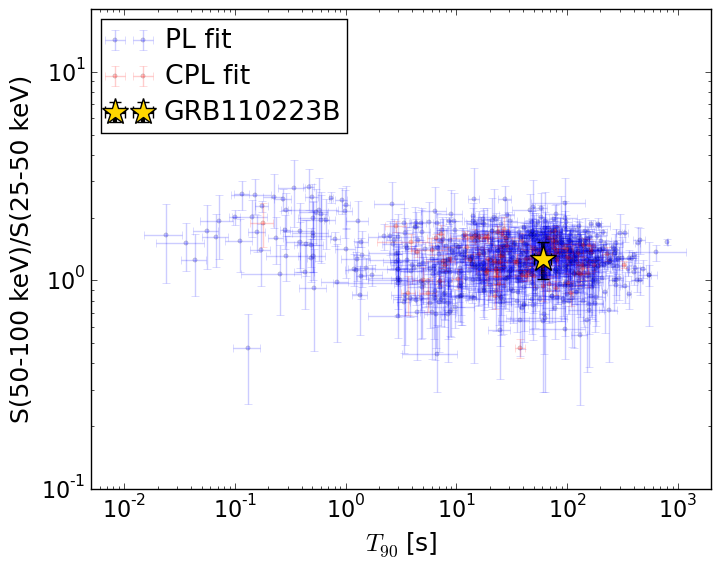
T90                                   = 61.448 sec.
Hardness ratio (energy fluence ratio) = 1.27274140679
S(15-50 keV) vs. S(50-150 keV) plot
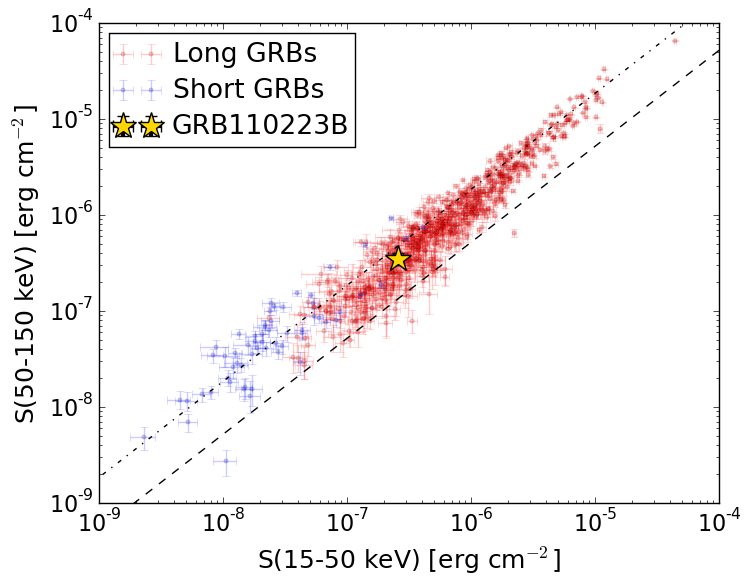
S(15-50 keV)  = 2.5886548e-07
S(50-150 keV) = 3.521362e-07
The dash-dotted line and the dashed line traces the fluences calculated from the Band function with Epeak = 15 and 150 keV, respectively. Both lines assume a canonical values of alpha = -1 and beta = -2.5.
Mask shadow pattern
IMX = -1.508559943812539E-01, IMY = -1.751670764535747E-02
Spacecraft aspect plot
Bright source in the pre-burst/pre-slew/post-slew images
Pre-burst image of 15-350 keV band
Time interval of the image:
-239.752000 -45.792000

# RAcent  DECcent POSerr Theta    Phi  PeakCts   SNR AngSep     Name
#  [deg]    [deg]    ['] [deg]  [deg]                   [']
135.5537 -40.5808    3.1  27.1   80.1   0.8270   3.8    1.9	Vela X-1
170.0815 -60.5046   43.6  19.5  156.6   0.0412   0.3    9.9	Cen X-3
186.7236 -62.9111    9.1  24.3  174.6   0.2020   1.3    8.6	GX 301-2
146.6697 -58.4223    2.8  12.4  119.9   0.6096   4.1 ------	UNKNOWN
223.2412 -65.1816    2.5  34.8 -160.6   0.8107   4.6 ------	UNKNOWN
 64.3081 -32.3966    2.8  50.1  -12.6   1.4350   4.0 ------	UNKNOWN
 33.9283 -46.8648    2.8  48.9  -48.6   3.5007   4.1 ------	UNKNOWN
Pre-slew background subtracted image of 15-350 keV band
Time interval of the image:
-45.792000 19.312000

# RAcent  DECcent POSerr Theta    Phi  PeakCts   SNR AngSep     Name
#  [deg]    [deg]    ['] [deg]  [deg]                   [']
135.4601 -40.4603    3.6  27.3   79.9   0.4136   3.3    6.5	Vela X-1
170.6944 -60.7227    0.0  19.6  157.7   0.2997   3.3   12.6	Cen X-3
186.9413 -62.6977    5.4  24.5  174.3   0.1991   2.1    9.0	GX 301-2
175.5820 -48.9668    2.3  30.1  143.4   0.5943   5.1 ------	UNKNOWN
150.3180 -68.3146    0.8   8.6  173.4   1.0595  13.9 ------	UNKNOWN
Post-slew image of 15-350 keV band
Time interval of the image:
56.148600 302.311100
480.248000 542.280800
660.248000 722.292800
840.248000 902.295700

# RAcent  DECcent POSerr Theta    Phi  PeakCts   SNR AngSep     Name
#  [deg]    [deg]    ['] [deg]  [deg]                   [']
135.5169 -40.6132    2.8  28.8   60.1   1.7178   4.2    3.6	Vela X-1
170.0042 -60.6204    5.5  11.4  140.8   0.5773   2.1    9.2	Cen X-3
186.3571 -62.8317   35.9  15.6  170.6   0.0919   0.3    9.0	GX 301-2
 98.7769 -80.1723    2.4  17.3  -69.6   1.4951   4.8 ------	UNKNOWN
355.1511 -69.6578    2.5  41.0  -83.5   6.4650   4.5 ------	UNKNOWN