Analysis Summary
Notes:
- 1) No attempt has been made to eliminate the non-significant decimal places.
- 2) This batgrbproduct analysis is done using the HEASARC data.
- 3) This batgrbproduct analysis is using the flight position for the mask-weighting calculation.
======================================================================
BAT GRB EVENT DATA PROCESSING REPORT
Process Script Ver: batgrbproduct v2.46
Process Start Time: Thu Dec 17 16:58:28 EST 2015
Host Name: bat1
Current Working Dir: /local/data/bat1/alien/Swift_3rdBATcatalog/event/batevent_reproc/trigger515277
======================================================================
Trigger: 00515277 Segment: 000
BAT Trigger Time: 351218970.048 [s; MET]
Trigger Stop: 351218978.24 [s; MET]
UTC: 2012-02-18T00:49:22.145800 [includes UTCF correction]
Where From?: TDRSS position message
BAT
RA: 319.757959799859 Dec: -25.4504975119872 [deg; J2000]
Catalogged Source?: NO
Point Source?: YES
GRB Indicated?: YES [ by BAT flight software ]
Image S/N Ratio: 9.67
Image Trigger?: NO
Rate S/N Ratio: 27.0370116691915 [ if not an image trigger ]
Image S/N Ratio: 9.67
Analysis Position: [ source = BAT ]
RA: 319.757959799859 Dec: -25.4504975119872 [deg; J2000]
Refined Position: [ source = BAT pre-slew burst ]
RA: 319.766883892088 Dec: -25.4625644609474 [deg; J2000]
{ 21h 19m 04.1s , -25d 27' 45.2" }
+/- 1.51578464101334 [arcmin] (estimated 90% radius based on SNR)
+/- 0.614677434546317 [arcmin] (formal 1-sigma fit error)
SNR: 16.7905454804452
Angular difference between the analysis and refined position is 0.870594 arcmin
Partial Coding Fraction: 0.04638672 [ including projection effects ]
Duration
T90: 31.3759999871254 +/- 2.29722614249124
Measured from: -24.3279999494553
to: 7.04800003767014 [s; relative to TRIGTIME]
T50: 18.6240000724792 +/- 3.45523143398606
Measured from: -15.5920000076294
to: 3.03200006484985 [s; relative to TRIGTIME]
======================================================================
====== Table of the duration information =============================
Value tstart tstop
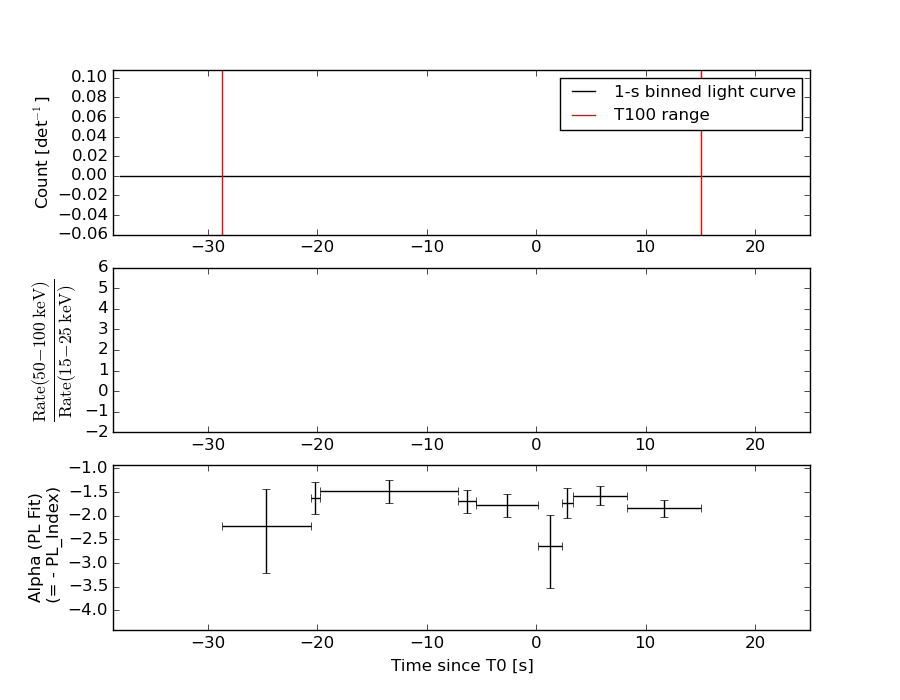
T100 35.008 -26.696 8.312
T90 31.376 -24.328 7.048
T50 18.624 -15.592 3.032
Peak 1.000 2.332 3.332
====== Spectral Analysis Summary =====================================
Model : spectral model: simple power-law (PL) and cutoff power-law (CPL)
Ph_index : photon index: E^{Ph_index}
Ph_90err : 90% error of the photon index
Epeak : Epeak in keV
Epeak_90err: 90% error of Epeak
Norm : normalization at 50 keV in both the PL model and CPL model
Nomr_90err : 90% error of the normalization
chi2 : Chi-Squared
dof : degree of freedo
=== Time-averaged spectral analysis ===
(Best model with acceptable fit: N/A)
Model Ph_index Ph_90err_low Ph_90err_hi Epeak Epeak_90err_low Epeak_90err_hi Norm Nomr_90err_low Norm_90err_hi chi2 dof
PL N/A N/A N/A - - - N/A N/A N/A N/A N/A
CPL N/A N/A N/A N/A N/A N/A N/A N/A N/A N/A N/A
=== 1-s peak spectral analysis ===
(Best model with acceptable fit: N/A)
Model Ph_index Ph_90err_low Ph_90err_hi Epeak Epeak_90err_low Epeak_90err_hi Norm Nomr_90err_low Norm_90err_hi chi2 dof
PL N/A N/A N/A - - - N/A N/A N/A N/A N/A
CPL N/A N/A N/A N/A N/A N/A N/A N/A N/A N/A N/A
=== Fluence/Peak Flux Summary ===
Model Band1 Band2 Band3 Band4 Band5 Total
15-25 25-50 50-100 100-350 15-150 15-350 keV
Fluence PL N/A N/A N/A N/A N/A N/A erg/cm2
Image
Pre-slew 15.0-350.0 keV image (Event data with DETECTION mask)
#   RAcent    DECcent   POSerr    Theta     Phi              Peak Cts       SNR   Name
  319.7669   -25.4626   0.0114    48.6202   -54.0292         9.6681733     16.791 TRIG_00515277

Foreground time interval of the image:
-26.696   8.312 (delta_t =  35.008 [sec])
Background time interval of the image:
-239.048 -26.696 (delta_t = 212.352 [sec])
Light Curves
Note: The mask-weighted lightcurves have units of either count/det or counts/sec/det, where a det is 0.4 x 0.4 = 0.16 sq cm.
Full-time range; 1 s binning
Other quick-look light curves:
- 64 ms binning (zoomed)
- 16 ms binning (zoomed)
- 8 ms binning (zoomed)
- 2 ms binning (zoomed)
- SN=5 or 10 s binning (full-time range)
- Raw light curve
Spectra
- 64 ms binning (zoomed)
- 16 ms binning (zoomed)
- 8 ms binning (zoomed)
- 2 ms binning (zoomed)
- SN=5 or 10 s binning (full-time range)
- Raw light curve
Spectra
Notes:
- 1) The fitting includes the systematic errors.
- 2) When the burst includes telescope slew time periods, the fitting uses an average response file made from multiple 5-s response files through out the slew time plus single time preiod for the non-slew times, and weighted by the total counts in the corresponding time period using addrmf. An average response file is needed becuase a spectral fit using the pre-slew DRM will introduce some errors in both a spectral shape and a normalization if the PHA file contains a lot of the slew/post-slew time interval.
- 3) For fits to more complicated models (e.g. a power-law over a cutoff power-law), the BAT team has decided to require a chi-square improvement of more than 6 for each extra dof.
Time averaged spectrum fit using the average DRM
Power-law model

Multiple GTIs in the spectrum
tstart tstop
Photon index:       (       )
Cutoff power-law model

Multiple GTIs in the spectrum
tstart tstop
Photon index:       (       )
1-s peak spectrum fit
Power-law model

Time interval is from    0.000 sec. to    8.192 sec.
Photon index:       (       )
Cutoff power-law model

Time interval is from    0.000 sec. to    8.192 sec.
Photon index:       (       )
Time-resolved spectra
Distribution
T90 vs. Hardness ratio plot
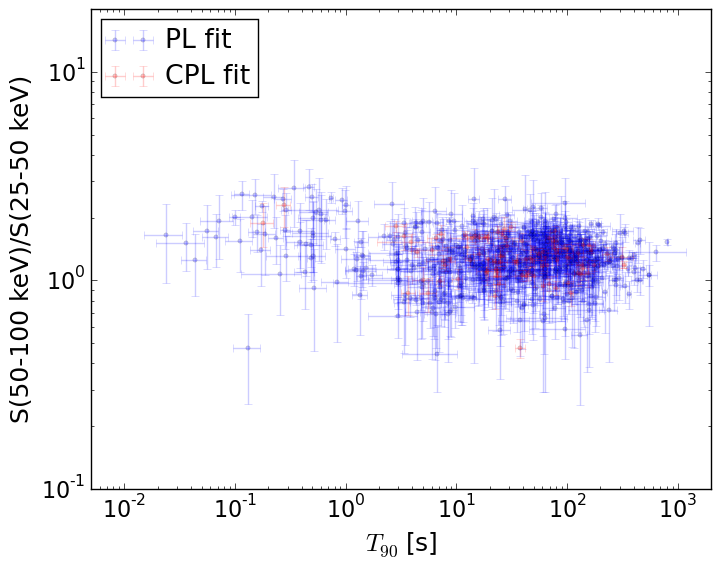
T90                                   = N/A sec.
Hardness ratio (energy fluence ratio) = N/A
S(15-50 keV) vs. S(50-150 keV) plot
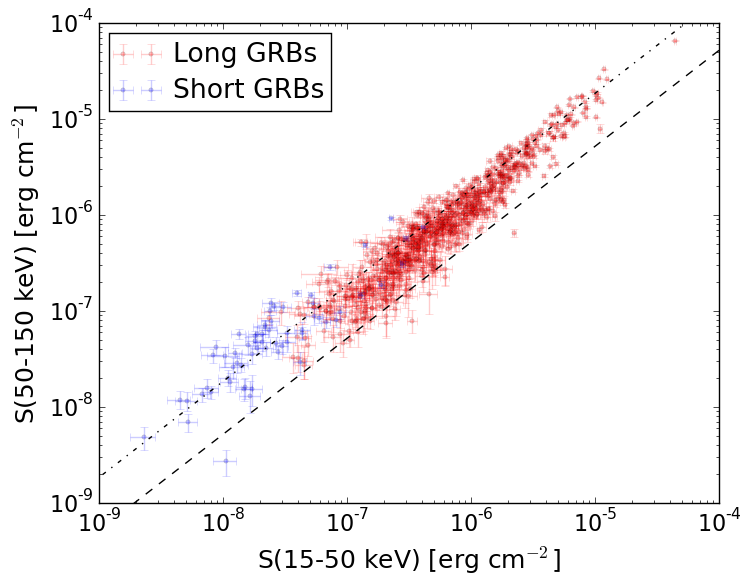
S(15-50 keV)  = N/A
S(50-150 keV) = N/A
The dash-dotted line and the dashed line traces the fluences calculated from the Band function with Epeak = 15 and 150 keV, respectively. Both lines assume a canonical values of alpha = -1 and beta = -2.5.
Mask shadow pattern (with DETECTION mask)
IMX = 6.667169370131198E-01, IMY = 9.186420166486740E-01
Spacecraft aspect plot
Bright source in the event data image
Event data image of 15-350 keV band
Time interval of the image:
-26.696000 8.312000

# RAcent  DECcent POSerr Theta    Phi  PeakCts   SNR AngSep     Name
#  [deg]    [deg]    ['] [deg]  [deg]                   [']
254.3870  35.2171    3.3  38.8  111.8   0.5350   3.4    8.3	Her X-1
262.9374 -24.8769    7.1  47.2   16.9   0.1999   1.6    8.8	GX 1+4
268.3506  -1.2949   10.7  26.7   39.0  -0.0734  -1.1    9.5	SW J1753.5-0127
270.3708 -25.1984   12.5  43.8    8.8   0.0923   0.9    8.6	GX 5-1
270.2392 -25.5576    0.0  44.1    8.7   0.3468   3.4   11.6	GRS 1758-258
273.8506 -14.0996    7.2  32.5   13.1  -0.1218  -1.6    9.8	GX 17+2
275.8392 -30.2699   11.5  46.4   -0.4  -0.1124  -1.0    7.3	H1820-303
285.1795 -24.8148    3.4  39.1  -10.3  -0.3071  -3.4   10.1	HT1900.1-2455
288.8339  10.7771    7.0   3.5    9.5   0.1011   1.6   10.3	GRS 1915+105
299.5939  35.2716    8.9  22.9 -178.6  -0.0851  -1.3    4.2	Cyg X-1
307.9873  40.9216    7.6  31.0 -171.8  -0.1091  -1.5    5.9	Cyg X-3
326.1361  38.5329    0.0  39.9 -152.7   0.1062   1.1   12.8	Cyg X-2
262.8512 -33.9066    6.8  54.6   10.2   0.4228   1.7    8.1	GX 354-0
247.2614 -18.8568    2.8  53.7   35.5   2.5573   4.2 ------	UNKNOWN
331.0758  47.1537    2.3  47.3 -161.0   0.5703   5.0 ------	UNKNOWN
319.7668 -25.4626    0.7  48.6  -54.0   9.6695  16.5 ------	UNKNOWN
Webpage updated on:
Thu Dec 17 17:13:27 EST 2015