Analysis Summary
Notes:
- 1) No attempt has been made to eliminate the non-significant decimal places.
- 2) This batgrbproduct analysis is done using the HEASARC data.
- 3) This batgrbproduct analysis is using the flight position for the mask-weighting calculation.
======================================================================
BAT GRB EVENT DATA PROCESSING REPORT
Process Script Ver: batgrbproduct v2.46
Process Start Time: Sun Jan 12 03:53:02 EST 2014
Host Name: batevent1
Current Working Dir: /local/data/batevent/batevent_reproc/trigger554996
======================================================================
Trigger: 00554996 Segment: 000
BAT Trigger Time: 389209841.152 [s; MET]
Trigger Stop: 389209841.216 [s; MET]
UTC: 2013-05-02T17:50:30.642920 [includes UTCF correction]
Where From?: (*SHORT BURST*) TDRSS scaled map message
BAT
RA: 138.577789038498 Dec: -0.143261927772071 [deg; J2000]
Catalogged Source?: NO
Point Source?: YES
GRB Indicated?: YES [ by BAT flight software ]
Image S/N Ratio: 7.75
Image Trigger?: NO
Rate S/N Ratio: 13.076696830622 [ if not an image trigger ]
Image S/N Ratio: 7.75
Analysis Position: [ source = BAT ]
RA: 138.577789038498 Dec: -0.143261927772071 [deg; J2000]
Refined Position: [ source = BAT pre-slew burst ]
RA: 138.576416102131 Dec: -0.143687216245506 [deg; J2000]
{ 09h 14m 18.3s , -00d 08' 37.3" }
+/- 1.89503469948159 [arcmin] (estimated 90% radius based on SNR)
+/- 0.923253093726447 [arcmin] (formal 1-sigma fit error)
SNR: 12.2045684545505
Angular difference between the analysis and refined position is 0.086238 arcmin
Partial Coding Fraction: 0.4726562 [ including projection effects ]
Duration
T90: 7.567999958992 +/- 4.44984135991245
Measured from: -0.100000023841858
to: 7.46799993515015 [s; relative to TRIGTIME]
T50: 2.33199995756149 +/- 0.456508505864197
Measured from: 0.167999982833862
to: 2.49999994039536 [s; relative to TRIGTIME]
Fluence
Peak Flux (peak 1 second)
Measured from: -0.216000020503998
to: 0.783999979496002 [s; relative to TRIGTIME]
Total Fluence
Measured from: -0.196000039577484
to: 10.2039999961853 [s; relative to TRIGTIME]
Band 1 Band 2 Band 3 Band 4
15-25 25-50 50-100 100-350 keV
Total 0.243782 0.255007 0.203317 0.020296
0.031770 0.033184 0.030699 0.031037 [error]
Peak 0.084963 0.127071 0.105184 0.016687
0.011129 0.012343 0.011447 0.010026 [error]
[ fluence units of on-axis counts / fully illuminated detector ]
======================================================================
====== Table of the duration information =============================
Value tstart tstop
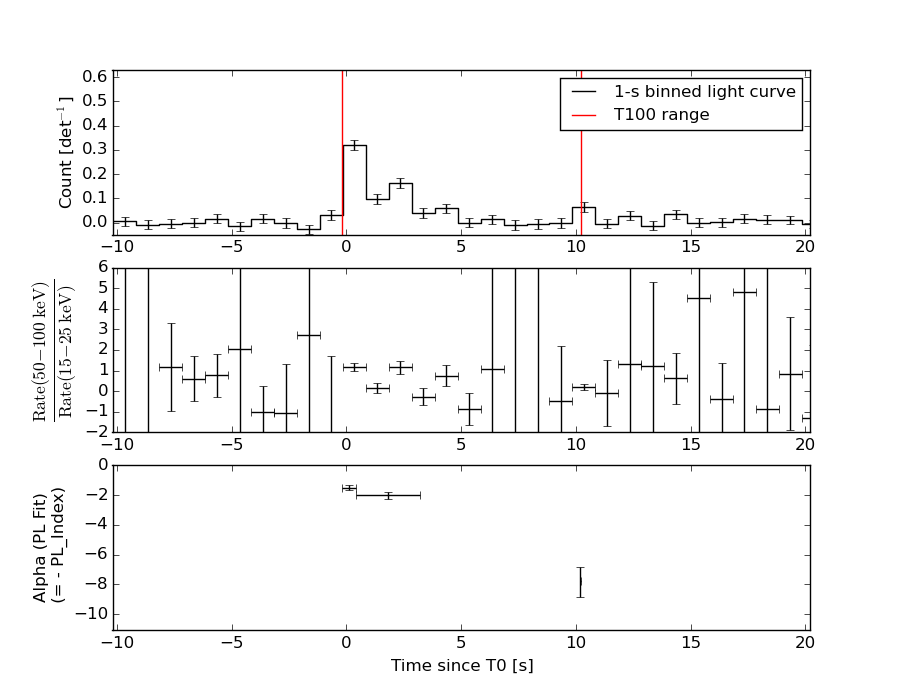
T100 10.400 -0.196 10.204
T90 7.568 -0.100 7.468
T50 2.332 0.168 2.500
Peak 1.000 -0.216 0.784
====== Spectral Analysis Summary =====================================
Model : spectral model: simple power-law (PL) and cutoff power-law (CPL)
Ph_index : photon index: E^{Ph_index}
Ph_90err : 90% error of the photon index
Epeak : Epeak in keV
Epeak_90err: 90% error of Epeak
Norm : normalization at 50 keV in both the PL model and CPL model
Nomr_90err : 90% error of the normalization
chi2 : Chi-Squared
dof : degree of freedo
=== Time-averaged spectral analysis ===
(Best model with acceptable fit: PL)
Model Ph_index Ph_90err_low Ph_90err_hi Epeak Epeak_90err_low Epeak_90err_hi Norm Nomr_90err_low Norm_90err_hi chi2 dof
PL -1.856 -0.265 0.249 - - - 4.50e-03 -7.28e-04 7.05e-04 61.300 57
CPL -1.736 -0.590 1.109 99.062 -99.047 -99.062 5.24e-03 -5.24e-03 1.58e-02 61.260 56
=== 1-s peak spectral analysis ===
(Best model with acceptable fit: N/A)
Model Ph_index Ph_90err_low Ph_90err_hi Epeak Epeak_90err_low Epeak_90err_hi Norm Nomr_90err_low Norm_90err_hi chi2 dof
PL -1.724 -0.186 0.178 - - - 2.16e-02 -2.62e-03 2.58e-03 82.580 57
CPL -0.648 -0.763 0.901 58.811 -11.442 33.628 8.12e-02 -4.88e-02 1.60e-01 76.460 56
=== Fluence/Peak Flux Summary ===
Model Band1 Band2 Band3 Band4 Band5 Total
15-25 25-50 50-100 100-350 15-150 15-350 keV
Fluence PL 8.36e-08 1.24e-07 1.37e-07 2.85e-07 4.31e-07 6.29e-07 erg/cm2
90%_error_low -1.67e-08 -1.65e-08 -2.99e-08 -1.09e-07 -6.82e-08 -1.43e-07 erg/cm2
90%_error_hi 1.74e-08 1.65e-08 3.02e-08 1.47e-07 6.97e-08 1.72e-07 erg/cm2
Peak flux PL 1.10e+00 9.72e-01 5.89e-01 5.39e-01 2.89e+00 3.20e+00 ph/cm2/s
90%_error_low -1.77e-01 -1.07e-01 -9.04e-02 -1.45e-01 -3.17e-01 -3.53e-01 ph/cm2/s
90%_error_hi 1.85e-01 1.07e-01 9.02e-02 1.72e-01 3.18e-01 3.54e-01 ph/cm2/s
Fluence CPL 8.25e-08 1.26e-07 1.37e-07 2.29e-07 4.26e-07 5.74e-07 erg/cm2
90%_error_low -1.93e-08 -1.81e-08 -2.74e-08 -1.81e-07 -7.79e-08 -2.06e-07 erg/cm2
90%_error_hi 1.87e-08 2.23e-08 3.11e-08 7.95e-08 7.36e-08 1.02e-07 erg/cm2
Peak flux CPL 9.47e-01 1.09e+00 6.26e-01 1.86e-01 2.80e+00 2.85e+00 ph/cm2/s
90%_error_low -2.09e-01 -1.37e-01 -1.07e-01 -1.02e-01 -3.23e-01 -3.43e-01 ph/cm2/s
90%_error_hi 2.14e-01 1.41e-01 1.07e-01 2.03e-01 3.23e-01 3.62e-01 ph/cm2/s
======================================================================
Image
Pre-slew 15.0-350.0 keV image (Event data)
#   RAcent    DECcent   POSerr    Theta     Phi              Peak Cts       SNR   Name
  138.5764    -0.1437   0.0159    43.2770  -171.5646         0.7365808     12.205 TRIG_00554996

Foreground time interval of the image:
 -0.196   9.749 (delta_t =   9.945 [sec])
Background time interval of the image:
-239.152  -0.196 (delta_t = 238.956 [sec])
Light Curves
Note: The mask-weighted lightcurves have units of either count/det or counts/sec/det, where a det is 0.4 x 0.4 = 0.16 sq cm.
Full-time range; 1 s binning
Other quick-look light curves:
- 64 ms binning (zoomed)
- 16 ms binning (zoomed)
- 8 ms binning (zoomed)
- 2 ms binning (zoomed)
- SN=5 or 10 s binning (full-time range)
- Raw light curve
Spectra
- 64 ms binning (zoomed)
- 16 ms binning (zoomed)
- 8 ms binning (zoomed)
- 2 ms binning (zoomed)
- SN=5 or 10 s binning (full-time range)
- Raw light curve
Spectra
Notes:
- 1) The fitting includes the systematic errors.
- 2) When the burst includes telescope slew time periods, the fitting uses an average response file made from multiple 5-s response files through out the slew time plus single time preiod for the non-slew times, and weighted by the total counts in the corresponding time period using addrmf. An average response file is needed becuase a spectral fit using the pre-slew DRM will introduce some errors in both a spectral shape and a normalization if the PHA file contains a lot of the slew/post-slew time interval.
- 3) For fits to more complicated models (e.g. a power-law over a cutoff power-law), the BAT team has decided to require a chi-square improvement of more than 6 for each extra dof.
Time averaged spectrum fit using the average DRM
Power-law model
Time interval is from   -0.196 sec. to   10.204 sec.

Spectral model in power-law:
------------------------------------------------------------
Parameters  : value       lower 90%   higher 90%
Photon index: -1.85624     ( -0.264642   0.248946 )
Norm@50keV  : 4.50367E-03    ( -0.000728237   0.000705369 )
------------------------------------------------------------
#Fit statistic : Chi-Squared =          61.30 using 59 PHA bins.
# Reduced chi-squared =          1.075 for     57 degrees of freedom
# Null hypothesis probability =   3.244095e-01

Photon flux (15-150 keV)    in 10.4 sec: 0.634686 ( -0.085396  0.085482 ) ph/cm2/s
Energy fluence (15-150 keV)             : 4.30709e-07 ( -6.8221e-08  6.97097e-08 ) ergs/cm2
Cutoff power-law model
Time interval is from   -0.196 sec. to   10.204 sec.
Spectral model in the cutoff power-law:
------------------------------------------------------------
Parameters  : value       lower 90%   higher 90%
Photon index: -1.73621     ( -0.589797   1.10896 )
Epeak [keV] : 99.0622      ( -99.2768 -99.2915 )
Norm@50keV  : 5.24359E-03    ( -0.00524051   0.0157673 )
------------------------------------------------------------
#Fit statistic : Chi-Squared =          61.26 using 59 PHA bins.
# Reduced chi-squared =          1.094 for     56 degrees of freedom
# Null hypothesis probability =   2.929956e-01

Photon flux (15-150 keV)    in 10.4 sec: 0.631436 ( -0.089376  0.087885 ) ph/cm2/s
Energy fluence (15-150 keV)             : 4.25827e-07 ( -7.78558e-08  7.36015e-08 ) ergs/cm2
1-s peak spectrum fit
Power-law model
Time interval is from   -0.216 sec. to    0.784 sec.

Spectral model in power-law:
------------------------------------------------------------
Parameters  : value       lower 90%   higher 90%
Photon index: -1.72382     ( -0.1856   0.178161 )
Norm@50keV  : 2.15935E-02    ( -0.00261545   0.00257985 )
------------------------------------------------------------
#Fit statistic : Chi-Squared =          82.58 using 59 PHA bins.
# Reduced chi-squared =          1.449 for     57 degrees of freedom
# Null hypothesis probability =   1.501478e-02

Photon flux (15-150 keV)    in 1 sec: 2.89226 ( -0.31738  0.31757 ) ph/cm2/s
Energy fluence (15-150 keV)             : 1.99609e-07 ( -2.49665e-08  2.52757e-08 ) ergs/cm2
Cutoff power-law model
Time interval is from   -0.216 sec. to    0.784 sec.
Spectral model in the cutoff power-law:
------------------------------------------------------------
Parameters  : value       lower 90%   higher 90%
Photon index: -0.648154     ( -0.763361   0.900532 )
Epeak [keV] : 58.8106      ( -11.4416 33.6278 )
Norm@50keV  : 8.11765E-02    ( -0.0487548   0.160043 )
------------------------------------------------------------
#Fit statistic : Chi-Squared =          76.46 using 59 PHA bins.
# Reduced chi-squared =          1.365 for     56 degrees of freedom
# Null hypothesis probability =   3.599775e-02

Photon flux (15-150 keV)    in 1 sec: 2.80241 ( -0.32285  0.32335 ) ph/cm2/s
Energy fluence (15-150 keV)             : 1.86672e-07 ( -2.58446e-08  2.66571e-08 ) ergs/cm2
Time-resolved spectra
Distribution
T90 vs. Hardness ratio plot
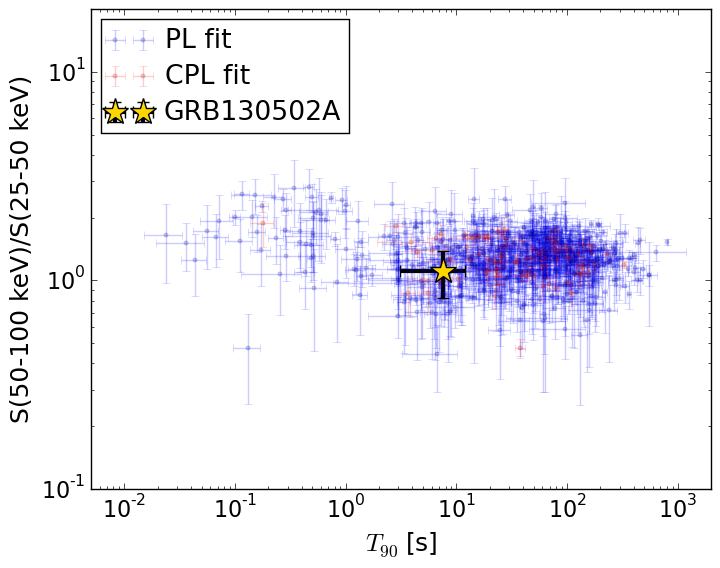
T90                                   = 7.568 sec.
Hardness ratio (energy fluence ratio) = 1.10481672
S(15-50 keV) vs. S(50-150 keV) plot
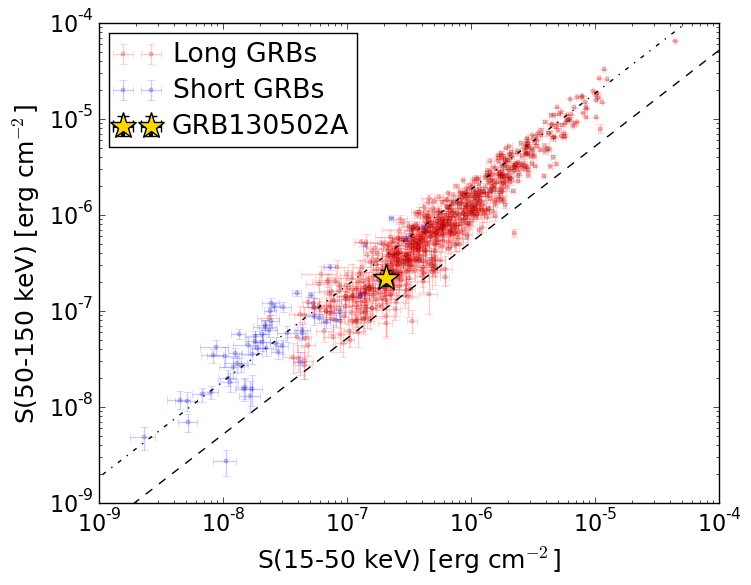
S(15-50 keV)  = 2.0742075e-07
S(50-150 keV) = 2.2328809e-07
The dash-dotted line and the dashed line traces the fluences calculated from the Band function with Epeak = 15 and 150 keV, respectively. Both lines assume a canonical values of alpha = -1 and beta = -2.5.
Mask shadow pattern
IMX = -9.314096645177184E-01, IMY = 1.381271159145886E-01
Spacecraft aspect plot
Bright source in the pre-burst/pre-slew/post-slew images
Pre-burst image of 15-350 keV band
Time interval of the image:
-239.152000 -0.196000

# RAcent  DECcent POSerr Theta    Phi  PeakCts   SNR AngSep     Name
#  [deg]    [deg]    ['] [deg]  [deg]                   [']
182.5164  10.3084    2.9  19.6  103.9   1.0040   4.0 ------	UNKNOWN
232.7177  45.5931    2.0  49.8    4.9   2.9460   5.7 ------	UNKNOWN
193.3907  43.5903    2.9  22.8   -6.8   0.8384   4.0 ------	UNKNOWN
203.1304  62.0693    2.1  39.6  -25.8   1.8004   5.6 ------	UNKNOWN
Pre-slew background subtracted image of 15-350 keV band
Time interval of the image:
-0.196000 9.748600

# RAcent  DECcent POSerr Theta    Phi  PeakCts   SNR AngSep     Name
#  [deg]    [deg]    ['] [deg]  [deg]                   [']
165.5934 -18.0130    1.9  46.3  142.6   0.9392   6.3 ------	UNKNOWN
165.5766  -1.2106    2.1  29.8  147.9   0.2847   5.5 ------	UNKNOWN
138.5764  -0.1437    1.0  43.3 -171.6   0.7366  12.2 ------	UNKNOWN
Post-slew image of 15-350 keV band
Time interval of the image:
74.948630 620.748610

# RAcent  DECcent POSerr Theta    Phi  PeakCts   SNR AngSep     Name
#  [deg]    [deg]    ['] [deg]  [deg]                   [']
135.4991 -40.6034    4.5  40.6  168.1   1.7848   2.6    3.2	Vela X-1
169.0518 -30.0830    2.9  41.7  123.2   6.0111   3.9 ------	UNKNOWN
162.8410  22.8983    2.8  33.0   28.6   2.0571   4.2 ------	UNKNOWN
128.2206 -49.2475    2.9  49.9  173.3   4.2283   4.0 ------	UNKNOWN
 94.2641 -43.6631    4.7  58.7 -159.3   8.0336   2.5 ------	UNKNOWN
105.3587  35.4240    3.8  47.1  -53.0   6.5242   3.1 ------	UNKNOWN
 92.8254 -18.4173    3.4  48.5 -130.3   7.2044   3.4 ------	UNKNOWN