Analysis Summary
Notes:
- 1) No attempt has been made to eliminate the non-significant decimal places.
- 2) This batgrbproduct analysis is done using the HEASARC data.
- 3) This batgrbproduct analysis is using the flight position for the mask-weighting calculation.
======================================================================
BAT GRB EVENT DATA PROCESSING REPORT
Process Script Ver: batgrbproduct v2.46
Process Start Time: Sat Jan 11 23:32:28 EST 2014
Host Name: batevent1
Current Working Dir: /local/data/batevent/batevent_reproc/trigger568849
======================================================================
Trigger: 00568849 Segment: 000
BAT Trigger Time: 399647067.52 [s; MET]
Trigger Stop: 399647068.032 [s; MET]
UTC: 2013-08-31T13:04:16.543620 [includes UTCF correction]
Where From?: TDRSS position message
BAT
RA: 358.64872508801 Dec: 29.4481629872927 [deg; J2000]
Catalogged Source?: NO
Point Source?: YES
GRB Indicated?: YES [ by BAT flight software ]
Image S/N Ratio: 10.54
Image Trigger?: NO
Rate S/N Ratio: 19.3907194296653 [ if not an image trigger ]
Image S/N Ratio: 10.54
Analysis Position: [ source = BAT ]
RA: 358.64872508801 Dec: 29.4481629872927 [deg; J2000]
Refined Position: [ source = BAT pre-slew burst ]
RA: 358.635142583249 Dec: 29.4305150706284 [deg; J2000]
{ 23h 54m 32.4s , +29d 25' 49.9" }
+/- 0.66811953680312 [arcmin] (estimated 90% radius based on SNR)
+/- 0.213143703255965 [arcmin] (formal 1-sigma fit error)
SNR: 54.1161269143636
Angular difference between the analysis and refined position is 1.274724 arcmin
Partial Coding Fraction: 0.28125 [ including projection effects ]
Duration
T90: 30.191999912262 +/- 2.32627165769635
Measured from: 0.612000048160553
to: 30.8039999604225 [s; relative to TRIGTIME]
T50: 7.99199998378754 +/- 0.589250360445893
Measured from: 2.41200000047684
to: 10.4039999842644 [s; relative to TRIGTIME]
Fluence
Peak Flux (peak 1 second)
Measured from: 2.2960000038147
to: 3.2960000038147 [s; relative to TRIGTIME]
Total Fluence
Measured from: -1.85600000619888
to: 41.37600004673 [s; relative to TRIGTIME]
Band 1 Band 2 Band 3 Band 4
15-25 25-50 50-100 100-350 keV
Total 3.499010 4.203083 2.460218 0.582344
0.068236 0.072227 0.061454 0.046134 [error]
Peak 0.403943 0.579123 0.391252 0.101857
0.016941 0.019521 0.017310 0.011168 [error]
[ fluence units of on-axis counts / fully illuminated detector ]
======================================================================
====== Table of the duration information =============================
Value tstart tstop
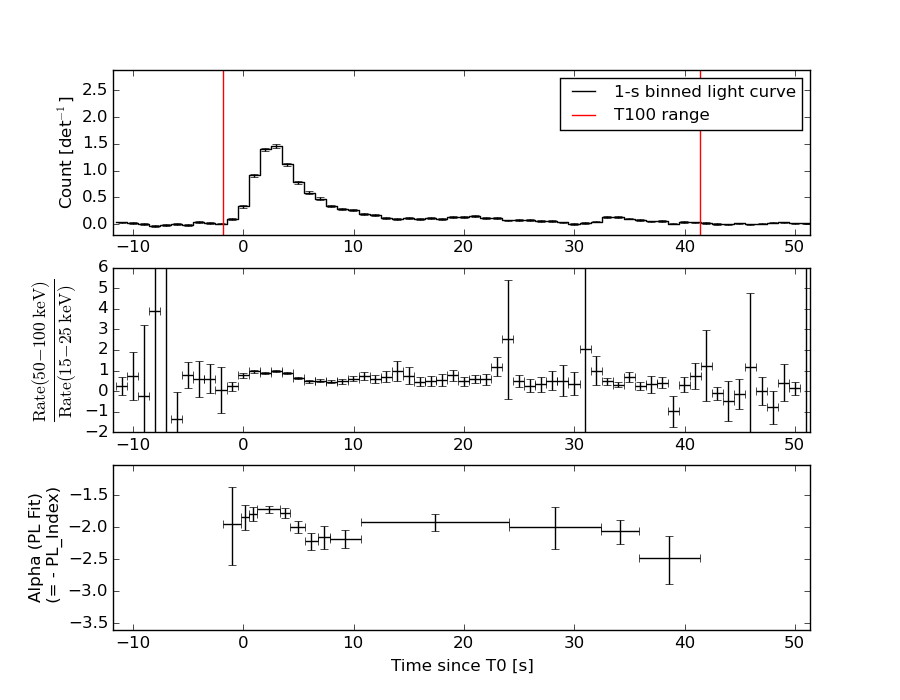
T100 43.232 -1.856 41.376
T90 30.192 0.612 30.804
T50 7.992 2.412 10.404
Peak 1.000 2.296 3.296
====== Spectral Analysis Summary =====================================
Model : spectral model: simple power-law (PL) and cutoff power-law (CPL)
Ph_index : photon index: E^{Ph_index}
Ph_90err : 90% error of the photon index
Epeak : Epeak in keV
Epeak_90err: 90% error of Epeak
Norm : normalization at 50 keV in both the PL model and CPL model
Nomr_90err : 90% error of the normalization
chi2 : Chi-Squared
dof : degree of freedo
=== Time-averaged spectral analysis ===
(Best model with acceptable fit: PL)
Model Ph_index Ph_90err_low Ph_90err_hi Epeak Epeak_90err_low Epeak_90err_hi Norm Nomr_90err_low Norm_90err_hi chi2 dof
PL -1.928 -0.049 0.049 - - - 1.64e-02 -4.10e-04 4.10e-04 56.670 57
CPL -1.914 -0.222 0.187 319.855 -319.842 -319.855 1.66e-02 -3.46e-03 3.68e-03 56.660 56
=== 1-s peak spectral analysis ===
(Best model with acceptable fit: PL)
Model Ph_index Ph_90err_low Ph_90err_hi Epeak Epeak_90err_low Epeak_90err_hi Norm Nomr_90err_low Norm_90err_hi chi2 dof
PL -1.703 -0.074 0.073 - - - 1.02e-01 -4.27e-03 4.26e-03 56.440 57
CPL -1.545 -0.196 0.279 149.325 N/A N/A 1.22e-01 N/A N/A 55.390 56
=== Fluence/Peak Flux Summary ===
Model Band1 Band2 Band3 Band4 Band5 Total
15-25 25-50 50-100 100-350 15-150 15-350 keV
Fluence PL 1.35e-06 1.92e-06 2.01e-06 3.90e-06 6.50e-06 9.18e-06 erg/cm2
90%_error_low -6.40e-08 -5.21e-08 -6.65e-08 -2.82e-07 -1.62e-07 -3.24e-07 erg/cm2
90%_error_hi 6.53e-08 5.19e-08 6.64e-08 2.96e-07 1.62e-07 3.33e-07 erg/cm2
Peak flux PL 5.10e+00 4.55e+00 2.80e+00 2.61e+00 1.36e+01 1.51e+01 ph/cm2/s
90%_error_low -3.67e-01 -2.02e-01 -1.47e-01 -2.72e-01 -5.90e-01 -6.12e-01 ph/cm2/s
90%_error_hi 3.77e-01 2.01e-01 1.46e-01 2.90e-01 5.91e-01 6.13e-01 ph/cm2/s
Fluence CPL 1.35e-06 1.92e-06 2.01e-06 3.83e-06 6.50e-06 9.10e-06 erg/cm2
90%_error_low -8.31e-08 -5.33e-08 -6.04e-08 -8.60e-07 -1.84e-07 -8.87e-07 erg/cm2
90%_error_hi 8.31e-08 5.64e-08 7.08e-08 3.63e-07 1.68e-07 3.92e-07 erg/cm2
Peak flux CPL 4.94e+00 4.61e+00 2.84e+00 2.20e+00 1.34e+01 1.46e+01 ph/cm2/s
90%_error_low -4.50e-01 -2.23e-01 -1.64e-01 -5.49e-01 -6.20e-01 -8.73e-01 ph/cm2/s
90%_error_hi 4.59e-01 2.25e-01 1.66e-01 5.11e-01 6.21e-01 8.93e-01 ph/cm2/s
======================================================================
Image
Pre-slew 15.0-350.0 keV image (Event data)
#   RAcent    DECcent   POSerr    Theta     Phi              Peak Cts       SNR   Name
  358.6351    29.4305   0.0035    41.6361    28.7309         8.3350036     54.116 TRIG_00568849

Foreground time interval of the image:
 -1.856   9.781 (delta_t =  11.637 [sec])
Background time interval of the image:
-239.520  -1.856 (delta_t = 237.664 [sec])
Light Curves
Note: The mask-weighted lightcurves have units of either count/det or counts/sec/det, where a det is 0.4 x 0.4 = 0.16 sq cm.
Full-time range; 1 s binning
Other quick-look light curves:
- 64 ms binning (zoomed)
- 16 ms binning (zoomed)
- 8 ms binning (zoomed)
- 2 ms binning (zoomed)
- SN=5 or 10 s binning (full-time range)
- Raw light curve
Spectra
- 64 ms binning (zoomed)
- 16 ms binning (zoomed)
- 8 ms binning (zoomed)
- 2 ms binning (zoomed)
- SN=5 or 10 s binning (full-time range)
- Raw light curve
Spectra
Notes:
- 1) The fitting includes the systematic errors.
- 2) When the burst includes telescope slew time periods, the fitting uses an average response file made from multiple 5-s response files through out the slew time plus single time preiod for the non-slew times, and weighted by the total counts in the corresponding time period using addrmf. An average response file is needed becuase a spectral fit using the pre-slew DRM will introduce some errors in both a spectral shape and a normalization if the PHA file contains a lot of the slew/post-slew time interval.
- 3) For fits to more complicated models (e.g. a power-law over a cutoff power-law), the BAT team has decided to require a chi-square improvement of more than 6 for each extra dof.
Time averaged spectrum fit using the average DRM
Power-law model

Time interval is from   -1.856 sec. to   41.376 sec.

Spectral model in power-law:
------------------------------------------------------------
Parameters  : value       lower 90%   higher 90%
Photon index: -1.9284     ( -0.0488862   0.0486334 )
Norm@50keV  : 1.63560E-02    ( -0.000410423   0.000409716 )
------------------------------------------------------------
#Fit statistic : Chi-Squared =          56.67 using 59 PHA bins.
# Reduced chi-squared =         0.9942 for     57 degrees of freedom
# Null hypothesis probability =   4.873431e-01

Photon flux (15-150 keV)    in 43.23 sec: 2.37624 ( -0.06955  0.06992 ) ph/cm2/s
Energy fluence (15-150 keV)             : 6.50439e-06 ( -1.6167e-07  1.6192e-07 ) ergs/cm2
Cutoff power-law model
Time interval is from   -1.856 sec. to   41.376 sec.
Spectral model in the cutoff power-law:
------------------------------------------------------------
Parameters  : value       lower 90%   higher 90%
Photon index: -1.9144     ( -0.222379   0.187345 )
Epeak [keV] : 319.855      ( -321.906 -321.919 )
Norm@50keV  : 1.66107E-02    ( -0.00345675   0.00367831 )
------------------------------------------------------------
#Fit statistic : Chi-Squared =          56.66 using 59 PHA bins.
# Reduced chi-squared =          1.012 for     56 degrees of freedom
# Null hypothesis probability =   4.503941e-01

Photon flux (15-150 keV)    in 43.23 sec: 2.37319 ( -0.07944  0.07253 ) ph/cm2/s
Energy fluence (15-150 keV)             : 6.49747e-06 ( -1.84186e-07  1.6807e-07 ) ergs/cm2
1-s peak spectrum fit
Power-law model
Time interval is from    2.296 sec. to    3.296 sec.

Spectral model in power-law:
------------------------------------------------------------
Parameters  : value       lower 90%   higher 90%
Photon index: -1.70336     ( -0.0735909   0.0729188 )
Norm@50keV  : 0.101943    ( -0.00427478   0.00425852 )
------------------------------------------------------------
#Fit statistic : Chi-Squared =          56.44 using 59 PHA bins.
# Reduced chi-squared =         0.9902 for     57 degrees of freedom
# Null hypothesis probability =   4.960543e-01

Photon flux (15-150 keV)    in 1 sec: 13.5557 ( -0.5896  0.5909 ) ph/cm2/s
Energy fluence (15-150 keV)             : 9.43757e-07 ( -4.10018e-08  4.11155e-08 ) ergs/cm2
Cutoff power-law model

Time interval is from    2.296 sec. to    3.296 sec.
Spectral model in the cutoff power-law:
------------------------------------------------------------
Parameters  : value       lower 90%   higher 90%
Photon index: -1.54476     ( -0.196087   0.278735 )
Epeak [keV] : 149.325      (   )
Norm@50keV  : 0.121913    (     )
------------------------------------------------------------
#Fit statistic : Chi-Squared =          55.39 using 59 PHA bins.
# Reduced chi-squared =         0.9892 for     56 degrees of freedom
# Null hypothesis probability =   4.977414e-01

Photon flux (15-150 keV)    in 1 sec: 13.4362 ( -0.6196  0.6213 ) ph/cm2/s
Energy fluence (15-150 keV)             : 9.35255e-07 ( -4.36141e-08  4.34685e-08 ) ergs/cm2
Time-resolved spectra
Distribution
T90 vs. Hardness ratio plot
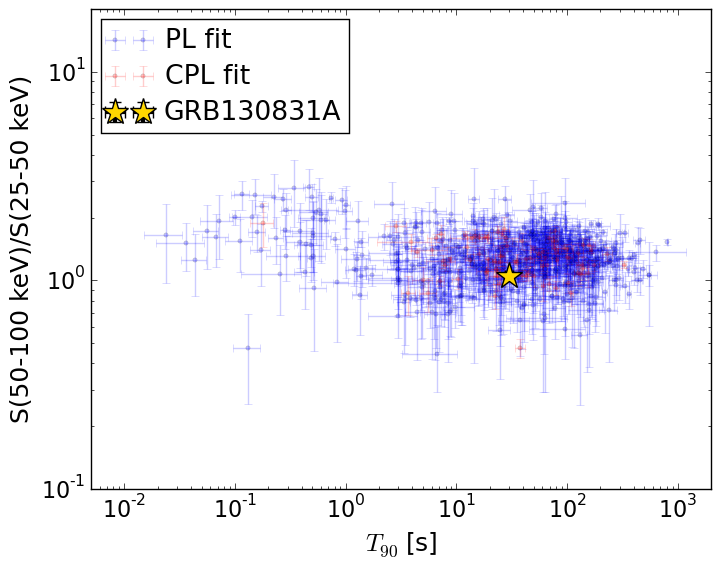
T90                                   = 30.192 sec.
Hardness ratio (energy fluence ratio) = 1.05089677635
S(15-50 keV) vs. S(50-150 keV) plot
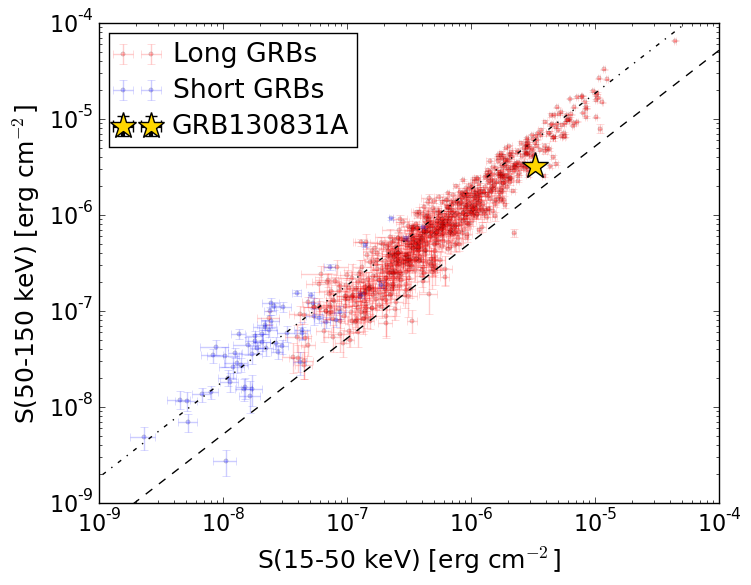
S(15-50 keV)  = 3.267213e-06
S(50-150 keV) = 3.237191e-06
The dash-dotted line and the dashed line traces the fluences calculated from the Band function with Epeak = 15 and 150 keV, respectively. Both lines assume a canonical values of alpha = -1 and beta = -2.5.
Mask shadow pattern
IMX = 7.795257443649564E-01, IMY = -4.273236697306579E-01
Spacecraft aspect plot
Bright source in the pre-burst/pre-slew/post-slew images
Pre-burst image of 15-350 keV band
Time interval of the image:
-239.520000 -1.856000

# RAcent  DECcent POSerr Theta    Phi  PeakCts   SNR AngSep     Name
#  [deg]    [deg]    ['] [deg]  [deg]                   [']
285.1341 -25.1333    0.0  48.6 -135.1   0.5448   0.7   13.8	HT1900.1-2455
299.5990  35.1945    2.0  45.5  -45.9   2.5643   5.7    0.6	Cyg X-1
308.1438  40.9982    1.7  46.1  -33.6   2.3322   6.7    3.1	Cyg X-3
326.3221  38.3048    5.0  39.5  -15.0   0.5112   2.3    7.2	Cyg X-2
337.0766  43.4778    3.5  45.1   -3.4   0.9242   3.3 ------	UNKNOWN
Pre-slew background subtracted image of 15-350 keV band
Time interval of the image:
-1.856000 9.780590

# RAcent  DECcent POSerr Theta    Phi  PeakCts   SNR AngSep     Name
#  [deg]    [deg]    ['] [deg]  [deg]                   [']
285.1216 -25.1207   17.6  48.6 -135.0  -0.1052  -0.7   12.9	HT1900.1-2455
299.6558  35.2308    6.8  45.5  -45.8  -0.2245  -1.7    3.7	Cyg X-1
308.2612  40.9829   84.5  46.1  -33.5   0.0137   0.1    7.1	Cyg X-3
326.3466  38.3763    5.0  39.5  -15.0  -0.1851  -2.3    8.9	Cyg X-2
358.6351  29.4305    0.2  41.6   28.7   8.3349  54.2 ------	UNKNOWN
315.3471  -9.9365    3.0  16.2 -135.4   0.1932   3.8 ------	UNKNOWN
Post-slew image of 15-350 keV band
Time interval of the image:
113.180600 850.580610

# RAcent  DECcent POSerr Theta    Phi  PeakCts   SNR AngSep     Name
#  [deg]    [deg]    ['] [deg]  [deg]                   [']
299.4851  35.2952    9.5  49.6  174.9   1.2050   1.2    7.6	Cyg X-1
308.1191  40.9370    2.0  42.3 -178.2   3.1880   5.7    1.0	Cyg X-3
326.2021  38.4517    4.2  28.2  179.3   1.0150   2.7    7.9	Cyg X-2
296.2195  48.9517    3.6  50.6 -167.0   3.2605   3.2 ------	UNKNOWN
 49.9397  20.5409    2.4  47.0  -29.5   3.2798   4.8 ------	UNKNOWN