Analysis Summary
Notes:
- 1) No attempt has been made to eliminate the non-significant decimal places.
- 2) This batgrbproduct analysis is done using the HEASARC data.
- 3) This batgrbproduct analysis is using the flight position for the mask-weighting calculation.
======================================================================
BAT GRB EVENT DATA PROCESSING REPORT
Process Script Ver: batgrbproduct v2.46
Process Start Time: Sat Oct 4 23:02:09 EDT 2014
Host Name: batevent1
Current Working Dir: /local/data/batevent/batevent_reproc/trigger598497
======================================================================
Trigger: 00598497 Segment: 000
BAT Trigger Time: 421294945.6 [s; MET]
Trigger Stop: 421294949.696 [s; MET]
UTC: 2014-05-09T02:22:13.613280 [includes UTCF correction]
Where From?: TDRSS position message
BAT
RA: 46.608358981037 Dec: -62.6535551180924 [deg; J2000]
Catalogged Source?: NO
Point Source?: YES
GRB Indicated?: YES [ by BAT flight software ]
Image S/N Ratio: 7.6
Image Trigger?: NO
Rate S/N Ratio: 10.1488915650922 [ if not an image trigger ]
Image S/N Ratio: 7.6
Analysis Position: [ source = BAT ]
RA: 46.608358981037 Dec: -62.6535551180924 [deg; J2000]
Refined Position: [ source = BAT pre-slew burst ]
RA: 46.5638255707873 Dec: -62.6615448529256 [deg; J2000]
{ 03h 06m 15.3s , -62d 39' 41.6" }
+/- 1.88996159479005 [arcmin] (estimated 90% radius based on SNR)
+/- 0.78407929161078 [arcmin] (formal 1-sigma fit error)
SNR: 12.2513952930359
Angular difference between the analysis and refined position is 1.317576 arcmin
Partial Coding Fraction: 0.1953125 [ including projection effects ]
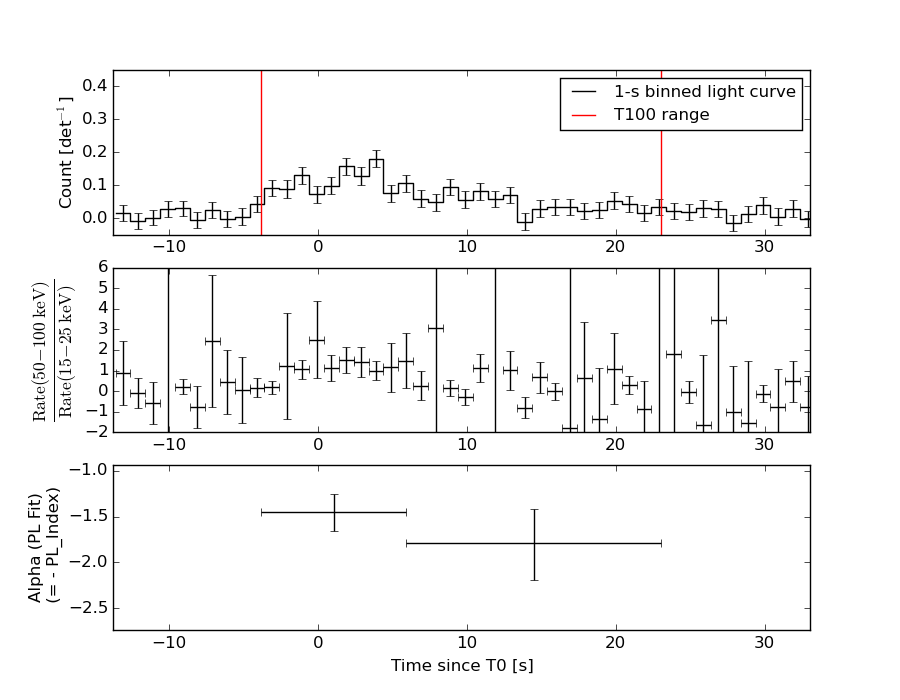
Duration
T90: 23.216000020504 +/- 5.17115694874123
Measured from: -2.83200001716614
to: 20.3840000033379 [s; relative to TRIGTIME]
T50: 9.12000000476837 +/- 2.60171022872606
Measured from: 0.991999983787537
to: 10.1119999885559 [s; relative to TRIGTIME]
Fluence
Peak Flux (peak 1 second)
Measured from: 1.77999997138977
to: 2.77999997138977 [s; relative to TRIGTIME]
Total Fluence
Measured from: -3.80800002813339
to: 23.055999994278 [s; relative to TRIGTIME]
Band 1 Band 2 Band 3 Band 4
15-25 25-50 50-100 100-350 keV
Total 0.553100 0.667540 0.499155 0.195584
0.068511 0.072066 0.064539 0.056305 [error]
Peak 0.050710 0.051194 0.074086 0.016698
0.013950 0.015238 0.013428 0.011574 [error]
[ fluence units of on-axis counts / fully illuminated detector ]
======================================================================
====== Table of the duration information =============================
Value tstart tstop
T100 26.864 -3.808 23.056
T90 23.216 -2.832 20.384
T50 9.120 0.992 10.112
Peak 1.000 1.780 2.780
====== Spectral Analysis Summary =====================================
Model : spectral model: simple power-law (PL) and cutoff power-law (CPL)
Ph_index : photon index: E^{Ph_index}
Ph_90err : 90% error of the photon index
Epeak : Epeak in keV
Epeak_90err: 90% error of Epeak
Norm : normalization at 50 keV in both the PL model and CPL model
Nomr_90err : 90% error of the normalization
chi2 : Chi-Squared
dof : degree of freedo
=== Time-averaged spectral analysis ===
(Best model with acceptable fit: N/A)
Model Ph_index Ph_90err_low Ph_90err_hi Epeak Epeak_90err_low Epeak_90err_hi Norm Nomr_90err_low Norm_90err_hi chi2 dof
PL -1.585 -0.196 0.193 - - - 4.89e-03 -5.72e-04 5.68e-04 74.120 57
CPL -1.238 -0.388 0.885 107.727 -50.787 -107.727 7.39e-03 N/A N/A 73.510 56
=== 1-s peak spectral analysis ===
(Best model with acceptable fit: PL)
Model Ph_index Ph_90err_low Ph_90err_hi Epeak Epeak_90err_low Epeak_90err_hi Norm Nomr_90err_low Norm_90err_hi chi2 dof
PL -1.493 -0.384 0.389 - - - 1.24e-02 -2.93e-03 2.93e-03 60.320 57
CPL -0.689 -1.149 3.189 85.663 -39.453 -85.663 3.08e-02 -3.08e-02 6.70e-01 59.860 56
=== Fluence/Peak Flux Summary ===
Model Band1 Band2 Band3 Band4 Band5 Total
15-25 25-50 50-100 100-350 15-150 15-350 keV
Fluence PL 1.82e-07 3.17e-07 4.22e-07 1.15e-06 1.23e-06 2.07e-06 erg/cm2
90%_error_low -3.34e-08 -3.74e-08 -6.39e-08 -3.28e-07 -1.53e-07 -3.88e-07 erg/cm2
90%_error_hi 3.49e-08 3.71e-08 6.34e-08 4.04e-07 1.55e-07 4.47e-07 erg/cm2
Peak flux PL 5.09e-01 5.14e-01 3.65e-01 4.13e-01 1.55e+00 1.80e+00 ph/cm2/s
90%_error_low -1.99e-01 -1.38e-01 -1.01e-01 -1.91e-01 -3.85e-01 -4.23e-01 ph/cm2/s
90%_error_hi 2.22e-01 1.34e-01 9.85e-02 2.62e-01 3.87e-01 4.23e-01 ph/cm2/s
Fluence CPL 1.72e-07 3.30e-07 4.32e-07 6.81e-07 1.20e-06 1.62e-06 erg/cm2
90%_error_low -3.94e-08 -4.58e-08 -6.82e-08 -4.41e-07 -1.69e-07 -4.75e-07 erg/cm2
90%_error_hi 3.99e-08 4.80e-08 7.01e-08 5.76e-07 1.67e-07 6.21e-07 erg/cm2
Peak flux CPL 4.34e-01 5.53e-01 4.00e-01 2.01e-01 1.51e+00 1.59e+00 ph/cm2/s
90%_error_low N/A -1.54e-01 -1.24e-01 -2.01e-01 -4.19e-01 -4.81e-01 ph/cm2/s
90%_error_hi N/A 1.72e-01 1.41e-01 3.94e-01 4.01e-01 4.70e-01 ph/cm2/s
======================================================================
Image
Pre-slew 15.0-350.0 keV image (Event data)
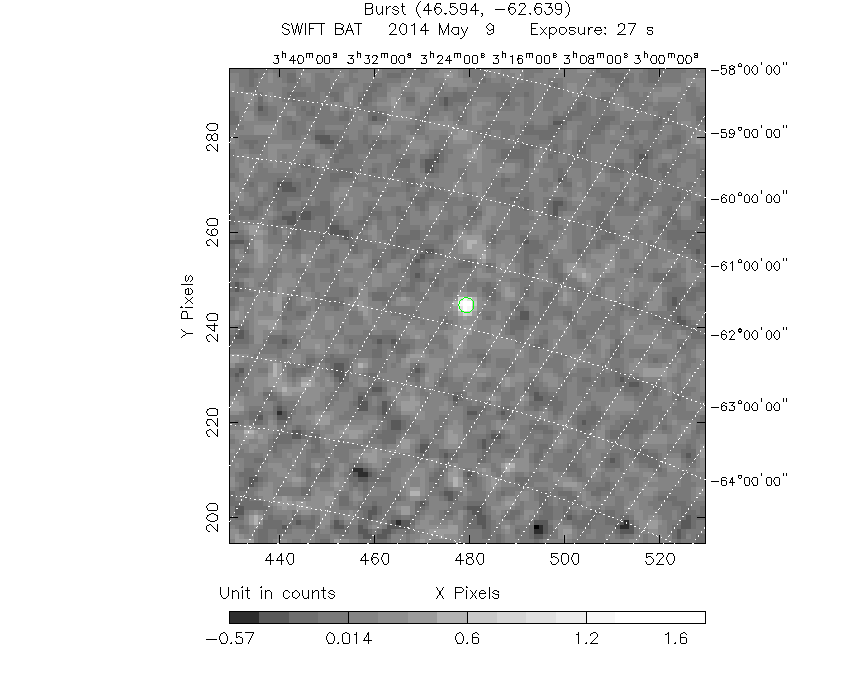
#   RAcent    DECcent   POSerr    Theta     Phi              Peak Cts       SNR   Name
   46.5638   -62.6615   0.0157    44.1914    30.0864         1.7220673     12.251 TRIG_00598497

Foreground time interval of the image:
 -3.808  23.056 (delta_t =  26.864 [sec])
Background time interval of the image:
-239.600  -3.808 (delta_t = 235.792 [sec])
Light Curves
Note: The mask-weighted lightcurves have units of either count/det or counts/sec/det, where a det is 0.4 x 0.4 = 0.16 sq cm.
Full-time range; 1 s binning
Other quick-look light curves:
- 64 ms binning (zoomed)
- 16 ms binning (zoomed)
- 8 ms binning (zoomed)
- 2 ms binning (zoomed)
- SN=5 or 10 s binning (full-time range)
- Raw light curve
Spectra
- 64 ms binning (zoomed)
- 16 ms binning (zoomed)
- 8 ms binning (zoomed)
- 2 ms binning (zoomed)
- SN=5 or 10 s binning (full-time range)
- Raw light curve
Spectra
Notes:
- 1) The fitting includes the systematic errors.
- 2) When the burst includes telescope slew time periods, the fitting uses an average response file made from multiple 5-s response files through out the slew time plus single time preiod for the non-slew times, and weighted by the total counts in the corresponding time period using addrmf. An average response file is needed becuase a spectral fit using the pre-slew DRM will introduce some errors in both a spectral shape and a normalization if the PHA file contains a lot of the slew/post-slew time interval.
- 3) For fits to more complicated models (e.g. a power-law over a cutoff power-law), the BAT team has decided to require a chi-square improvement of more than 6 for each extra dof.
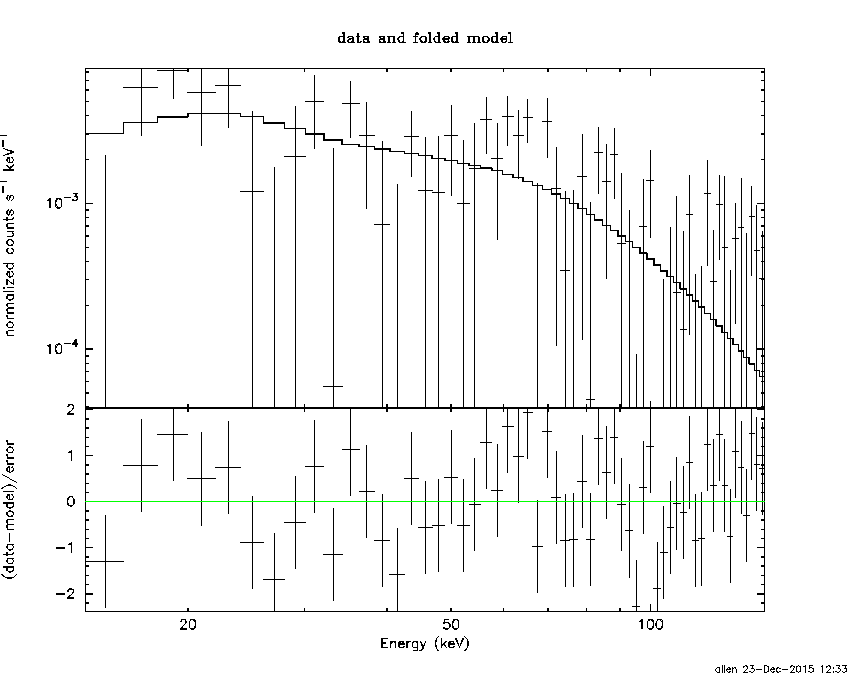
Time averaged spectrum fit using the average DRM
Power-law model
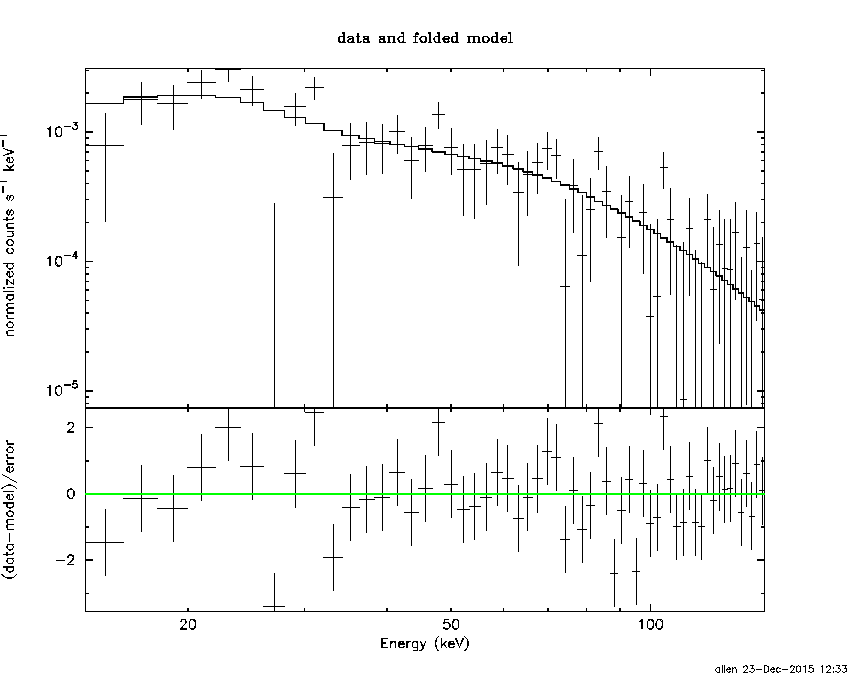
Time interval is from   -3.808 sec. to   23.056 sec.

Spectral model in power-law:
------------------------------------------------------------
Parameters  : value       lower 90%   higher 90%
Photon index: -1.5854     ( -0.195647   0.192991 )
Norm@50keV  : 4.88852E-03    ( -0.000572479   0.000568387 )
------------------------------------------------------------
#Fit statistic : Chi-Squared =          74.12 using 59 PHA bins.
# Reduced chi-squared =          1.300 for     57 degrees of freedom
# Null hypothesis probability =   6.338809e-02

Photon flux (15-150 keV)    in 26.86 sec: 0.625410 ( -0.072562  0.072701 ) ph/cm2/s
Energy fluence (15-150 keV)             : 1.2304e-06 ( -1.53449e-07  1.54715e-07 ) ergs/cm2
Cutoff power-law model
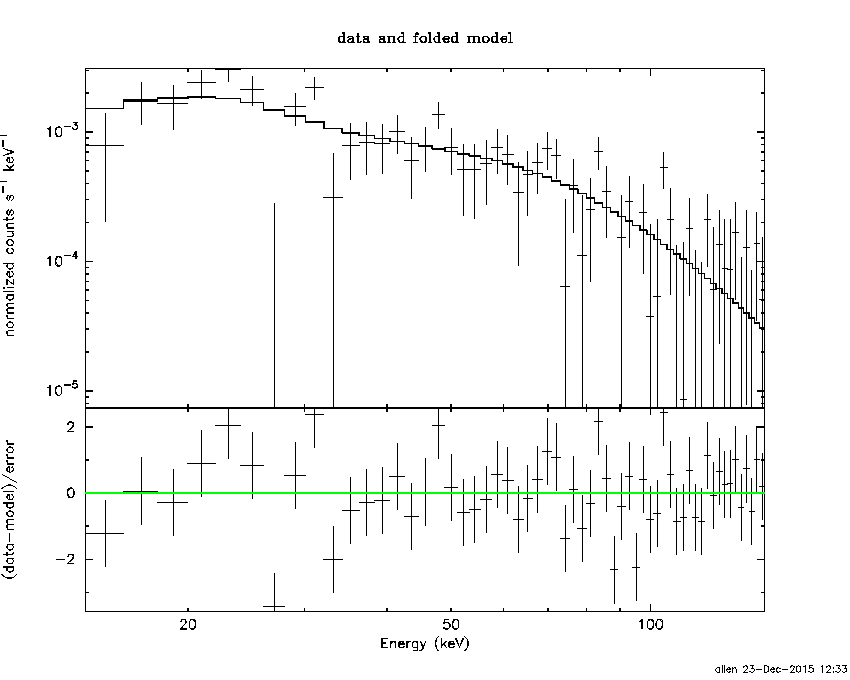
Time interval is from   -3.808 sec. to   23.056 sec.
Spectral model in the cutoff power-law:
------------------------------------------------------------
Parameters  : value       lower 90%   higher 90%
Photon index: -1.2377     ( -0.388476   0.885135 )
Epeak [keV] : 107.727      ( -50.7914 -107.732 )
Norm@50keV  : 7.39500E-03    (     )
------------------------------------------------------------
#Fit statistic : Chi-Squared =          73.51 using 59 PHA bins.
# Reduced chi-squared =          1.313 for     56 degrees of freedom
# Null hypothesis probability =   5.826590e-02

Photon flux (15-150 keV)    in 26.86 sec: 0.617269 ( -0.075065  0.074826 ) ph/cm2/s
Energy fluence (15-150 keV)             : 1.20068e-06 ( -1.68733e-07  1.67417e-07 ) ergs/cm2
1-s peak spectrum fit
Power-law model
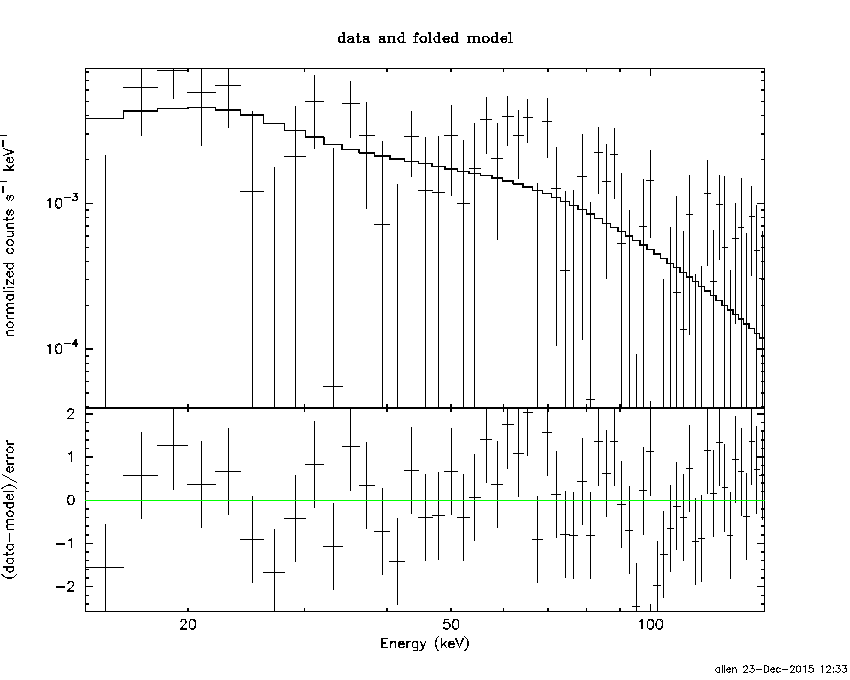
Time interval is from    1.780 sec. to    2.780 sec.

Spectral model in power-law:
------------------------------------------------------------
Parameters  : value       lower 90%   higher 90%
Photon index: -1.49284     ( -0.384184   0.389031 )
Norm@50keV  : 1.24468E-02    ( -0.00292938   0.00292564 )
------------------------------------------------------------
#Fit statistic : Chi-Squared =          60.32 using 59 PHA bins.
# Reduced chi-squared =          1.058 for     57 degrees of freedom
# Null hypothesis probability =   3.565690e-01

Photon flux (15-150 keV)    in 1 sec: 1.55090 ( -0.38515  0.38737 ) ph/cm2/s
Energy fluence (15-150 keV)             : 1.18233e-07 ( -2.91448e-08  2.92459e-08 ) ergs/cm2
Cutoff power-law model
Time interval is from    1.780 sec. to    2.780 sec.
Spectral model in the cutoff power-law:
------------------------------------------------------------
Parameters  : value       lower 90%   higher 90%
Photon index: -0.688695     ( -1.15442   3.1845 )
Epeak [keV] : 85.6629      ( -39.1718 -85.3819 )
Norm@50keV  : 3.08357E-02    ( -0.0311119   0.670096 )
------------------------------------------------------------
#Fit statistic : Chi-Squared =          59.86 using 59 PHA bins.
# Reduced chi-squared =          1.069 for     56 degrees of freedom
# Null hypothesis probability =   3.376244e-01

Photon flux (15-150 keV)    in 1 sec: 1.51360 ( -0.41867  0.40068 ) ph/cm2/s
Energy fluence (15-150 keV)             : 1.14601e-07 ( -3.06318e-08  3.07272e-08 ) ergs/cm2
Time-resolved spectra
Distribution
T90 vs. Hardness ratio plot
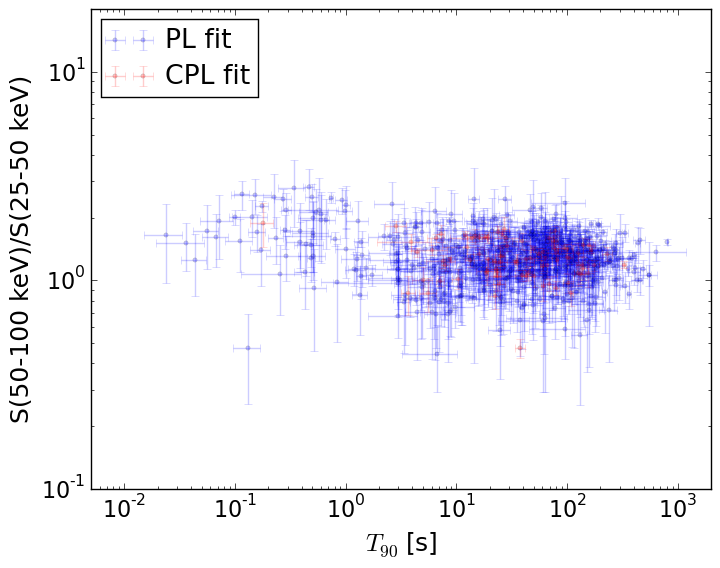
T90                                   = N/A sec.
Hardness ratio (energy fluence ratio) = N/A
S(15-50 keV) vs. S(50-150 keV) plot
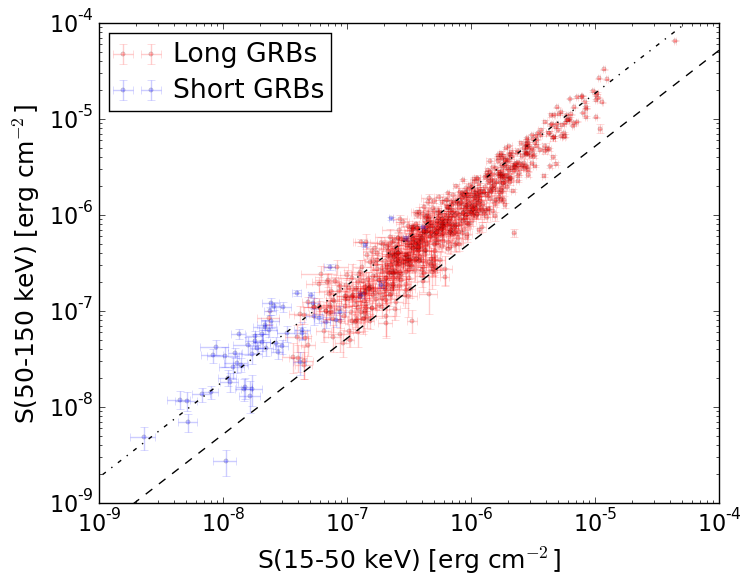
S(15-50 keV)  = N/A
S(50-150 keV) = N/A
The dash-dotted line and the dashed line traces the fluences calculated from the Band function with Epeak = 15 and 150 keV, respectively. Both lines assume a canonical values of alpha = -1 and beta = -2.5.
Mask shadow pattern
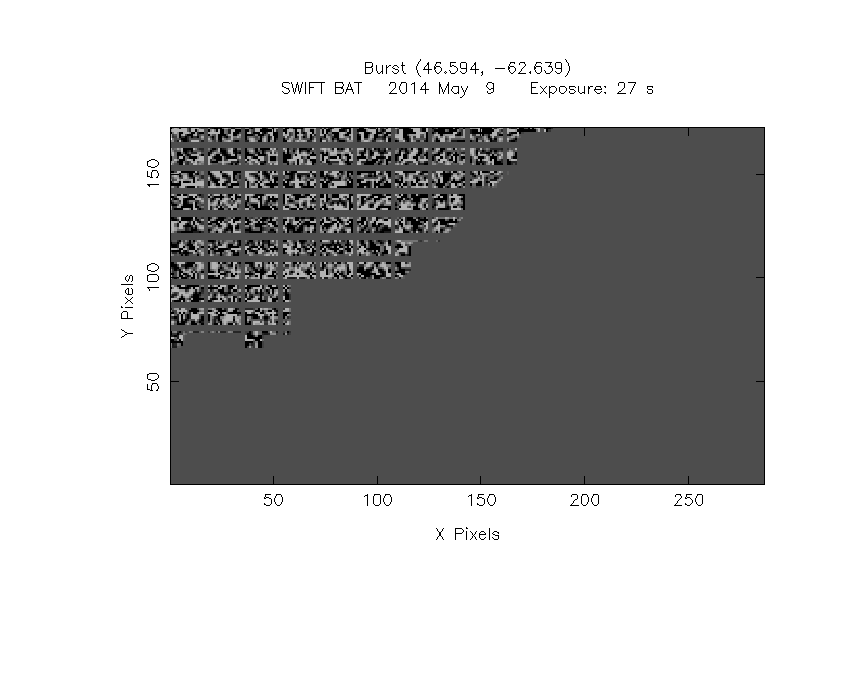
IMX = 8.411866616131900E-01, IMY = -4.873513786934941E-01
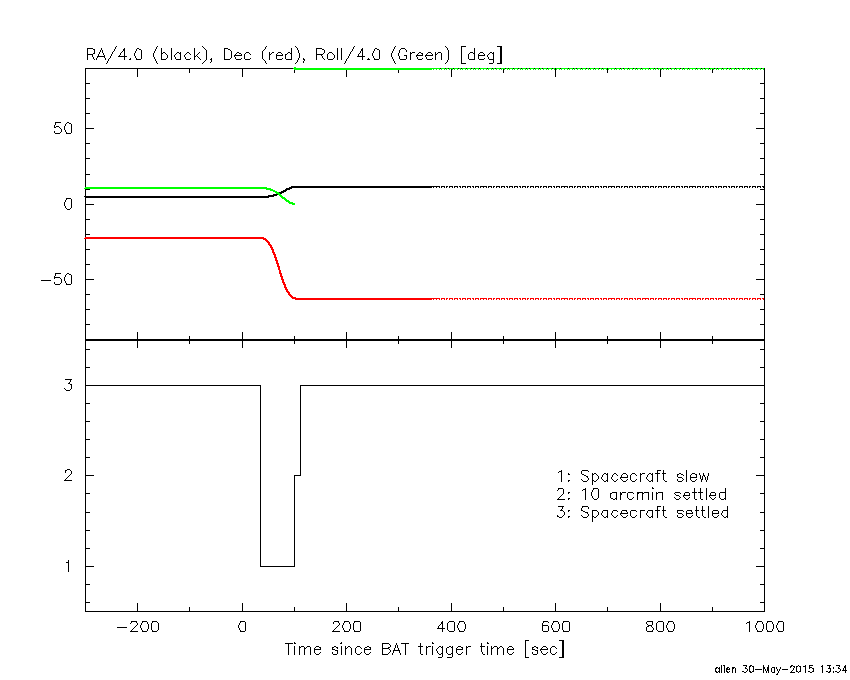
Spacecraft aspect plot
Bright source in the pre-burst/pre-slew/post-slew images
Pre-burst image of 15-350 keV band
Time interval of the image:
-239.600000 -3.808000

# RAcent  DECcent POSerr Theta    Phi  PeakCts   SNR AngSep     Name
#  [deg]    [deg]    ['] [deg]  [deg]                   [']
  1.9736 -13.6705    3.0  18.8  162.5   0.7354   3.8 ------	UNKNOWN
 76.3111 -40.6957    2.5  50.8   -7.4   2.0104   4.6 ------	UNKNOWN
343.2215  24.2206    3.7  58.4 -171.7   3.4881   3.2 ------	UNKNOWN
 61.7553  -4.2207    2.9  44.8  -60.1   3.5187   4.0 ------	UNKNOWN
Pre-slew background subtracted image of 15-350 keV band
Time interval of the image:
-3.808000 23.056000

# RAcent  DECcent POSerr Theta    Phi  PeakCts   SNR AngSep     Name
#  [deg]    [deg]    ['] [deg]  [deg]                   [']
 46.5638 -62.6615    0.9  44.2   30.1   1.7210  12.2 ------	UNKNOWN
Post-slew image of 15-350 keV band
Time interval of the image:
101.100600 962.440000

# RAcent  DECcent POSerr Theta    Phi  PeakCts   SNR AngSep     Name
#  [deg]    [deg]    ['] [deg]  [deg]                   [']
146.7266 -51.1453    4.7  50.1   37.3   6.2207   2.5 ------	UNKNOWN
314.2267 -48.9232    2.9  49.0  151.4   8.2156   4.0 ------	UNKNOWN
 77.2262 -68.1361    3.0  13.7   37.7   1.8460   3.8 ------	UNKNOWN
335.5403 -26.1383    2.7  58.3 -175.4  14.1860   4.3 ------	UNKNOWN
 15.0871 -32.4055    3.1  36.2 -137.5   3.0847   3.7 ------	UNKNOWN
 10.3239 -18.2869    4.6  50.9 -135.6   7.6398   2.5 ------	UNKNOWN