Analysis Summary
Notes:
- 1) No attempt has been made to eliminate the non-significant decimal places.
- 2) This batgrbproduct analysis is done using the HEASARC data.
- 3) This batgrbproduct analysis is using the flight position for the mask-weighting calculation.
======================================================================
                  BAT GRB EVENT DATA PROCESSING REPORT
    Process Script Ver: batgrbproduct v2.46
    Process Start Time: Sat Oct  4 22:29:45 EDT 2014
             Host Name: batevent1
   Current Working Dir: /local/data/batevent/batevent_reproc/trigger601051
======================================================================

  Trigger: 00601051      Segment: 000

  BAT Trigger Time: 423854024   [s; MET]
      Trigger Stop: 423854088   [s; MET]
               UTC: 2014-06-07T17:13:31.890280    [includes UTCF correction]
       Where From?: TDRSS position message

  BAT
    RA: 86.3799003443427   Dec: 18.9168424555503  [deg; J2000]

     Catalogged Source?: NO
     Point Source?:      YES
     GRB Indicated?:     YES    [ by BAT flight software ]
     Image S/N Ratio:    7.87
     Image Trigger?:     YES
     Rate S/N Ratio:     0  [ if not an image trigger ]
     Image S/N Ratio:    7.87

  Analysis Position:   [ source = BAT ]
    RA: 86.3799003443427   Dec: 18.9168424555503  [deg; J2000]

  Refined Position:   [ source = BAT pre-slew burst ]
    RA: 86.3755614903154   Dec: 18.9070197559353  [deg; J2000]
        { 05h 45m 30.1s , +18d 54' 25.3" }
         +/- 1.84791277423821 [arcmin] (estimated 90% radius based on SNR)
         +/- 0.981038155484248 [arcmin] (formal 1-sigma fit error)
    SNR: 12.6515825849365

  Angular difference between the analysis and refined position is 0.638749 arcmin

  Partial Coding Fraction: 0.1601562    [ including projection effects ]

  Duration
     T90: 94.7680000066757 +/- 16.2354456867897
        Measured from: -14.0879999995232
                   to: 80.6800000071526     [s; relative to TRIGTIME]
     T50: 47.0720000267029 +/- 16.521743206482
        Measured from: 12.6159999966621
                   to: 59.688000023365     [s; relative to TRIGTIME]


  Fluence
     Peak Flux  (peak 1 second)
        Measured from: 31.5799999833107
                   to: 32.5799999833107     [s; relative to TRIGTIME]
     Total Fluence
        Measured from: -17.8000000119209
                   to: 85.6560000181198     [s; relative to TRIGTIME]

             Band 1     Band 2     Band 3     Band 4
              15-25      25-50     50-100    100-350     keV
 Total     1.120728   1.347777   0.860667   0.333071
           0.147225   0.154312   0.136301   0.120418 [error]
 Peak      0.040697   0.048432   0.023391   0.026035
           0.014982   0.015305   0.013444   0.011507 [error]

     [ fluence units of on-axis counts / fully illuminated detector ]

======================================================================


====== Table of the duration information =============================

        Value   tstart    tstop
T100  103.456  -17.800   85.656
T90    94.768  -14.088   80.680
T50    47.072   12.616   59.688
Peak    1.000   31.580   32.580


====== Spectral Analysis Summary =====================================

Model      : spectral model: simple power-law (PL) and cutoff power-law (CPL)
Ph_index   : photon index: E^{Ph_index}
Ph_90err   : 90% error of the photon index
Epeak      : Epeak in keV
Epeak_90err: 90% error of Epeak
Norm       : normalization at 50 keV in both the PL model and CPL model
Nomr_90err : 90% error of the normalization
chi2       : Chi-Squared
dof        : degree of freedo

=== Time-averaged spectral analysis ===
(Best model with acceptable fit: N/A)

Model Ph_index Ph_90err_low Ph_90err_hi  Epeak  Epeak_90err_low  Epeak_90err_hi  Norm       Nomr_90err_low    Norm_90err_hi    chi2    dof
PL      -1.740    -0.234      0.226       -           -               -         2.20e-03     -3.15e-04          3.08e-04      73.250   57
CPL     -1.716    -0.996      0.783      514.469      N/A           N/A         2.27e-03        N/A               N/A         73.280   56


=== 1-s peak spectral analysis ===
(Best model with acceptable fit: PL)

Model Ph_index Ph_90err_low Ph_90err_hi  Epeak  Epeak_90err_low  Epeak_90err_hi  Norm       Nomr_90err_low    Norm_90err_hi    chi2    dof
PL      -2.045     -0.612     0.540       -           -               -         6.05e-03     -2.41e-03          2.31e-03      63.850   57
CPL     -1.635     -1.282     2.517       45.398      N/A           N/A         9.99e-03        N/A               N/A         63.740   56


=== Fluence/Peak Flux Summary ===

              Model    Band1     Band2     Band3     Band4     Band5     Total
                       15-25     25-50    50-100    100-350    15-150    15-350    keV
Fluence         PL   3.64e-07  5.79e-07  6.93e-07  1.62e-06  2.10e-06  3.26e-06   erg/cm2
      90%_error_low -6.99e-08 -7.30e-08 -1.33e-07 -5.59e-07 -3.09e-07 -7.01e-07   erg/cm2
      90%_error_hi   7.24e-08  7.30e-08  1.33e-07  7.27e-07  3.14e-07  8.33e-07   erg/cm2
Peak flux       PL   4.21e-01  3.08e-01  1.49e-01  1.02e-01  9.26e-01  9.80e-01   ph/cm2/s
      90%_error_low -2.16e-01 -1.18e-01 -7.08e-02 -6.89e-02 -3.63e-01 -3.69e-01   ph/cm2/s
      90%_error_hi   2.35e-01  1.16e-01  6.71e-02  1.00e-01  3.64e-01  3.70e-01   ph/cm2/s

Fluence        CPL   3.67e-07  5.79e-07  6.92e-07  1.62e-06  2.11e-06  3.27e-06   erg/cm2
      90%_error_low -7.63e-08    N/A    -1.42e-07    N/A    -2.88e-07 -1.28e-06   erg/cm2
      90%_error_hi   7.48e-08    N/A     1.45e-07    N/A     3.13e-07  4.00e-07   erg/cm2
Peak flux      CPL   4.01e-01  3.28e-01  1.60e-01  7.20e-02  9.32e-01  9.61e-01   ph/cm2/s
      90%_error_low -2.40e-01     N/A       N/A   -7.20e-02 -3.65e-01 -3.73e-01   ph/cm2/s
      90%_error_hi   2.33e-01     N/A       N/A    1.02e-01  3.65e-01  3.78e-01   ph/cm2/s

======================================================================
Image
Pre-slew 15.0-350.0 keV image (Event data)
#   RAcent    DECcent   POSerr    Theta     Phi              Peak Cts       SNR   Name
   86.3756    18.9070   0.0152    37.2664   -85.2184         4.1386695     12.652 TRIG_00601051

Foreground time interval of the image:
-17.800  85.656 (delta_t = 103.456 [sec])
Background time interval of the image:
-239.000 -17.800 (delta_t = 221.200 [sec])
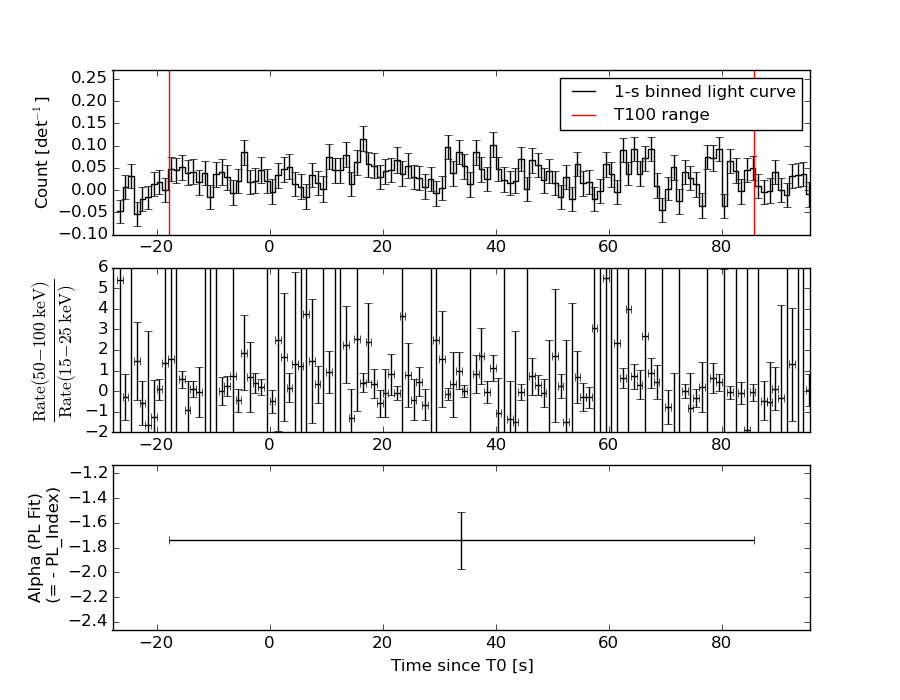
Light Curves
Note: The mask-weighted lightcurves have units of either count/det or counts/sec/det, where a det is 0.4 x 0.4 = 0.16 sq cm.
Full-time range; 1 s binning
Other quick-look light curves:
- 64 ms binning (zoomed)
- 16 ms binning (zoomed)
- 8 ms binning (zoomed)
- 2 ms binning (zoomed)
- SN=5 or 10 s binning (full-time range)
- Raw light curve
Spectra
- 64 ms binning (zoomed)
- 16 ms binning (zoomed)
- 8 ms binning (zoomed)
- 2 ms binning (zoomed)
- SN=5 or 10 s binning (full-time range)
- Raw light curve
Spectra
Notes:
- 1) The fitting includes the systematic errors.
- 2) When the burst includes telescope slew time periods, the fitting uses an average response file made from multiple 5-s response files through out the slew time plus single time preiod for the non-slew times, and weighted by the total counts in the corresponding time period using addrmf. An average response file is needed becuase a spectral fit using the pre-slew DRM will introduce some errors in both a spectral shape and a normalization if the PHA file contains a lot of the slew/post-slew time interval.
- 3) For fits to more complicated models (e.g. a power-law over a cutoff power-law), the BAT team has decided to require a chi-square improvement of more than 6 for each extra dof.
Time averaged spectrum fit using the average DRM
Power-law model
Time interval is from  -17.800 sec. to   85.656 sec.

Spectral model in power-law:
------------------------------------------------------------
Parameters  : value       lower 90%   higher 90%
Photon index: -1.73961     ( -0.233726   0.225637 )
Norm@50keV  : 2.20125E-03    ( -0.000315447   0.000308157 )
------------------------------------------------------------
#Fit statistic : Chi-Squared =          73.25 using 59 PHA bins.
# Reduced chi-squared =          1.285 for     57 degrees of freedom
# Null hypothesis probability =   7.232391e-02

Photon flux (15-150 keV)    in 103.5 sec: 0.296528 ( -0.037616  0.037647 ) ph/cm2/s
Energy fluence (15-150 keV)             : 2.10388e-06 ( -3.09388e-07  3.1437e-07 ) ergs/cm2
Cutoff power-law model
Time interval is from  -17.800 sec. to   85.656 sec.
Spectral model in the cutoff power-law:
------------------------------------------------------------
Parameters  : value       lower 90%   higher 90%
Photon index: -1.71607     ( -0.988891   0.789902 )
Epeak [keV] : 514.469      (   )
Norm@50keV  : 2.26811E-03    (     )
------------------------------------------------------------
#Fit statistic : Chi-Squared =          73.27 using 59 PHA bins.
# Reduced chi-squared =          1.308 for     56 degrees of freedom
# Null hypothesis probability =   6.051213e-02

Photon flux (15-150 keV)    in 103.5 sec: 0.296877 ( -0.038425  0.037713 ) ph/cm2/s
Energy fluence (15-150 keV)             : 2.10868e-06 ( -2.87928e-07  3.12966e-07 ) ergs/cm2
1-s peak spectrum fit
Power-law model
Time interval is from   31.580 sec. to   32.580 sec.

Spectral model in power-law:
------------------------------------------------------------
Parameters  : value       lower 90%   higher 90%
Photon index: -2.04481     ( -0.612332   0.540118 )
Norm@50keV  : 6.04676E-03    ( -0.00241473   0.0023145 )
------------------------------------------------------------
#Fit statistic : Chi-Squared =          63.85 using 59 PHA bins.
# Reduced chi-squared =          1.120 for     57 degrees of freedom
# Null hypothesis probability =   2.484648e-01

Photon flux (15-150 keV)    in 1 sec: 0.926289 ( -0.363339  0.363581 ) ph/cm2/s
Energy fluence (15-150 keV)             : 5.59294e-08 ( -2.10716e-08  2.10545e-08 ) ergs/cm2
Cutoff power-law model
Time interval is from   31.580 sec. to   32.580 sec.
Spectral model in the cutoff power-law:
------------------------------------------------------------
Parameters  : value       lower 90%   higher 90%
Photon index: -1.63483     ( -1.2818   2.51734 )
Epeak [keV] : 45.3985      (   )
Norm@50keV  : 9.98984E-03    (     )
------------------------------------------------------------
#Fit statistic : Chi-Squared =          63.74 using 59 PHA bins.
# Reduced chi-squared =          1.138 for     56 degrees of freedom
# Null hypothesis probability =   2.228678e-01

Photon flux (15-150 keV)    in 1 sec: 0.932416 ( -0.364906  0.365284 ) ph/cm2/s
Energy fluence (15-150 keV)             : 0 ( 0  0 ) ergs/cm2
Time-resolved spectra
Distribution
T90 vs. Hardness ratio plot
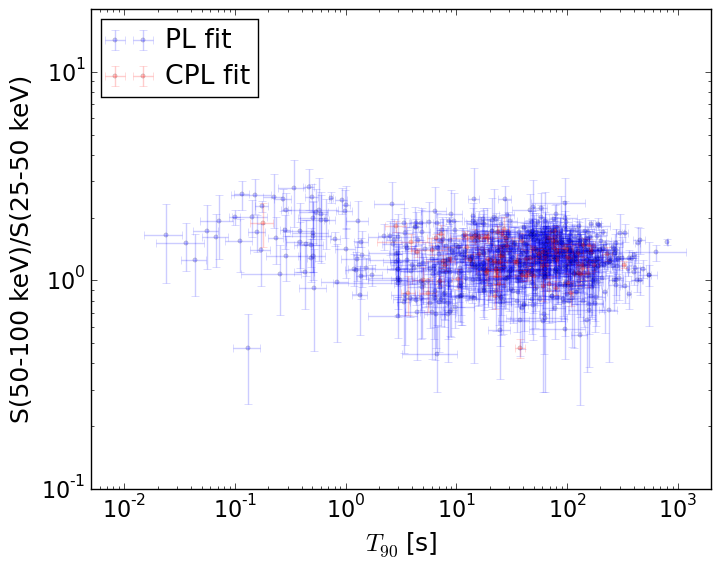
T90                                   = N/A sec.
Hardness ratio (energy fluence ratio) = N/A
S(15-50 keV) vs. S(50-150 keV) plot
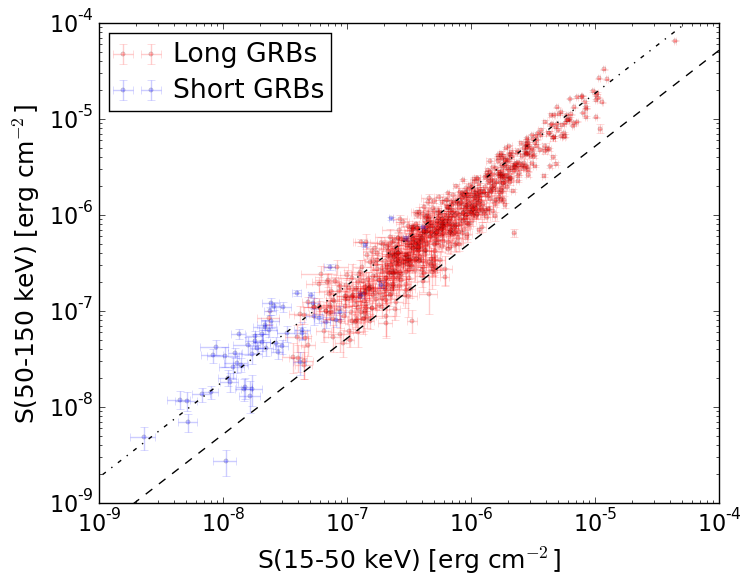
S(15-50 keV)  = N/A
S(50-150 keV) = N/A
The dash-dotted line and the dashed line traces the fluences calculated from the Band function with Epeak = 15 and 150 keV, respectively. Both lines assume a canonical values of alpha = -1 and beta = -2.5.
Mask shadow pattern
IMX = 6.342461359351292E-02, IMY = 7.582216673749773E-01
Spacecraft aspect plot
Bright source in the pre-burst/pre-slew/post-slew images
Pre-burst image of 15-350 keV band
Time interval of the image:
-239.000000 -17.800000

# RAcent  DECcent POSerr Theta    Phi  PeakCts   SNR AngSep     Name
#  [deg]    [deg]    ['] [deg]  [deg]                   [']
135.5116 -40.5820    2.9  39.9  120.2   2.6803   4.0    1.8	Vela X-1
106.2971 -53.3262    2.5  49.0  151.4   3.7221   4.7 ------	UNKNOWN
 76.1788 -50.0803    2.3  55.9  173.6   5.9887   4.9 ------	UNKNOWN
129.3093  52.6510    2.7  58.8  -26.0   5.7659   4.3 ------	UNKNOWN
Pre-slew background subtracted image of 15-350 keV band
Time interval of the image:
-17.800000 85.656000

# RAcent  DECcent POSerr Theta    Phi  PeakCts   SNR AngSep     Name
#  [deg]    [deg]    ['] [deg]  [deg]                   [']
135.5006 -40.6800    4.4  40.0  120.3  -1.1724  -2.6    7.6	Vela X-1
124.7505 -31.8752    2.7  28.3  127.3   0.7470   4.2 ------	UNKNOWN
 86.3756  18.9070    0.9  37.3  -85.2   4.1414  12.7 ------	UNKNOWN
Post-slew image of 15-350 keV band
Time interval of the image:
341.700600 917.600590

# RAcent  DECcent POSerr Theta    Phi  PeakCts   SNR AngSep     Name
#  [deg]    [deg]    ['] [deg]  [deg]                   [']
254.5469  35.2390    7.9  35.8   14.4  -0.7912  -1.5    7.6	Her X-1
197.5679 -18.1973    2.4  46.4  152.8   5.6705   4.9 ------	UNKNOWN
277.4616  45.7238    3.2  53.8    0.8   4.6113   3.5 ------	UNKNOWN
280.0361  51.0117    3.4  55.5   -5.6   4.3165   3.4 ------	UNKNOWN
286.5975  60.8534    3.9  59.6  -17.1   8.1023   3.0 ------	UNKNOWN
160.7685  -2.1915    5.2  58.7 -159.2   7.4794   2.2 ------	UNKNOWN
166.9836  13.5446    3.2  46.0 -145.0   3.5261   3.7 ------	UNKNOWN
165.7098  19.1814    3.7  45.3 -137.0   3.3366   3.1 ------	UNKNOWN