Analysis Summary
Notes:
- 1) No attempt has been made to eliminate the non-significant decimal places.
- 2) This batgrbproduct analysis is done using the HEASARC data.
- 3) This batgrbproduct analysis is using the flight position for the mask-weighting calculation.
======================================================================
BAT GRB EVENT DATA PROCESSING REPORT
Process Script Ver: batgrbproduct v2.46
Process Start Time: Wed Nov 19 23:06:53 EST 2014
Host Name: bat1
Current Working Dir: /local/data/bat1/alien/Swift_3rdBATcatalog/event/batevent_reproc/trigger616502
======================================================================
Trigger: 00616502 Segment: 000
BAT Trigger Time: 435983824 [s; MET]
Trigger Stop: 435983888 [s; MET]
UTC: 2014-10-26T02:36:51.296880 [includes UTCF correction]
Where From?: TDRSS position message
BAT
RA: 44.0804525026473 Dec: 26.9599053858768 [deg; J2000]
Catalogged Source?: NO
Point Source?: YES
GRB Indicated?: YES [ by BAT flight software ]
Image S/N Ratio: 11
Image Trigger?: YES
Rate S/N Ratio: 0 [ if not an image trigger ]
Image S/N Ratio: 11
Analysis Position: [ source = BAT ]
RA: 44.0804525026473 Dec: 26.9599053858768 [deg; J2000]
Refined Position: [ source = BAT pre-slew burst ]
RA: 44.0490065807522 Dec: 26.9251941472626 [deg; J2000]
{ 02h 56m 11.8s , +26d 55' 30.7" }
+/- 1.86368916202356 [arcmin] (estimated 90% radius based on SNR)
+/- 0.733732141123246 [arcmin] (formal 1-sigma fit error)
SNR: 12.4988642699834
Angular difference between the analysis and refined position is 2.677042 arcmin
Partial Coding Fraction: 0.8828125 [ including projection effects ]
Duration
T90: 139.475999951363 +/- 14.8381213498224
Measured from: 21.7400000095367
to: 161.215999960899 [s; relative to TRIGTIME]
T50: 72.7679999470711 +/- 12.4589060727686
Measured from: 55.5199999809265
to: 128.287999927998 [s; relative to TRIGTIME]
Fluence
Peak Flux (peak 1 second)
Measured from: 65.6399999856949
to: 66.6399999856949 [s; relative to TRIGTIME]
Total Fluence
Measured from: 13.9559999704361
to: 180.89200001955 [s; relative to TRIGTIME]
Band 1 Band 2 Band 3 Band 4
15-25 25-50 50-100 100-350 keV
Total 1.307293 1.054742 0.391654 0.208802
0.075008 0.076729 0.065638 0.056640 [error]
Peak 0.023157 0.007280 0.014637 0.005430
0.006167 0.006204 0.005165 0.004561 [error]
[ fluence units of on-axis counts / fully illuminated detector ]
======================================================================
====== Table of the duration information =============================
Value tstart tstop
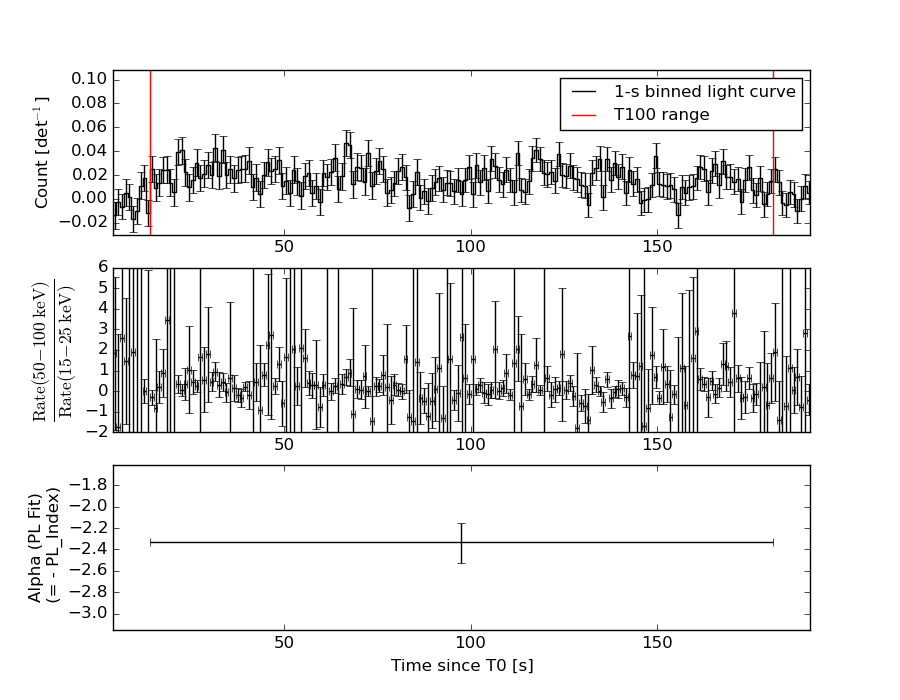
T100 166.936 13.956 180.892
T90 139.476 21.740 161.216
T50 72.768 55.520 128.288
Peak 1.000 65.640 66.640
====== Spectral Analysis Summary =====================================
Model : spectral model: simple power-law (PL) and cutoff power-law (CPL)
Ph_index : photon index: E^{Ph_index}
Ph_90err : 90% error of the photon index
Epeak : Epeak in keV
Epeak_90err: 90% error of Epeak
Norm : normalization at 50 keV in both the PL model and CPL model
Nomr_90err : 90% error of the normalization
chi2 : Chi-Squared
dof : degree of freedo
=== Time-averaged spectral analysis ===
(Best model with acceptable fit: PL)
Model Ph_index Ph_90err_low Ph_90err_hi Epeak Epeak_90err_low Epeak_90err_hi Norm Nomr_90err_low Norm_90err_hi chi2 dof
PL -2.331 -0.193 0.182 - - - 8.07e-04 -1.04e-04 1.02e-04 62.020 57
CPL -1.992 1.992 1.992 0.923 -0.361 1.475 1.29e-03 -2.41e-04 2.69e-04 63.300 56
=== 1-s peak spectral analysis ===
(Best model with acceptable fit: N/A)
Model Ph_index Ph_90err_low Ph_90err_hi Epeak Epeak_90err_low Epeak_90err_hi Norm Nomr_90err_low Norm_90err_hi chi2 dof
PL -1.243 -0.827 1.082 - - - 3.03e-03 -1.11e-03 1.11e-03 50.880 57
CPL -1.307 -2.239 1.200 9999.360 N/A N/A 3.04e-03 N/A N/A 50.910 56
=== Fluence/Peak Flux Summary ===
Model Band1 Band2 Band3 Band4 Band5 Total
15-25 25-50 50-100 100-350 15-150 15-350 keV
Fluence PL 3.78e-07 4.20e-07 3.34e-07 4.40e-07 1.29e-06 1.57e-06 erg/cm2
90%_error_low -4.26e-08 -3.70e-08 -5.87e-08 -1.34e-07 -1.30e-07 -2.12e-07 erg/cm2
90%_error_hi 4.35e-08 3.66e-08 6.14e-08 1.72e-07 1.34e-07 2.40e-07 erg/cm2
Peak flux PL 9.75e-02 1.14e-01 9.68e-02 1.39e-01 3.58e-01 4.47e-01 ph/cm2/s
90%_error_low -9.75e-02 -6.42e-02 -4.68e-02 -1.03e-01 -3.58e-01 -1.69e-01 ph/cm2/s
90%_error_hi 8.84e-02 5.01e-02 4.22e-02 2.84e-01 1.38e-01 1.97e-01 ph/cm2/s
Fluence CPL 3.66e-07 4.27e-07 2.99e-07 6.32e-08 1.24e-06 1.37e-06 erg/cm2
90%_error_low -3.94e-08 -2.94e-08 -4.46e-08 4.81e-08 -1.31e-07 -2.17e-07 erg/cm2
90%_error_hi 4.06e-08 4.50e-08 9.45e-08 4.12e-07 1.61e-07 2.64e-07 erg/cm2
Peak flux CPL 9.86e-02 1.15e-01 9.63e-02 1.36e-01 3.59e-01 4.55e-01 ph/cm2/s
90%_error_low N/A -6.45e-02 -4.65e-02 N/A -1.40e-01 -1.82e-01 ph/cm2/s
90%_error_hi N/A 4.98e-02 4.27e-02 N/A 1.38e-01 1.94e-01 ph/cm2/s
======================================================================
Image
Pre-slew 15.0-350.0 keV image (Event data)
#   RAcent    DECcent   POSerr    Theta     Phi              Peak Cts       SNR   Name
   44.0490    26.9252   0.0154    15.7411   128.8679         1.2234431     12.499 TRIG_00616502

Foreground time interval of the image:
 13.956  73.501 (delta_t =  59.545 [sec])
Background time interval of the image:
-239.000  13.956 (delta_t = 252.956 [sec])
Light Curves
Note: The mask-weighted lightcurves have units of either count/det or counts/sec/det, where a det is 0.4 x 0.4 = 0.16 sq cm.
Full-time range; 1 s binning
Other quick-look light curves:
- 64 ms binning (zoomed)
- 16 ms binning (zoomed)
- 8 ms binning (zoomed)
- 2 ms binning (zoomed)
- SN=5 or 10 s binning (full-time range)
- Raw light curve
Spectra
- 64 ms binning (zoomed)
- 16 ms binning (zoomed)
- 8 ms binning (zoomed)
- 2 ms binning (zoomed)
- SN=5 or 10 s binning (full-time range)
- Raw light curve
Spectra
Notes:
- 1) The fitting includes the systematic errors.
- 2) When the burst includes telescope slew time periods, the fitting uses an average response file made from multiple 5-s response files through out the slew time plus single time preiod for the non-slew times, and weighted by the total counts in the corresponding time period using addrmf. An average response file is needed becuase a spectral fit using the pre-slew DRM will introduce some errors in both a spectral shape and a normalization if the PHA file contains a lot of the slew/post-slew time interval.
- 3) For fits to more complicated models (e.g. a power-law over a cutoff power-law), the BAT team has decided to require a chi-square improvement of more than 6 for each extra dof.
Time averaged spectrum fit using the average DRM
Power-law model
Time interval is from   13.956 sec. to  180.892 sec.

Spectral model in power-law:
------------------------------------------------------------
Parameters  : value       lower 90%   higher 90%
Photon index: -2.33101     ( -0.192527   0.181645 )
Norm@50keV  : 8.06691E-04    ( -0.000104014   0.000102215 )
------------------------------------------------------------
#Fit statistic : Chi-Squared =          62.02 using 59 PHA bins.
# Reduced chi-squared =          1.088 for     57 degrees of freedom
# Null hypothesis probability =   3.018389e-01

Photon flux (15-150 keV)    in 166.9 sec: 0.143466 ( -0.011754  0.011758 ) ph/cm2/s
Energy fluence (15-150 keV)             : 1.29451e-06 ( -1.30451e-07  1.34073e-07 ) ergs/cm2
Cutoff power-law model

Time interval is from   13.956 sec. to  180.892 sec.
Spectral model in the cutoff power-law:
------------------------------------------------------------
Parameters  : value       lower 90%   higher 90%
Photon index: -1.99196     ( 1.99196   1.99196 )
Epeak [keV] : 0.922985      ( -0.361087 1.47496 )
Norm@50keV  : 1.28516E-03    ( -0.000240734   0.000269017 )
------------------------------------------------------------
#Fit statistic : Chi-Squared =          63.30 using 59 PHA bins.
# Reduced chi-squared =          1.130 for     56 degrees of freedom
# Null hypothesis probability =   2.344792e-01

Photon flux (15-150 keV)    in 166.9 sec: 0.141335 ( -0.011971  0.011087 ) ph/cm2/s
Energy fluence (15-150 keV)             : 1.2393e-06 ( -1.30823e-07  1.60921e-07 ) ergs/cm2
1-s peak spectrum fit
Power-law model
Time interval is from   65.640 sec. to   66.640 sec.

Spectral model in power-law:
------------------------------------------------------------
Parameters  : value       lower 90%   higher 90%
Photon index: -1.24339     ( -0.82823   1.08134 )
Norm@50keV  : 3.03213E-03    ( -0.00110554   0.00110553 )
------------------------------------------------------------
#Fit statistic : Chi-Squared =          50.88 using 59 PHA bins.
# Reduced chi-squared =         0.8926 for     57 degrees of freedom
# Null hypothesis probability =   7.026515e-01

Photon flux (15-150 keV)    in 1 sec: 0.358137 ( -0.358137  0.13841 ) ph/cm2/s
Energy fluence (15-150 keV)             : 3.04166e-08 ( -1.27175e-08  1.30334e-08 ) ergs/cm2
Cutoff power-law model

Time interval is from   65.640 sec. to   66.640 sec.
Spectral model in the cutoff power-law:
------------------------------------------------------------
Parameters  : value       lower 90%   higher 90%
Photon index: -2.08324     ( -1.46294   1.97567 )
Epeak [keV] : 31.1796      (   )
Norm@50keV  : 1.17099E-03    (     )
------------------------------------------------------------
#Fit statistic : Chi-Squared =          50.56 using 59 PHA bins.
# Reduced chi-squared =         0.9029 for     56 degrees of freedom
# Null hypothesis probability =   6.801565e-01

Photon flux (15-150 keV)    in 1 sec: 0.358639 ( -0.14005  0.137885 ) ph/cm2/s
Energy fluence (15-150 keV)             : 3.02489e-08 ( 0  0 ) ergs/cm2
Time-resolved spectra
Distribution
T90 vs. Hardness ratio plot
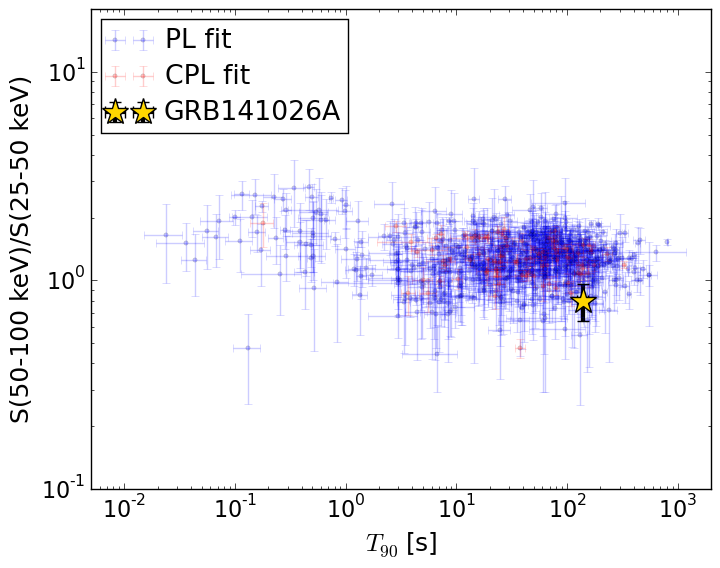
T90                                   = 139.476 sec.
Hardness ratio (energy fluence ratio) = 0.795005171463
S(15-50 keV) vs. S(50-150 keV) plot
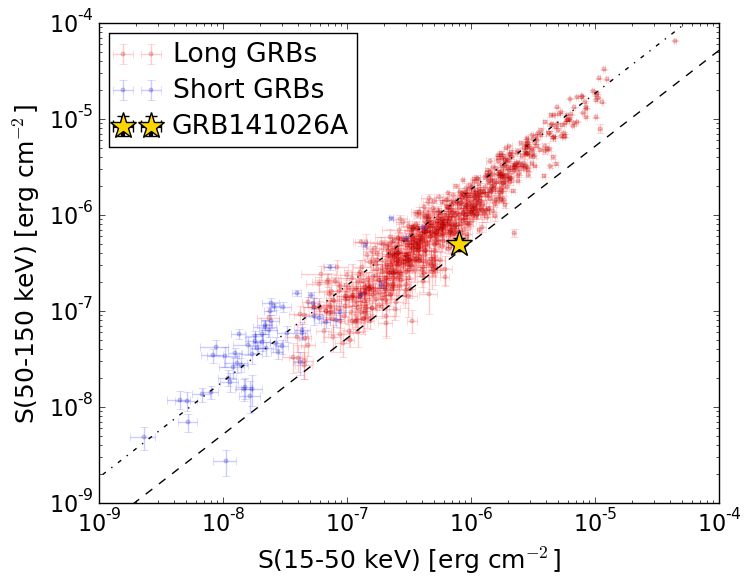
S(15-50 keV)  = 7.977943e-07
S(50-150 keV) = 4.967345e-07
The dash-dotted line and the dashed line traces the fluences calculated from the Band function with Epeak = 15 and 150 keV, respectively. Both lines assume a canonical values of alpha = -1 and beta = -2.5.
Mask shadow pattern
IMX = -1.768756455081310E-01, IMY = -2.194556478470043E-01
Spacecraft aspect plot
Bright source in the pre-burst/pre-slew/post-slew images
Pre-burst image of 15-350 keV band
Time interval of the image:
-239.000000 13.956000

# RAcent  DECcent POSerr Theta    Phi  PeakCts   SNR AngSep     Name
#  [deg]    [deg]    ['] [deg]  [deg]                   [']
 83.6244  22.0246    0.3  29.2 -126.5  10.5825  36.5    0.8	Crab
 12.7527  21.0362    2.2  39.8   89.3   5.1635   5.2 ------	UNKNOWN
 71.2178  65.7906    2.5  52.9  172.2   3.5691   4.6 ------	UNKNOWN
 84.7049 -18.8240    2.9  44.8  -59.9   3.8004   4.0 ------	UNKNOWN
 86.1607 -15.6261    3.1  43.6  -64.6   3.6974   3.7 ------	UNKNOWN
Pre-slew background subtracted image of 15-350 keV band
Time interval of the image:
13.956000 73.500590

# RAcent  DECcent POSerr Theta    Phi  PeakCts   SNR AngSep     Name
#  [deg]    [deg]    ['] [deg]  [deg]                   [']
 83.6603  22.1592   18.0  29.2 -126.7   0.0763   0.6    8.8	Crab
 44.0490  26.9252    0.9  15.7  128.9   1.2235  12.5 ------	UNKNOWN
 68.5836  60.6922    2.0  47.7  173.0   1.1244   5.6 ------	UNKNOWN
Post-slew image of 15-350 keV band
Time interval of the image:
143.500620 209.700600

# RAcent  DECcent POSerr Theta    Phi  PeakCts   SNR AngSep     Name
#  [deg]    [deg]    ['] [deg]  [deg]                   [']
 83.6558  22.0241    0.6  36.2  -44.8   2.5262  18.2    1.4	Crab
 55.6597   8.3687    2.7  21.6   13.6   0.3945   4.2 ------	UNKNOWN
 44.0727  26.8854    2.0   0.1   76.4   0.5237   5.7 ------	UNKNOWN
 51.4491  22.9167    2.7   7.8  -14.1   0.3738   4.3 ------	UNKNOWN
 53.4008  23.3313    3.0   9.1  -22.5   0.3298   3.8 ------	UNKNOWN
 69.0913  10.4814    2.4  28.7  -13.6   0.4742   4.9 ------	UNKNOWN
356.5166  57.6945    2.8  45.2 -167.6   0.6547   4.0 ------	UNKNOWN
 90.7826   4.3440    2.5  49.9  -25.3   0.9168   4.6 ------	UNKNOWN