Analysis Summary
Notes:
- 1) No attempt has been made to eliminate the non-significant decimal places.
- 2) This batgrbproduct analysis is done using the HEASARC data.
- 3) This batgrbproduct analysis is using the flight position for the mask-weighting calculation.
======================================================================
                  BAT GRB EVENT DATA PROCESSING REPORT
    Process Script Ver: batgrbproduct v2.46
    Process Start Time: Mon Apr  6 02:52:18 EDT 2015
             Host Name: bat1
   Current Working Dir: /local/data/bat1/alien/Swift_3rdBATcatalog/event/batevent_reproc/trigger634200
======================================================================

  Trigger: 00634200      Segment: 000

  BAT Trigger Time: 447635000   [s; MET]
      Trigger Stop: 447635064   [s; MET]
               UTC: 2015-03-09T23:03:06.711860    [includes UTCF correction]
       Where From?: TDRSS position message

  BAT
    RA: 276.987461493266   Dec: 86.4295417431885  [deg; J2000]

     Catalogged Source?: NO
     Point Source?:      YES
     GRB Indicated?:     YES    [ by BAT flight software ]
     Image S/N Ratio:    13
     Image Trigger?:     YES
     Rate S/N Ratio:     0  [ if not an image trigger ]
     Image S/N Ratio:    13

  Analysis Position:   [ source = BAT ]
    RA: 276.987461493266   Dec: 86.4295417431885  [deg; J2000]

  Refined Position:   [ source = BAT pre-slew burst ]
    RA: 277.035068605504   Dec: 86.4162161973437  [deg; J2000]
        { 18h 28m 08.4s , +86d 24' 58.4" }
         +/- 1.85618360051024 [arcmin] (estimated 90% radius based on SNR)
         +/- 0.763158473122185 [arcmin] (formal 1-sigma fit error)
    SNR: 12.5711263772369

  Angular difference between the analysis and refined position is 0.819155 arcmin

  Partial Coding Fraction: 0.5078125    [ including projection effects ]

  Duration
     T90: 242.039999961853 +/- 5.99635618772369
        Measured from: -191.824000000954
                   to: 50.2159999608994     [s; relative to TRIGTIME]
     T50: 24.3919999599457 +/- 2.81560225689203
        Measured from: -182.027999997139
                   to: -157.636000037193     [s; relative to TRIGTIME]


  Fluence
     Peak Flux  (peak 1 second)
        Measured from: -177.487999975681
                   to: -176.487999975681     [s; relative to TRIGTIME]
     Total Fluence
        Measured from: -197.319999992847
                   to: 119.072000026703     [s; relative to TRIGTIME]

             Band 1     Band 2     Band 3     Band 4
              15-25      25-50     50-100    100-350     keV
 Total     6.077417   9.711227   8.258834   2.060654
           0.130346   0.138981   0.125832   0.114002 [error]
 Peak      0.198936   0.399553   0.398581   0.131350
           0.010612   0.013224   0.013757   0.010143 [error]

     [ fluence units of on-axis counts / fully illuminated detector ]

======================================================================


====== Table of the duration information =============================

        Value   tstart    tstop
T100  316.392 -197.320  119.072
T90   242.040 -191.824   50.216
T50    24.392 -182.028 -157.636
Peak    1.000 -177.488 -176.488


====== Spectral Analysis Summary =====================================

Model      : spectral model: simple power-law (PL) and cutoff power-law (CPL)
Ph_index   : photon index: E^{Ph_index}
Ph_90err   : 90% error of the photon index
Epeak      : Epeak in keV
Epeak_90err: 90% error of Epeak
Norm       : normalization at 50 keV in both the PL model and CPL model
Nomr_90err : 90% error of the normalization
chi2       : Chi-Squared
dof        : degree of freedo

=== Time-averaged spectral analysis ===
(Best model with acceptable fit: CPL)

Model Ph_index Ph_90err_low Ph_90err_hi  Epeak  Epeak_90err_low  Epeak_90err_hi  Norm       Nomr_90err_low    Norm_90err_hi    chi2    dof
PL      -1.398    -0.037      0.037       -           -               -         5.81e-03     -1.14e-04          1.13e-04      53.420   57
CPL     -1.047    -0.155      0.160      156.263     -31.216        74.715      8.26e-03     -1.16e-03          1.40e-03      37.850   56


=== 1-s peak spectral analysis ===
(Best model with acceptable fit: PL)

Model Ph_index Ph_90err_low Ph_90err_hi  Epeak  Epeak_90err_low  Epeak_90err_hi  Norm       Nomr_90err_low    Norm_90err_hi    chi2    dof
PL      -1.067     -0.063     0.064       -           -               -         8.08e-02     -2.96e-03          2.96e-03      51.190   57
CPL     -0.764     -0.247     0.262      233.004     -81.632       653.852      1.11e-01     -2.44e-02          3.33e-02      46.730   56


=== Fluence/Peak Flux Summary ===

              Model    Band1     Band2     Band3     Band4     Band5     Total
                       15-25     25-50    50-100    100-350    15-150    15-350    keV
Fluence         PL   2.13e-06  4.17e-06  6.33e-06  2.09e-05  1.78e-05  3.35e-05   erg/cm2
      90%_error_low -8.84e-08 -1.01e-07 -1.41e-07 -1.08e-06 -3.55e-07 -1.14e-06   erg/cm2
      90%_error_hi   9.00e-08  1.01e-07  1.41e-07  1.12e-06  3.55e-07  1.17e-06   erg/cm2
Peak flux       PL   2.20e+00  2.87e+00  2.74e+00  4.63e+00  9.35e+00  1.24e+01   ph/cm2/s
      90%_error_low -1.60e-01 -1.29e-01 -1.11e-01 -3.93e-01 -3.51e-01 -4.93e-01   ph/cm2/s
      90%_error_hi   1.65e-01  1.28e-01  1.11e-01  4.15e-01  3.52e-01  4.98e-01   ph/cm2/s

Fluence        CPL   1.93e-06  4.23e-06  6.53e-06  1.37e-05  1.74e-05  2.64e-05   erg/cm2
      90%_error_low -1.18e-07 -1.07e-07 -1.67e-07 -2.17e-06 -3.91e-07 -2.19e-06   erg/cm2
      90%_error_hi   1.20e-07  1.07e-07  1.68e-07  2.68e-06  3.90e-07  2.68e-06   erg/cm2
Peak flux      CPL   2.04e+00  2.92e+00  2.84e+00  3.42e+00  9.24e+00  1.12e+01   ph/cm2/s
      90%_error_low -2.02e-01 -1.38e-01 -1.39e-01 -7.27e-01 -3.61e-01 -8.15e-01   ph/cm2/s
      90%_error_hi   2.07e-01  1.39e-01  1.40e-01  9.70e-01  3.62e-01  1.01e+00   ph/cm2/s

======================================================================
Image
Pre-slew 15.0-350.0 keV image (Event data)
#   RAcent    DECcent   POSerr    Theta     Phi              Peak Cts       SNR   Name
  277.0351    86.4162   0.0153    25.9260    68.0069         2.6537059     12.571 TRIG_00634200

Foreground time interval of the image:
-96.899  73.901 (delta_t = 170.800 [sec])
Background time interval of the image:
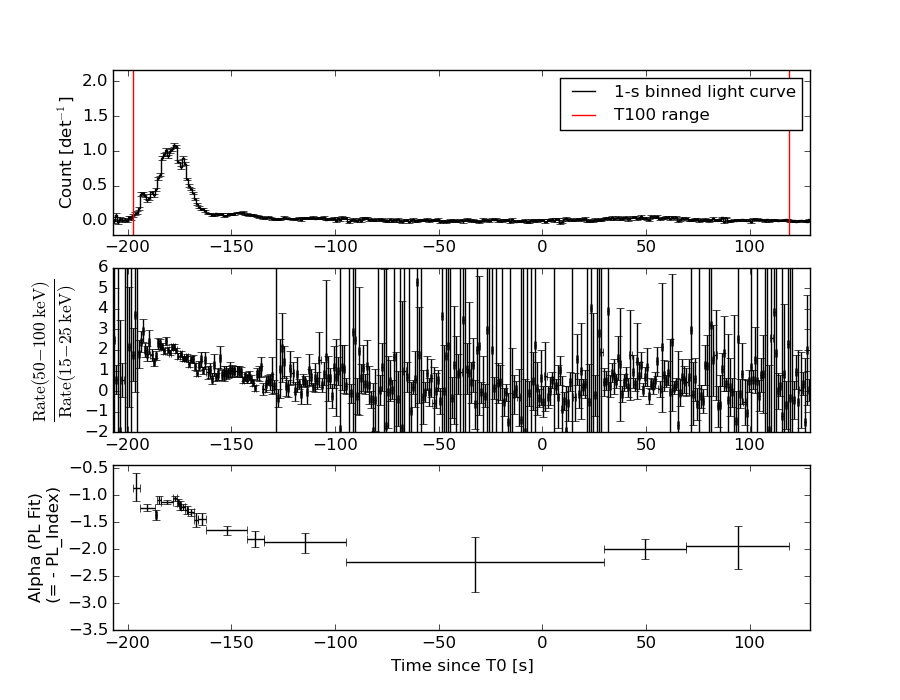
Light Curves
Note: The mask-weighted lightcurves have units of either count/det or counts/sec/det, where a det is 0.4 x 0.4 = 0.16 sq cm.
Full-time range; 1 s binning
Other quick-look light curves:
Spectra
Notes:
- 1) The fitting includes the systematic errors.
- 2) When the burst includes telescope slew time periods, the fitting uses an average response file made from multiple 5-s response files through out the slew time plus single time preiod for the non-slew times, and weighted by the total counts in the corresponding time period using addrmf. An average response file is needed becuase a spectral fit using the pre-slew DRM will introduce some errors in both a spectral shape and a normalization if the PHA file contains a lot of the slew/post-slew time interval.
- 3) For fits to more complicated models (e.g. a power-law over a cutoff power-law), the BAT team has decided to require a chi-square improvement of more than 6 for each extra dof.
Time averaged spectrum fit using the average DRM
Power-law model
Time interval is from -197.320 sec. to  119.072 sec.

Spectral model in power-law:
------------------------------------------------------------
Parameters  : value       lower 90%   higher 90%
Photon index: -1.39799     ( -0.0368498   0.0369264 )
Norm@50keV  : 5.80646E-03    ( -0.000113539   0.0001135 )
------------------------------------------------------------
#Fit statistic : Chi-Squared =          53.42 using 59 PHA bins.
# Reduced chi-squared =         0.9372 for     57 degrees of freedom
# Null hypothesis probability =   6.101241e-01

Photon flux (15-150 keV)    in 316.4 sec: 0.706808 ( -0.015701  0.015753 ) ph/cm2/s
Energy fluence (15-150 keV)             : 1.77614e-05 ( -3.55067e-07  3.55222e-07 ) ergs/cm2
Cutoff power-law model
Time interval is from -197.320 sec. to  119.072 sec.
Spectral model in the cutoff power-law:
------------------------------------------------------------
Parameters  : value       lower 90%   higher 90%
Photon index: -1.04668     ( -0.154688   0.160069 )
Epeak [keV] : 156.263      ( -31.216 74.7154 )
Norm@50keV  : 8.25609E-03    ( -0.00115828   0.00139512 )
------------------------------------------------------------
#Fit statistic : Chi-Squared =          37.85 using 59 PHA bins.
# Reduced chi-squared =         0.6758 for     56 degrees of freedom
# Null hypothesis probability =   9.700394e-01

Photon flux (15-150 keV)    in 316.4 sec: 0.687464 ( -0.017508  0.0176 ) ph/cm2/s
Energy fluence (15-150 keV)             : 1.73935e-05 ( -3.91235e-07  3.9039e-07 ) ergs/cm2
1-s peak spectrum fit
Power-law model
Time interval is from -177.488 sec. to -176.488 sec.

Spectral model in power-law:
------------------------------------------------------------
Parameters  : value       lower 90%   higher 90%
Photon index: -1.06726     ( -0.0633837   0.0637116 )
Norm@50keV  : 8.08216E-02    ( -0.00296425   0.00296293 )
------------------------------------------------------------
#Fit statistic : Chi-Squared =          51.19 using 59 PHA bins.
# Reduced chi-squared =         0.8981 for     57 degrees of freedom
# Null hypothesis probability =   6.917653e-01

Photon flux (15-150 keV)    in 1 sec: 9.34728 ( -0.3513  0.35155 ) ph/cm2/s
Energy fluence (15-150 keV)             : 8.54142e-07 ( -3.43192e-08  3.44042e-08 ) ergs/cm2
Cutoff power-law model
Time interval is from -177.488 sec. to -176.488 sec.
Spectral model in the cutoff power-law:
------------------------------------------------------------
Parameters  : value       lower 90%   higher 90%
Photon index: -0.76358     ( -0.247161   0.26185 )
Epeak [keV] : 233.004      ( -81.6318 653.852 )
Norm@50keV  : 0.110688    ( -0.0244401   0.0332767 )
------------------------------------------------------------
#Fit statistic : Chi-Squared =          46.73 using 59 PHA bins.
# Reduced chi-squared =         0.8345 for     56 degrees of freedom
# Null hypothesis probability =   8.065745e-01

Photon flux (15-150 keV)    in 1 sec: 9.23907 ( -0.36141  0.36161 ) ph/cm2/s
Energy fluence (15-150 keV)             : 8.42927e-07 ( -3.60451e-08  3.59134e-08 ) ergs/cm2
Time-resolved spectra
Distribution
T90 vs. Hardness ratio plot
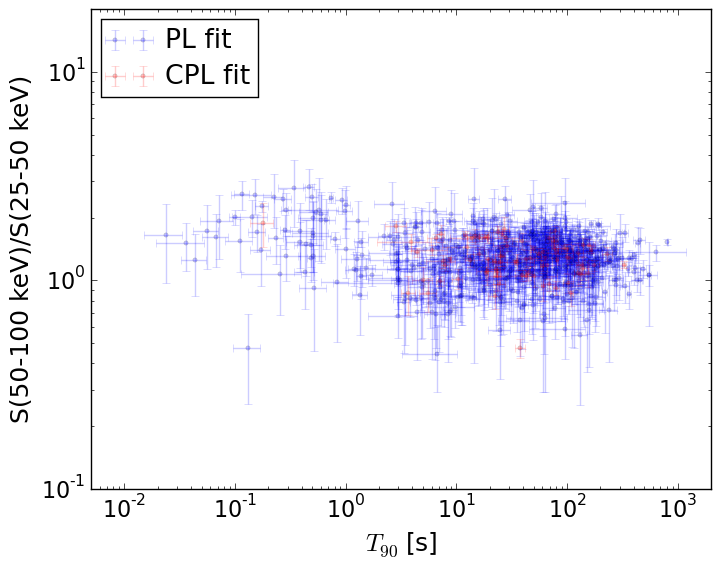
T90                                   = N/A sec.
Hardness ratio (energy fluence ratio) = N/A
S(15-50 keV) vs. S(50-150 keV) plot
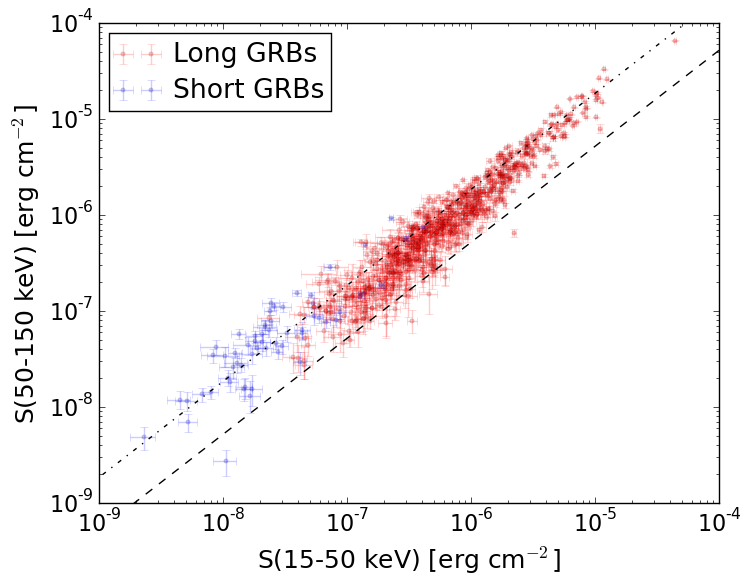
S(15-50 keV)  = N/A
S(50-150 keV) = N/A
The dash-dotted line and the dashed line traces the fluences calculated from the Band function with Epeak = 15 and 150 keV, respectively. Both lines assume a canonical values of alpha = -1 and beta = -2.5.
Mask shadow pattern
IMX = 1.820551608593698E-01, IMY = -4.507577601104357E-01
Spacecraft aspect plot
Bright source in the pre-burst/pre-slew/post-slew images
Pre-burst image of 15-350 keV band
Time interval of the image:
Pre-slew background subtracted image of 15-350 keV band
Time interval of the image:
-96.899400 73.900600

# RAcent  DECcent POSerr Theta    Phi  PeakCts   SNR AngSep     Name
#  [deg]    [deg]    ['] [deg]  [deg]                   [']
299.6237  35.2030    2.4  48.7  -16.9   1.6526   4.9    1.6	Cyg X-1
308.1036  40.9873    1.8  40.2  -20.3   1.3995   6.2    2.1	Cyg X-3
326.1276  38.3344    7.1  35.0  -41.8   0.3798   1.6    2.2	Cyg X-2
277.0350  86.4162    0.9  25.9   68.0   2.6538  12.6 ------	UNKNOWN
Post-slew image of 15-350 keV band
Time interval of the image:
120.900600 963.072800

# RAcent  DECcent POSerr Theta    Phi  PeakCts   SNR AngSep     Name
#  [deg]    [deg]    ['] [deg]  [deg]                   [']
254.3391  35.3488    7.5  51.4    6.6   1.8829   1.5    5.8	Her X-1
299.6228  35.1992    2.6  51.5  -40.8  11.3402   4.4    1.6	Cyg X-1
308.0773  40.9461    3.2  46.0  -49.9   6.7173   3.6    1.5	Cyg X-3
231.9584  35.2775    3.5  52.2   29.9   8.8648   3.3 ------	UNKNOWN
 95.5753  41.4878    2.7  52.1  164.2   8.5977   4.3 ------	UNKNOWN
279.5524  40.9076    2.4  45.5  -19.8   4.1214   4.9 ------	UNKNOWN
323.4101  65.0921    2.6  22.6  -69.7   2.5915   4.5 ------	UNKNOWN
 45.3378  45.1088    3.3  47.2 -148.1   3.9338   3.5 ------	UNKNOWN
321.3380  43.7345    3.3  43.7  -64.0   9.3904   3.5 ------	UNKNOWN