Analysis Summary
Notes:
- 1) No attempt has been made to eliminate the non-significant decimal places.
- 2) This batgrbproduct analysis is done using the HEASARC data.
- 3) This batgrbproduct analysis is using the flight position for the mask-weighting calculation.
======================================================================
                  BAT GRB EVENT DATA PROCESSING REPORT
    Process Script Ver: batgrbproduct v2.46
    Process Start Time: Wed Jun  1 15:59:24 EDT 2016
             Host Name: bat1
   Current Working Dir: /local/data/bat1/alien/Swift_3rdBATcatalog/event/batevent_reproc/trigger682339
======================================================================

  Trigger: 00682339      Segment: 000

  BAT Trigger Time: 482030948.032   [s; MET]
      Trigger Stop: 482030948.544   [s; MET]
               UTC: 2016-04-11T01:28:51.924060    [includes UTCF correction]
       Where From?: TDRSS position message

  BAT
    RA: 349.361911484438   Dec: -40.2708134633611  [deg; J2000]

     Catalogged Source?: NO
     Point Source?:      YES
     GRB Indicated?:     YES    [ by BAT flight software ]
     Image S/N Ratio:    7.44
     Image Trigger?:     NO
     Rate S/N Ratio:     15.9059737205869  [ if not an image trigger ]
     Image S/N Ratio:    7.44

  Analysis Position:   [ source = BAT ]
    RA: 349.361911484438   Dec: -40.2708134633611  [deg; J2000]

  Refined Position:   [ source = BAT pre-slew burst ]
    RA: 349.373060255973   Dec: -40.258861585134  [deg; J2000]
        { 23h 17m 29.5s , -40d 15' 31.9" }
         +/- 2.39899764309769 [arcmin] (estimated 90% radius based on SNR)
         +/- 0.986504018371565 [arcmin] (formal 1-sigma fit error)
    SNR: 8.71402166353091

  Angular difference between the analysis and refined position is 0.880224 arcmin

  Partial Coding Fraction: 0.2734375    [ including projection effects ]

  Duration
     T90: 0.355999946594238 +/- 0.0756042006334982
        Measured from: 0.0879999995231628
                   to: 0.443999946117401     [s; relative to TRIGTIME]
     T50: 0.195999979972839 +/- 0.0651152459160164
        Measured from: 0.159999966621399
                   to: 0.355999946594238     [s; relative to TRIGTIME]


  Fluence
     Peak Flux  (peak 1 second)
        Measured from: -0.241999983787537
                   to: 0.758000016212463     [s; relative to TRIGTIME]
     Total Fluence
        Measured from: 0.0600000023841858
                   to: 0.452000021934509     [s; relative to TRIGTIME]

             Band 1     Band 2     Band 3     Band 4
              15-25      25-50     50-100    100-350     keV
 Total     0.016191   0.049774   0.050797   0.013886
           0.008515   0.008968   0.009117   0.006765 [error]
 Peak      0.031910   0.073084   0.051593   0.016754
           0.012152   0.012939   0.012400   0.009344 [error]

     [ fluence units of on-axis counts / fully illuminated detector ]

======================================================================


====== Table of the duration information =============================

        Value   tstart    tstop
T100    0.392    0.060    0.452
T90     0.356    0.088    0.444
T50     0.196    0.160    0.356
Peak    1.000   -0.242    0.758


====== Spectral Analysis Summary =====================================

Model      : spectral model: simple power-law (PL) and cutoff power-law (CPL)
Ph_index   : photon index: E^{Ph_index}
Ph_90err   : 90% error of the photon index
Epeak      : Epeak in keV
Epeak_90err: 90% error of Epeak
Norm       : normalization at 50 keV in both the PL model and CPL model
Nomr_90err : 90% error of the normalization
chi2       : Chi-Squared
dof        : degree of freedo

=== Time-averaged spectral analysis ===
(Best model with acceptable fit: PL)

Model Ph_index Ph_90err_low Ph_90err_hi  Epeak  Epeak_90err_low  Epeak_90err_hi  Norm       Nomr_90err_low    Norm_90err_hi    chi2    dof
PL      -1.409    -0.305      0.298       -           -               -         2.07e-02     -4.57e-03          4.56e-03      65.940   57
CPL      1.402    -1.778      3.305       66.585     -13.124        25.758      4.12e-01     -4.12e-01          1.07e+01      56.770   56


=== 1-s peak spectral analysis ===
(Best model with acceptable fit: PL)

Model Ph_index Ph_90err_low Ph_90err_hi  Epeak  Epeak_90err_low  Epeak_90err_hi  Norm       Nomr_90err_low    Norm_90err_hi    chi2    dof
PL      -1.632     -0.353     0.334       -           -               -         1.15e-02     -2.72e-03          2.68e-03      64.990   57
CPL      1.240     -2.158     4.029       51.931     -10.259        26.237      3.81e-01     -3.81e-01          4.53e+01      59.070   56


=== Fluence/Peak Flux Summary ===

              Model    Band1     Band2     Band3     Band4     Band5     Total
                       15-25     25-50    50-100    100-350    15-150    15-350    keV
Fluence         PL   9.52e-09  1.85e-08  2.78e-08  9.07e-08  7.82e-08  1.47e-07   erg/cm2
      90%_error_low -3.12e-09 -4.38e-09 -7.01e-09 -3.78e-08 -1.80e-08 -4.56e-08   erg/cm2
      90%_error_hi   3.42e-09  4.35e-09  6.95e-09  4.92e-08  1.81e-08  5.38e-08   erg/cm2
Peak flux       PL   5.35e-01  4.98e-01  3.22e-01  3.20e-01  1.49e+00  1.68e+00   ph/cm2/s
      90%_error_low -1.70e-01 -1.14e-01 -9.29e-02 -1.48e-01 -3.34e-01 -3.77e-01   ph/cm2/s
      90%_error_hi   1.84e-01  1.13e-01  9.27e-02  2.01e-01  3.35e-01  3.79e-01   ph/cm2/s

Fluence        CPL   5.13e-09  2.29e-08  3.67e-08  1.30e-08  7.55e-08  7.78e-08   erg/cm2
      90%_error_low -3.42e-09 -5.89e-09 -1.05e-08    N/A    -1.93e-08 -2.14e-08   erg/cm2
      90%_error_hi   4.18e-09  5.99e-09  1.07e-08    N/A     1.95e-08  2.85e-08   erg/cm2
Peak flux      CPL   3.45e-01  6.45e-01  3.51e-01  3.30e-02  1.37e+00  1.37e+00   ph/cm2/s
      90%_error_low -2.10e-01 -1.60e-01 -1.39e-01 -3.30e-02 -3.51e-01 -3.53e-01   ph/cm2/s
      90%_error_hi   2.31e-01  1.70e-01  1.29e-01  1.38e-01  3.51e-01  3.62e-01   ph/cm2/s

======================================================================
Image
Pre-slew 15.0-350.0 keV image (Event data)
#   RAcent    DECcent   POSerr    Theta     Phi              Peak Cts       SNR   Name
  349.3731   -40.2589   0.0221    41.9472  -133.4827         0.1438468      8.714 TRIG_00682339

Foreground time interval of the image:
  0.060   0.452 (delta_t =   0.392 [sec])
Background time interval of the image:
-81.731   0.060 (delta_t =  81.791 [sec])
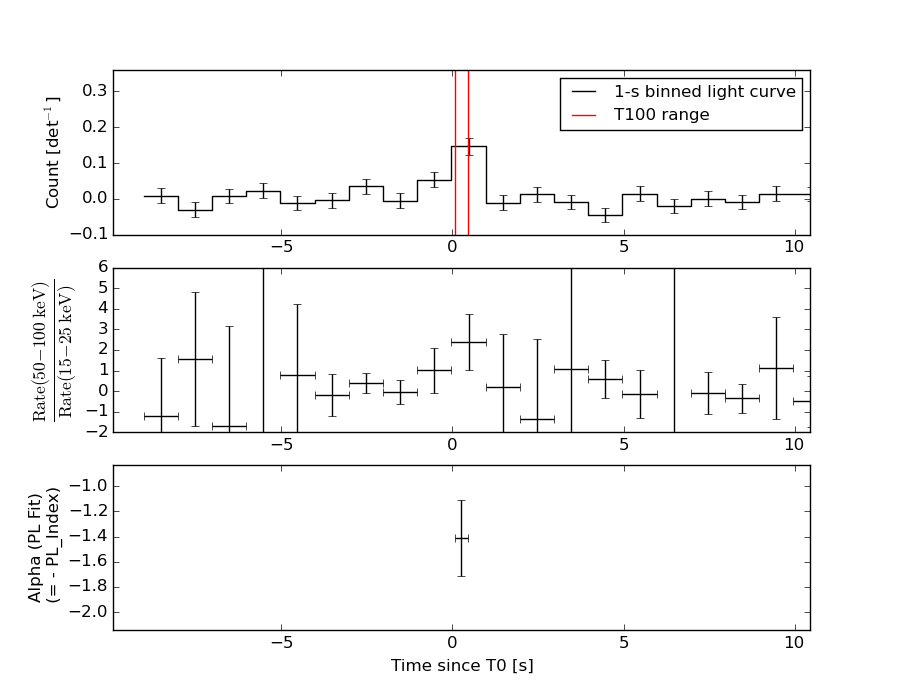
Light Curves
Note: The mask-weighted lightcurves have units of either count/det or counts/sec/det, where a det is 0.4 x 0.4 = 0.16 sq cm.
Full-time range; 1 s binning
Other quick-look light curves:
- 64 ms binning (zoomed)
- 16 ms binning (zoomed)
- 8 ms binning (zoomed)
- 2 ms binning (zoomed)
- SN=5 or 10 s binning (full-time range)
- Raw light curve
Spectra
- 64 ms binning (zoomed)
- 16 ms binning (zoomed)
- 8 ms binning (zoomed)
- 2 ms binning (zoomed)
- SN=5 or 10 s binning (full-time range)
- Raw light curve
Spectra
Notes:
- 1) The fitting includes the systematic errors.
- 2) When the burst includes telescope slew time periods, the fitting uses an average response file made from multiple 5-s response files through out the slew time plus single time preiod for the non-slew times, and weighted by the total counts in the corresponding time period using addrmf. An average response file is needed becuase a spectral fit using the pre-slew DRM will introduce some errors in both a spectral shape and a normalization if the PHA file contains a lot of the slew/post-slew time interval.
- 3) For fits to more complicated models (e.g. a power-law over a cutoff power-law), the BAT team has decided to require a chi-square improvement of more than 6 for each extra dof.
Time averaged spectrum fit using the average DRM
Power-law model
Time interval is from    0.060 sec. to    0.452 sec.

Spectral model in power-law:
------------------------------------------------------------
Parameters  : value       lower 90%   higher 90%
Photon index: -1.40944     ( -0.303467   0.299254 )
Norm@50keV  : 2.06955E-02    ( -0.00456469   0.00456188 )
------------------------------------------------------------
#Fit statistic : Chi-Squared =          65.94 using 59 PHA bins.
# Reduced chi-squared =          1.157 for     57 degrees of freedom
# Null hypothesis probability =   1.952526e-01

Photon flux (15-150 keV)    in 0.392 sec: 2.52626 ( -0.57323  0.5762 ) ph/cm2/s
Energy fluence (15-150 keV)             : 7.82322e-08 ( -1.80115e-08  1.80943e-08 ) ergs/cm2
Cutoff power-law model
Time interval is from    0.060 sec. to    0.452 sec.
Spectral model in the cutoff power-law:
------------------------------------------------------------
Parameters  : value       lower 90%   higher 90%
Photon index: 1.40225     ( -1.77778   3.30513 )
Epeak [keV] : 66.5851      ( -13.1238 25.7583 )
Norm@50keV  : 0.412443    ( -0.412444   10.6718 )
------------------------------------------------------------
#Fit statistic : Chi-Squared =          56.77 using 59 PHA bins.
# Reduced chi-squared =          1.014 for     56 degrees of freedom
# Null hypothesis probability =   4.461073e-01

Photon flux (15-150 keV)    in 0.392 sec: 2.39281 ( -0.58849  0.59049 ) ph/cm2/s
Energy fluence (15-150 keV)             : 7.55188e-08 ( -1.93395e-08  1.95386e-08 ) ergs/cm2
1-s peak spectrum fit
Power-law model
Time interval is from   -0.242 sec. to    0.758 sec.

Spectral model in power-law:
------------------------------------------------------------
Parameters  : value       lower 90%   higher 90%
Photon index: -1.63178     ( -0.353393   0.333691 )
Norm@50keV  : 1.14598E-02    ( -0.00272308   0.00268404 )
------------------------------------------------------------
#Fit statistic : Chi-Squared =          64.99 using 59 PHA bins.
# Reduced chi-squared =          1.140 for     57 degrees of freedom
# Null hypothesis probability =   2.183141e-01

Photon flux (15-150 keV)    in 1 sec: 1.48751 ( -0.33405  0.33466 ) ph/cm2/s
Energy fluence (15-150 keV)             : 1.0681e-07 ( -2.63556e-08  2.68896e-08 ) ergs/cm2
Cutoff power-law model
Time interval is from   -0.242 sec. to    0.758 sec.
Spectral model in the cutoff power-law:
------------------------------------------------------------
Parameters  : value       lower 90%   higher 90%
Photon index: 1.24041     ( -2.1879   3.99891 )
Epeak [keV] : 51.9308      ( -10.1401 26.3567 )
Norm@50keV  : 0.381442    ( -0.405766   45.3047 )
------------------------------------------------------------
#Fit statistic : Chi-Squared =          59.07 using 59 PHA bins.
# Reduced chi-squared =          1.055 for     56 degrees of freedom
# Null hypothesis probability =   3.639494e-01

Photon flux (15-150 keV)    in 1 sec: 1.37142 ( -0.35057  0.35144 ) ph/cm2/s
Energy fluence (15-150 keV)             : 9.12914e-08 ( -2.48146e-08  2.88133e-08 ) ergs/cm2
Time-resolved spectra
Distribution
T90 vs. Hardness ratio plot
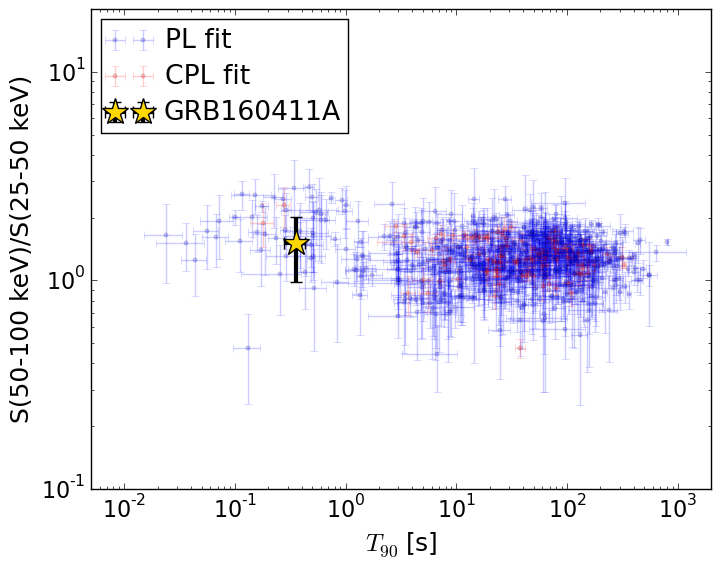
T90                                   = 0.3559999 sec.
Hardness ratio (energy fluence ratio) = 1.50494270829
S(15-50 keV) vs. S(50-150 keV) plot
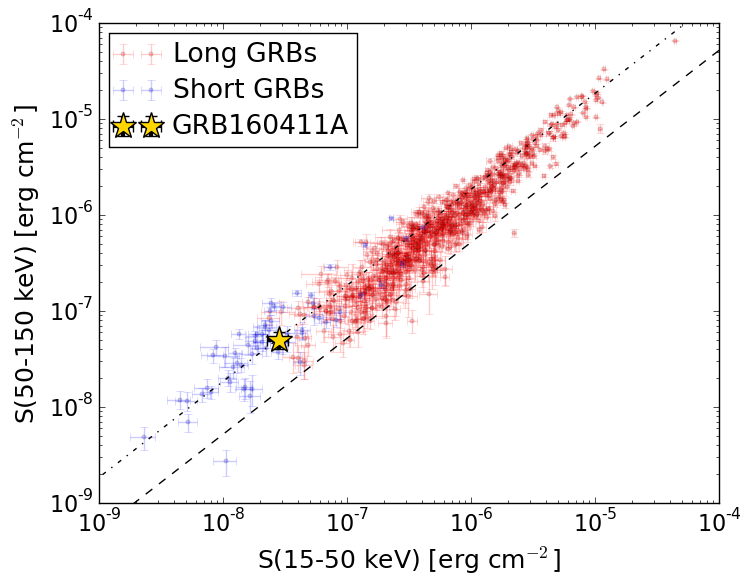
S(15-50 keV)  = 2.8011986e-08
S(50-150 keV) = 5.022149e-08
The dash-dotted line and the dashed line traces the fluences calculated from the Band function with Epeak = 15 and 150 keV, respectively. Both lines assume a canonical values of alpha = -1 and beta = -2.5.
Mask shadow pattern
IMX = -6.184523809566941E-01, IMY = 6.521067639165855E-01
Spacecraft aspect plot
Bright source in the pre-burst/pre-slew/post-slew images
Pre-burst image of 15-350 keV band
Time interval of the image:
-81.731420 0.060000

# RAcent  DECcent POSerr Theta    Phi  PeakCts   SNR AngSep     Name
#  [deg]    [deg]    ['] [deg]  [deg]                   [']
297.7962 -63.1040    3.6  41.2  168.2   0.5380   3.2 ------	UNKNOWN
301.0864 -54.8947    2.8  47.3  176.6   0.9221   4.2 ------	UNKNOWN
Pre-slew background subtracted image of 15-350 keV band
Time interval of the image:
0.060000 0.452000

# RAcent  DECcent POSerr Theta    Phi  PeakCts   SNR AngSep     Name
#  [deg]    [deg]    ['] [deg]  [deg]                   [']
349.3730 -40.2589    1.3  41.9 -133.5   0.1439   8.7 ------	UNKNOWN
Post-slew image of 15-350 keV band
Time interval of the image: