Analysis Summary
Notes:
- 1) No attempt has been made to eliminate the non-significant decimal places.
- 2) This batgrbproduct analysis is done using the HEASARC data.
- 3) This batgrbproduct analysis is using the flight position for the mask-weighting calculation.
======================================================================
                  BAT GRB EVENT DATA PROCESSING REPORT
    Process Script Ver: batgrbproduct v2.46
    Process Start Time: Mon Oct 24 17:08:06 EDT 2016
             Host Name: bat1
   Current Working Dir: /local/data/bat1/alien/Swift_3rdBATcatalog/event/batevent_reproc/trigger715246
======================================================================

  Trigger: 00715246      Segment: 000

  BAT Trigger Time: 497315296.256   [s; MET]
      Trigger Stop: 497315297.28   [s; MET]
               UTC: 2016-10-04T23:07:59.296560    [includes UTCF correction]
       Where From?: TDRSS position message

  BAT
    RA: 112.157428447963   Dec: -39.8946229194368  [deg; J2000]

     Catalogged Source?: NO
     Point Source?:      YES
     GRB Indicated?:     YES    [ by BAT flight software ]
     Image S/N Ratio:    24.22
     Image Trigger?:     NO
     Rate S/N Ratio:     152.833242457261  [ if not an image trigger ]
     Image S/N Ratio:    24.22

  Analysis Position:   [ source = BAT ]
    RA: 112.157428447963   Dec: -39.8946229194368  [deg; J2000]

  Refined Position:   [ source = BAT pre-slew burst ]
    RA: 112.155751592562   Dec: -39.8964820862006  [deg; J2000]
        { 07h 28m 37.4s , -39d 53' 47.3" }
         +/- 0.502854927995163 [arcmin] (estimated 90% radius based on SNR)
         +/- 0.143296681263539 [arcmin] (formal 1-sigma fit error)
    SNR: 81.2136058546313

  Angular difference between the analysis and refined position is 0.135653 arcmin

  Partial Coding Fraction: 0.734375    [ including projection effects ]

  Duration
     T90: 15.7199999690056 +/- 0.752191441922543
        Measured from: -2.63599997758865
                   to: 13.0839999914169     [s; relative to TRIGTIME]
     T50: 6.31599992513657 +/- 0.137637219904285
        Measured from: 0.340000033378601
                   to: 6.65599995851517     [s; relative to TRIGTIME]


  Fluence
     Peak Flux  (peak 1 second)
        Measured from: 0.379999995231628
                   to: 1.37999999523163     [s; relative to TRIGTIME]
     Total Fluence
        Measured from: -5.1599999666214
                   to: 27.3080000281334     [s; relative to TRIGTIME]

             Band 1     Band 2     Band 3     Band 4
              15-25      25-50     50-100    100-350     keV
 Total     3.295321   5.102933   4.001958   0.939653
           0.047842   0.054195   0.049019   0.035419 [error]
 Peak      0.214827   0.449647   0.437643   0.129584
           0.010429   0.013470   0.013546   0.009216 [error]

     [ fluence units of on-axis counts / fully illuminated detector ]

======================================================================


====== Table of the duration information =============================

        Value   tstart    tstop
T100   32.468   -5.160   27.308
T90    15.720   -2.636   13.084
T50     6.316    0.340    6.656
Peak    1.000    0.380    1.380


====== Spectral Analysis Summary =====================================

Model      : spectral model: simple power-law (PL) and cutoff power-law (CPL)
Ph_index   : photon index: E^{Ph_index}
Ph_90err   : 90% error of the photon index
Epeak      : Epeak in keV
Epeak_90err: 90% error of Epeak
Norm       : normalization at 50 keV in both the PL model and CPL model
Nomr_90err : 90% error of the normalization
chi2       : Chi-Squared
dof        : degree of freedo

=== Time-averaged spectral analysis ===
(Best model with acceptable fit: CPL)

Model Ph_index Ph_90err_low Ph_90err_hi  Epeak  Epeak_90err_low  Epeak_90err_hi  Norm       Nomr_90err_low    Norm_90err_hi    chi2    dof
PL      -1.472    -0.031      0.031       -           -               -         2.87e-02     -4.82e-04          4.81e-04      47.610   57
CPL     -1.209    -0.128      0.131      177.046     -39.438       106.210      3.72e-02     -4.29e-03          4.99e-03      34.990   56


=== 1-s peak spectral analysis ===
(Best model with acceptable fit: PL)

Model Ph_index Ph_90err_low Ph_90err_hi  Epeak  Epeak_90err_low  Epeak_90err_hi  Norm       Nomr_90err_low    Norm_90err_hi    chi2    dof
PL      -1.069     -0.058     0.058       -           -               -         8.66e-02     -2.95e-03          2.95e-03      51.350   57
CPL     -0.640     -0.236     0.249      180.340     -46.099       144.082      1.35e-01     -2.89e-02          3.89e-02      41.390   56


=== Fluence/Peak Flux Summary ===

              Model    Band1     Band2     Band3     Band4     Band5     Total
                       15-25     25-50    50-100    100-350    15-150    15-350    keV
Fluence         PL   1.16e-06  2.17e-06  3.12e-06  9.56e-06  8.88e-06  1.60e-05   erg/cm2
      90%_error_low -4.15e-08 -4.57e-08 -5.81e-08 -4.10e-07 -1.48e-07 -4.30e-07   erg/cm2
      90%_error_hi   4.22e-08  4.56e-08  5.79e-08  4.22e-07  1.48e-07  4.40e-07   erg/cm2
Peak flux       PL   2.36e+00  3.07e+00  2.93e+00  4.96e+00  1.00e+01  1.33e+01   ph/cm2/s
      90%_error_low -1.59e-01 -1.28e-01 -1.10e-01 -3.85e-01 -3.50e-01 -4.88e-01   ph/cm2/s
      90%_error_hi   1.62e-01  1.27e-01  1.10e-01  4.05e-01  3.50e-01  4.92e-01   ph/cm2/s

Fluence        CPL   1.07e-06  2.18e-06  3.21e-06  7.06e-06  8.76e-06  1.35e-05   erg/cm2
      90%_error_low -5.57e-08 -4.76e-08 -7.05e-08 -9.23e-07 -1.59e-07 -9.28e-07   erg/cm2
      90%_error_hi   5.68e-08  4.76e-08  7.07e-08  1.09e-06  1.59e-07  1.09e-06   erg/cm2
Peak flux      CPL   2.12e+00  3.15e+00  3.09e+00  3.27e+00  9.86e+00  1.16e+01   ph/cm2/s
      90%_error_low -1.98e-01 -1.40e-01 -1.38e-01 -6.38e-01 -3.59e-01 -7.31e-01   ph/cm2/s
      90%_error_hi   2.02e-01  1.40e-01  1.39e-01  8.28e-01  3.59e-01  8.80e-01   ph/cm2/s

======================================================================
Image
Pre-slew 15.0-350.0 keV image (Event data)
#   RAcent    DECcent   POSerr    Theta     Phi              Peak Cts       SNR   Name
  112.1558   -39.8965   0.0024    26.6283   -50.7913        13.1595389     81.214 TRIG_00715246

Foreground time interval of the image:
 -5.160  14.645 (delta_t =  19.805 [sec])
Background time interval of the image:
-32.155  -5.160 (delta_t =  26.995 [sec])
Light Curves
Note: The mask-weighted lightcurves have units of either count/det or counts/sec/det, where a det is 0.4 x 0.4 = 0.16 sq cm.
Full-time range; 1 s binning
Other quick-look light curves:
- 64 ms binning (zoomed)
- 16 ms binning (zoomed)
- 8 ms binning (zoomed)
- 2 ms binning (zoomed)
- SN=5 or 10 s binning (full-time range)
- Raw light curve
Spectra
- 64 ms binning (zoomed)
- 16 ms binning (zoomed)
- 8 ms binning (zoomed)
- 2 ms binning (zoomed)
- SN=5 or 10 s binning (full-time range)
- Raw light curve
Spectra
Notes:
- 1) The fitting includes the systematic errors.
- 2) When the burst includes telescope slew time periods, the fitting uses an average response file made from multiple 5-s response files through out the slew time plus single time preiod for the non-slew times, and weighted by the total counts in the corresponding time period using addrmf. An average response file is needed becuase a spectral fit using the pre-slew DRM will introduce some errors in both a spectral shape and a normalization if the PHA file contains a lot of the slew/post-slew time interval.
- 3) For fits to more complicated models (e.g. a power-law over a cutoff power-law), the BAT team has decided to require a chi-square improvement of more than 6 for each extra dof.
Time averaged spectrum fit using the average DRM
Power-law model
Time interval is from   -5.160 sec. to   27.308 sec.

Spectral model in power-law:
------------------------------------------------------------
Parameters  : value       lower 90%   higher 90%
Photon index: -1.47176     ( -0.0310994   0.0311586 )
Norm@50keV  : 2.86838E-02    ( -0.000481683   0.000481432 )
------------------------------------------------------------
#Fit statistic : Chi-Squared =          47.61 using 59 PHA bins.
# Reduced chi-squared =         0.8353 for     57 degrees of freedom
# Null hypothesis probability =   8.076864e-01

Photon flux (15-150 keV)    in 32.47 sec: 3.55444 ( -0.07038  0.07063 ) ph/cm2/s
Energy fluence (15-150 keV)             : 8.87876e-06 ( -1.48195e-07  1.48425e-07 ) ergs/cm2
Cutoff power-law model
Time interval is from   -5.160 sec. to   27.308 sec.
Spectral model in the cutoff power-law:
------------------------------------------------------------
Parameters  : value       lower 90%   higher 90%
Photon index: -1.20855     ( -0.127856   0.13142 )
Epeak [keV] : 177.046      ( -39.4377 106.21 )
Norm@50keV  : 3.71636E-02    ( -0.00429414   0.00498765 )
------------------------------------------------------------
#Fit statistic : Chi-Squared =          34.99 using 59 PHA bins.
# Reduced chi-squared =         0.6248 for     56 degrees of freedom
# Null hypothesis probability =   9.875396e-01

Photon flux (15-150 keV)    in 32.47 sec: 3.47668 ( -0.07834  0.07881 ) ph/cm2/s
Energy fluence (15-150 keV)             : 8.76037e-06 ( -1.59307e-07  1.58958e-07 ) ergs/cm2
1-s peak spectrum fit
Power-law model
Time interval is from    0.380 sec. to    1.380 sec.

Spectral model in power-law:
------------------------------------------------------------
Parameters  : value       lower 90%   higher 90%
Photon index: -1.06853     ( -0.0579323   0.0582344 )
Norm@50keV  : 8.65769E-02    ( -0.00294915   0.0029479 )
------------------------------------------------------------
#Fit statistic : Chi-Squared =          51.35 using 59 PHA bins.
# Reduced chi-squared =         0.9009 for     57 degrees of freedom
# Null hypothesis probability =   6.859696e-01

Photon flux (15-150 keV)    in 1 sec: 10.0140 ( -0.34968  0.3498 ) ph/cm2/s
Energy fluence (15-150 keV)             : 9.14576e-07 ( -3.39328e-08  3.40172e-08 ) ergs/cm2
Cutoff power-law model
Time interval is from    0.380 sec. to    1.380 sec.
Spectral model in the cutoff power-law:
------------------------------------------------------------
Parameters  : value       lower 90%   higher 90%
Photon index: -0.640428     ( -0.236276   0.249464 )
Epeak [keV] : 180.340      ( -46.0991 144.083 )
Norm@50keV  : 0.135308    ( -0.0288692   0.0389241 )
------------------------------------------------------------
#Fit statistic : Chi-Squared =          41.39 using 59 PHA bins.
# Reduced chi-squared =         0.7391 for     56 degrees of freedom
# Null hypothesis probability =   9.276231e-01

Photon flux (15-150 keV)    in 1 sec: 9.85873 ( -0.3591  0.35927 ) ph/cm2/s
Energy fluence (15-150 keV)             : 1.8202e-07 ( -2.24431e-08  1.78327e-08 ) ergs/cm2
Time-resolved spectra
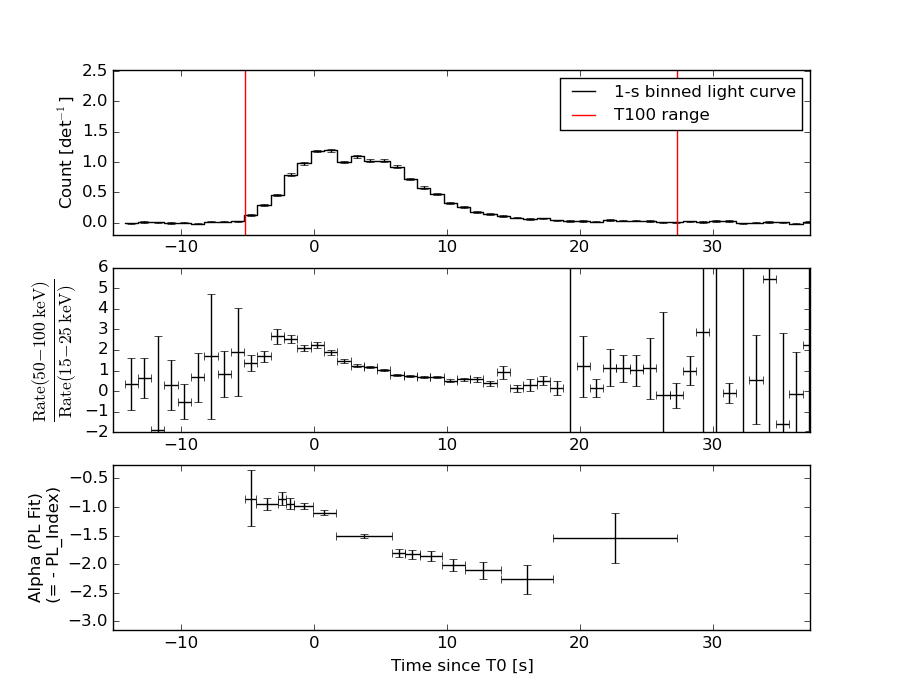
Distribution
T90 vs. Hardness ratio plot
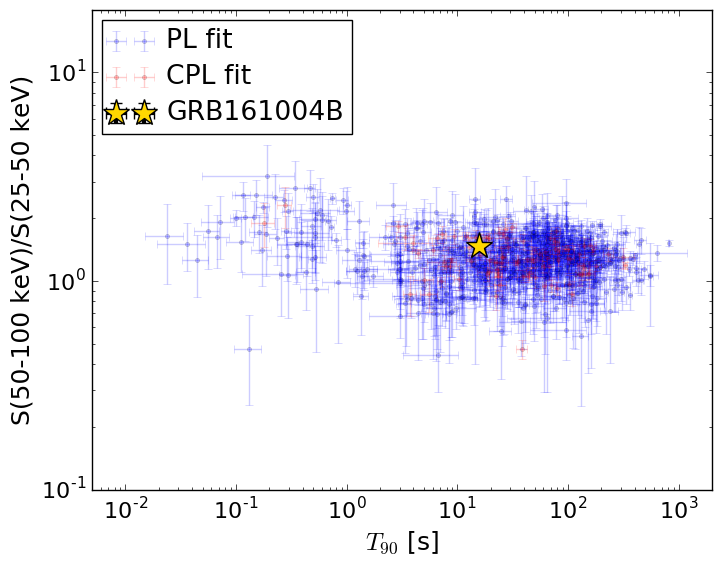
T90                                   = 15.72 sec.
Hardness ratio (energy fluence ratio) = 1.46794604475
S(15-50 keV) vs. S(50-150 keV) plot
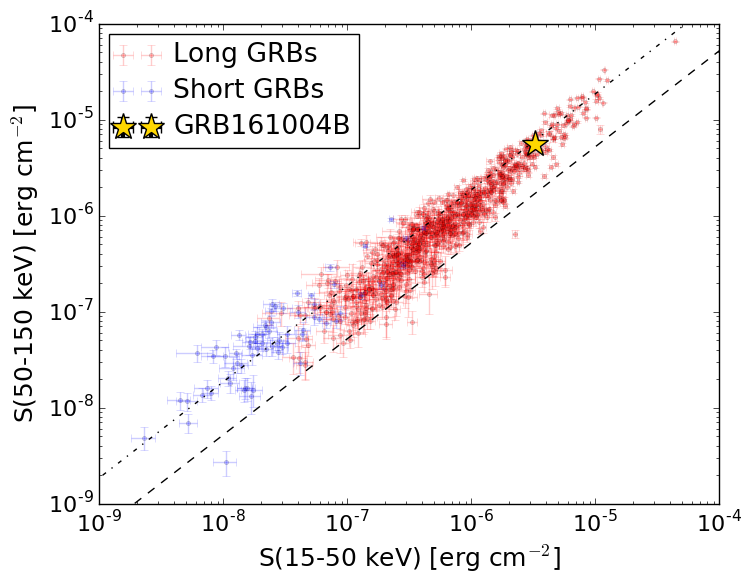
S(15-50 keV)  = 3.258076e-06
S(50-150 keV) = 5.502276e-06
The dash-dotted line and the dashed line traces the fluences calculated from the Band function with Epeak = 15 and 150 keV, respectively. Both lines assume a canonical values of alpha = -1 and beta = -2.5.
Mask shadow pattern
IMX = 3.169454725944750E-01, IMY = 3.884934224084262E-01
Spacecraft aspect plot
Bright source in the pre-burst/pre-slew/post-slew images
Pre-burst image of 15-350 keV band
Time interval of the image:
-32.155410 -5.160000

# RAcent  DECcent POSerr Theta    Phi  PeakCts   SNR AngSep     Name
#  [deg]    [deg]    ['] [deg]  [deg]                   [']
 83.6244  22.0051    1.4  42.9  157.1   1.0301   8.0    0.7	Crab
135.7263 -40.6291    0.0  42.9  -64.3   0.1917   0.9   10.1	Vela X-1
136.5623 -40.9880    2.3  43.6  -64.1   1.1670   4.9 ------	UNKNOWN
Pre-slew background subtracted image of 15-350 keV band
Time interval of the image:
-5.160000 14.644600

# RAcent  DECcent POSerr Theta    Phi  PeakCts   SNR AngSep     Name
#  [deg]    [deg]    ['] [deg]  [deg]                   [']
 83.4713  21.8869   63.9  42.8  156.9   0.0611   0.2   11.8	Crab
135.4030 -40.6047   20.0  42.7  -64.3   0.2920   0.6    6.5	Vela X-1
 53.8963 -26.7343    2.9  34.5   59.3   1.2066   3.9 ------	UNKNOWN
115.0403  17.6177    2.1  44.6 -159.3   1.2991   5.7 ------	UNKNOWN
112.1557 -39.8965    0.1  26.6  -50.8  13.1591  81.2 ------	UNKNOWN
Post-slew image of 15-350 keV band
Time interval of the image:
62.444600 962.862300

# RAcent  DECcent POSerr Theta    Phi  PeakCts   SNR AngSep     Name
#  [deg]    [deg]    ['] [deg]  [deg]                   [']
135.5847 -40.5550    1.4  17.9  -76.8   4.7486   8.0    2.6	Vela X-1
170.3489 -60.6358    1.3  40.8  -36.1   6.4562   8.7    1.2	Cen X-3
186.5801 -62.7257    6.2  48.4  -32.7   2.3977   1.9    3.4	GX 301-2
 64.5997 -46.0598    4.1  34.8   67.3   3.9136   2.8 ------	UNKNOWN
257.1863 -81.8598    3.8  56.9   -2.0   7.8340   3.0 ------	UNKNOWN
170.9040 -41.6779    5.0  43.6  -64.2   6.2074   2.3 ------	UNKNOWN