Analysis Summary
Notes:
- 1) No attempt has been made to eliminate the non-significant decimal places.
- 2) This batgrbproduct analysis is done using the HEASARC data.
- 3) This batgrbproduct analysis is using the flight position for the mask-weighting calculation.
======================================================================
BAT GRB EVENT DATA PROCESSING REPORT
Process Script Ver: batgrbproduct v2.46
Process Start Time: Mon Nov 14 22:02:14 EST 2016
Host Name: bat1
Current Working Dir: /local/data/bat1/alien/Swift_3rdBATcatalog/event/batevent_reproc/trigger718023
======================================================================
Trigger: 00718023 Segment: 000
BAT Trigger Time: 498419528.192 [s; MET]
Trigger Stop: 498419529.216 [s; MET]
UTC: 2016-10-17T17:51:51.169980 [includes UTCF correction]
Where From?: TDRSS position message
BAT
RA: 142.765381319357 Dec: 43.1418079589348 [deg; J2000]
Catalogged Source?: NO
Point Source?: YES
GRB Indicated?: YES [ by BAT flight software ]
Image S/N Ratio: 8.53
Image Trigger?: NO
Rate S/N Ratio: 19.5448202856921 [ if not an image trigger ]
Image S/N Ratio: 8.53
Analysis Position: [ source = BAT ]
RA: 142.765381319357 Dec: 43.1418079589348 [deg; J2000]
Refined Position: [ source = BAT pre-slew burst ]
RA: 142.765950837089 Dec: 43.1237910283339 [deg; J2000]
{ 09h 31m 03.8s , +43d 07' 25.6" }
+/- 0.919328694193454 [arcmin] (estimated 90% radius based on SNR)
+/- 0.393986743914146 [arcmin] (formal 1-sigma fit error)
SNR: 34.3006957395021
Angular difference between the analysis and refined position is 1.081303 arcmin
Partial Coding Fraction: 1.015625 [ including projection effects ]
Duration
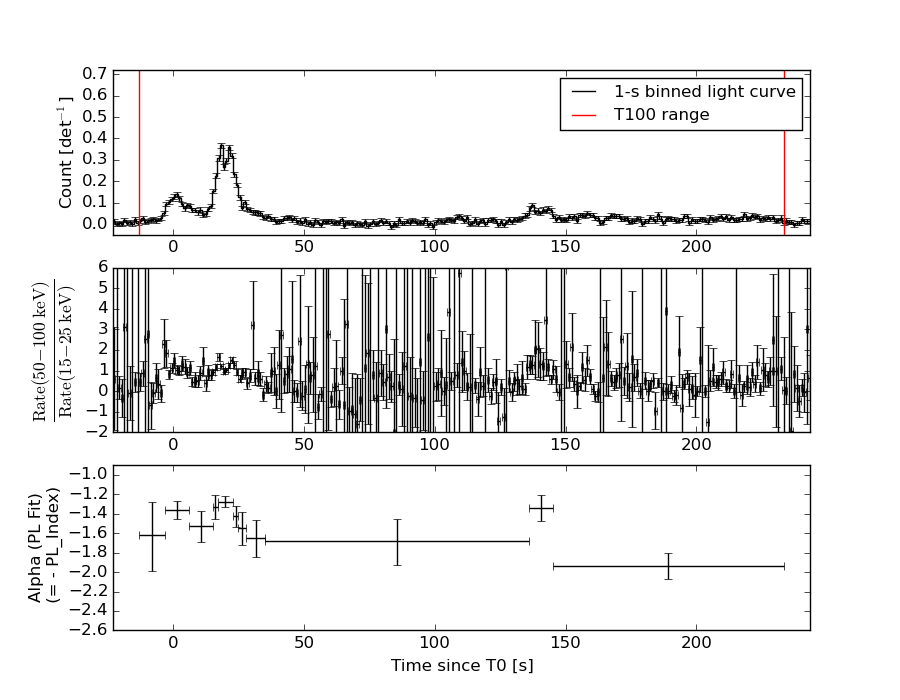
T90: 217.047999918461 +/- 6.86324586240994
Measured from: -0.807999968528748
to: 216.239999949932 [s; relative to TRIGTIME]
T50: 126.003999948502 +/- 3.4710966645323
Measured from: 17.1360000371933
to: 143.139999985695 [s; relative to TRIGTIME]
Fluence
Peak Flux (peak 1 second)
Measured from: 21.2560000419617
to: 22.2560000419617 [s; relative to TRIGTIME]
Total Fluence
Measured from: -13.2799999713898
to: 233.420000016689 [s; relative to TRIGTIME]
Band 1 Band 2 Band 3 Band 4
15-25 25-50 50-100 100-350 keV
Total 2.828171 3.352492 2.456268 0.654394
0.080875 0.084517 0.073984 0.063034 [error]
Peak 0.091345 0.115948 0.126834 0.036032
0.006344 0.007140 0.006753 0.005256 [error]
[ fluence units of on-axis counts / fully illuminated detector ]
======================================================================
====== Table of the duration information =============================
Value tstart tstop
T100 246.700 -13.280 233.420
T90 217.048 -0.808 216.240
T50 126.004 17.136 143.140
Peak 1.000 21.256 22.256
====== Spectral Analysis Summary =====================================
Model : spectral model: simple power-law (PL) and cutoff power-law (CPL)
Ph_index : photon index: E^{Ph_index}
Ph_90err : 90% error of the photon index
Epeak : Epeak in keV
Epeak_90err: 90% error of Epeak
Norm : normalization at 50 keV in both the PL model and CPL model
Nomr_90err : 90% error of the normalization
chi2 : Chi-Squared
dof : degree of freedo
=== Time-averaged spectral analysis ===
(Best model with acceptable fit: PL)
Model Ph_index Ph_90err_low Ph_90err_hi Epeak Epeak_90err_low Epeak_90err_hi Norm Nomr_90err_low Norm_90err_hi chi2 dof
PL -1.571 -0.061 0.061 - - - 2.32e-03 -7.18e-05 7.17e-05 40.880 57
CPL -1.571 -0.059 0.114 9999.360 -9999.360 -9999.360 2.32e-03 -6.70e-05 4.72e-04 40.910 56
=== 1-s peak spectral analysis ===
(Best model with acceptable fit: PL)
Model Ph_index Ph_90err_low Ph_90err_hi Epeak Epeak_90err_low Epeak_90err_hi Norm Nomr_90err_low Norm_90err_hi chi2 dof
PL -1.139 -0.108 0.108 - - - 2.41e-02 -1.38e-03 1.38e-03 55.630 57
CPL -1.140 -0.102 0.115 9999.360 -9999.360 -9999.360 2.42e-02 -1.39e-03 4.76e-03 55.700 56
=== Fluence/Peak Flux Summary ===
Model Band1 Band2 Band3 Band4 Band5 Total
15-25 25-50 50-100 100-350 15-150 15-350 keV
Fluence PL 7.81e-07 1.37e-06 1.85e-06 5.11e-06 5.37e-06 9.12e-06 erg/cm2
90%_error_low -4.67e-08 -4.69e-08 -7.55e-08 -4.64e-07 -1.78e-07 -5.10e-07 erg/cm2
90%_error_hi 4.79e-08 4.68e-08 7.53e-08 4.96e-07 1.78e-07 5.35e-07 erg/cm2
Peak flux PL 7.03e-01 8.78e-01 7.97e-01 1.26e+00 2.81e+00 3.64e+00 ph/cm2/s
90%_error_low -8.16e-02 -6.13e-02 -5.39e-02 -1.80e-01 -1.65e-01 -2.27e-01 ph/cm2/s
90%_error_hi 8.50e-02 6.06e-02 5.34e-02 1.99e-01 1.66e-01 2.31e-01 ph/cm2/s
Fluence CPL 7.81e-07 1.37e-06 1.85e-06 5.10e-06 5.37e-06 9.51e-06 erg/cm2
90%_error_low N/A N/A N/A N/A -1.64e-07 -1.59e-06 erg/cm2
90%_error_hi N/A N/A N/A N/A 1.78e-07 2.63e-09 erg/cm2
Peak flux CPL 7.03e-01 8.78e-01 7.95e-01 1.25e+00 2.83e+00 3.64e+00 ph/cm2/s
90%_error_low N/A -6.14e-02 -5.30e-02 N/A -1.85e-01 -3.07e-01 ph/cm2/s
90%_error_hi N/A 6.06e-02 5.69e-02 N/A 1.46e-01 1.97e-01 ph/cm2/s
======================================================================
Image
Pre-slew 15.0-350.0 keV image (Event data)
#   RAcent    DECcent   POSerr    Theta     Phi              Peak Cts       SNR   Name
  142.7660    43.1238   0.0056     8.7378   -20.0112         1.9352871     34.301 TRIG_00718023

Foreground time interval of the image:
-13.280  16.109 (delta_t =  29.389 [sec])
Background time interval of the image:
-239.192 -13.280 (delta_t = 225.912 [sec])
Light Curves
Note: The mask-weighted lightcurves have units of either count/det or counts/sec/det, where a det is 0.4 x 0.4 = 0.16 sq cm.
Full-time range; 1 s binning
Other quick-look light curves:
- 64 ms binning (zoomed)
- 16 ms binning (zoomed)
- 8 ms binning (zoomed)
- 2 ms binning (zoomed)
- SN=5 or 10 s binning (full-time range)
- Raw light curve
Spectra
- 64 ms binning (zoomed)
- 16 ms binning (zoomed)
- 8 ms binning (zoomed)
- 2 ms binning (zoomed)
- SN=5 or 10 s binning (full-time range)
- Raw light curve
Spectra
Notes:
- 1) The fitting includes the systematic errors.
- 2) When the burst includes telescope slew time periods, the fitting uses an average response file made from multiple 5-s response files through out the slew time plus single time preiod for the non-slew times, and weighted by the total counts in the corresponding time period using addrmf. An average response file is needed becuase a spectral fit using the pre-slew DRM will introduce some errors in both a spectral shape and a normalization if the PHA file contains a lot of the slew/post-slew time interval.
- 3) For fits to more complicated models (e.g. a power-law over a cutoff power-law), the BAT team has decided to require a chi-square improvement of more than 6 for each extra dof.
Time averaged spectrum fit using the average DRM
Power-law model
Time interval is from  -13.280 sec. to  233.420 sec.

Spectral model in power-law:
------------------------------------------------------------
Parameters  : value       lower 90%   higher 90%
Photon index: -1.57131     ( -0.061027   0.0608669 )
Norm@50keV  : 2.31872E-03    ( -7.17833e-05   7.16844e-05 )
------------------------------------------------------------
#Fit statistic : Chi-Squared =          40.88 using 59 PHA bins.
# Reduced chi-squared =         0.7172 for     57 degrees of freedom
# Null hypothesis probability =   9.471233e-01

Photon flux (15-150 keV)    in 246.7 sec: 0.295389 ( -0.00982  0.009866 ) ph/cm2/s
Energy fluence (15-150 keV)             : 5.37007e-06 ( -1.78014e-07  1.78479e-07 ) ergs/cm2
Cutoff power-law model
Time interval is from  -13.280 sec. to  233.420 sec.
Spectral model in the cutoff power-law:
------------------------------------------------------------
Parameters  : value       lower 90%   higher 90%
Photon index: -1.57125     ( -0.0600781   0.112921 )
Epeak [keV] : 9999.36      ( -9999.36 -9999.36 )
Norm@50keV  : 2.31957E-03    ( -7.18398e-05   0.000467427 )
------------------------------------------------------------
#Fit statistic : Chi-Squared =          40.91 using 59 PHA bins.
# Reduced chi-squared =         0.7305 for     56 degrees of freedom
# Null hypothesis probability =   9.350110e-01

Photon flux (15-150 keV)    in 246.7 sec: 0.296809 ( -0.012541  0.009393 ) ph/cm2/s
Energy fluence (15-150 keV)             : 5.36896e-06 ( -1.63976e-07  1.78439e-07 ) ergs/cm2
1-s peak spectrum fit
Power-law model
Time interval is from   21.256 sec. to   22.256 sec.

Spectral model in power-law:
------------------------------------------------------------
Parameters  : value       lower 90%   higher 90%
Photon index: -1.13916     ( -0.107594   0.108224 )
Norm@50keV  : 2.41255E-02    ( -0.00138245   0.00138237 )
------------------------------------------------------------
#Fit statistic : Chi-Squared =          55.63 using 59 PHA bins.
# Reduced chi-squared =         0.9760 for     57 degrees of freedom
# Null hypothesis probability =   5.264739e-01

Photon flux (15-150 keV)    in 1 sec: 2.80998 ( -0.16529  0.16561 ) ph/cm2/s
Energy fluence (15-150 keV)             : 2.49201e-07 ( -1.62364e-08  1.63268e-08 ) ergs/cm2
Cutoff power-law model
Time interval is from   21.256 sec. to   22.256 sec.
Spectral model in the cutoff power-law:
------------------------------------------------------------
Parameters  : value       lower 90%   higher 90%
Photon index: -1.14038     ( -0.102924   0.114666 )
Epeak [keV] : 9999.36      ( -9999.36 -9999.36 )
Norm@50keV  : 2.42485E-02    ( -0.001389   0.00476322 )
------------------------------------------------------------
#Fit statistic : Chi-Squared =          55.70 using 59 PHA bins.
# Reduced chi-squared =         0.9947 for     56 degrees of freedom
# Null hypothesis probability =   4.861066e-01

Photon flux (15-150 keV)    in 1 sec: 2.82860 ( -0.18466  0.14623 ) ph/cm2/s
Energy fluence (15-150 keV)             : 2.49109e-07 ( -1.62463e-08  1.6321e-08 ) ergs/cm2
Time-resolved spectra
Distribution
T90 vs. Hardness ratio plot
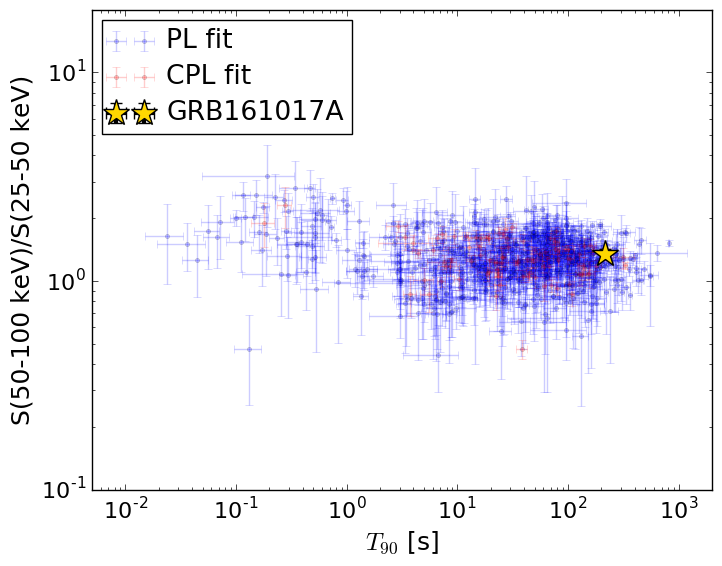
T90                                   = 217.048 sec.
Hardness ratio (energy fluence ratio) = 1.34604685489
S(15-50 keV) vs. S(50-150 keV) plot
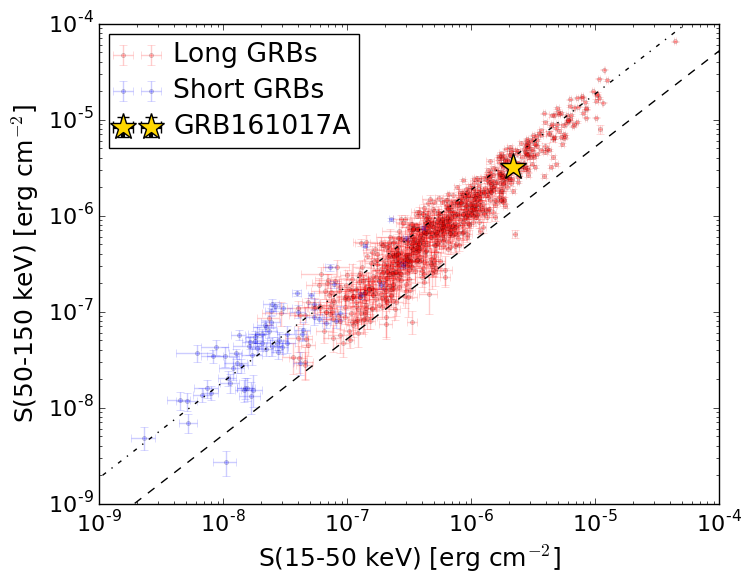
S(15-50 keV)  = 2.1549227e-06
S(50-150 keV) = 3.215105e-06
The dash-dotted line and the dashed line traces the fluences calculated from the Band function with Epeak = 15 and 150 keV, respectively. Both lines assume a canonical values of alpha = -1 and beta = -2.5.
Mask shadow pattern
IMX = 1.444179760002690E-01, IMY = 5.259572672914864E-02
Spacecraft aspect plot
Bright source in the pre-burst/pre-slew/post-slew images
Pre-burst image of 15-350 keV band
Time interval of the image:
-239.192000 -13.280000

# RAcent  DECcent POSerr Theta    Phi  PeakCts   SNR AngSep     Name
#  [deg]    [deg]    ['] [deg]  [deg]                   [']
290.4850  82.6007    2.7  44.5  163.9   1.8049   4.3 ------	UNKNOWN
261.8604  59.9910    2.3  57.8 -170.6   6.4663   5.1 ------	UNKNOWN
188.3119  55.3448    2.8  26.6 -137.3   0.8351   4.1 ------	UNKNOWN
215.7651  41.8992    3.4  48.5 -130.3   3.1908   3.4 ------	UNKNOWN
Pre-slew background subtracted image of 15-350 keV band
Time interval of the image:
-13.280000 16.108590

# RAcent  DECcent POSerr Theta    Phi  PeakCts   SNR AngSep     Name
#  [deg]    [deg]    ['] [deg]  [deg]                   [']
142.7660  43.1238    0.3   8.7  -20.0   1.9351  34.3 ------	UNKNOWN
180.0872  35.5990    2.2  30.8  -94.5   0.5456   5.3 ------	UNKNOWN
200.5499  35.8425    2.6  43.1 -113.3   1.1223   4.5 ------	UNKNOWN
Post-slew image of 15-350 keV band
Time interval of the image:
46.508600 659.408590

# RAcent  DECcent POSerr Theta    Phi  PeakCts   SNR AngSep     Name
#  [deg]    [deg]    ['] [deg]  [deg]                   [']
 78.4399  61.4170    3.1  41.3  111.3   6.5017   3.7 ------	UNKNOWN
 96.4018  49.6094    2.9  32.1   90.2   3.0861   4.0 ------	UNKNOWN
338.0490  87.8338    3.1  49.0  151.3   5.5085   3.7 ------	UNKNOWN
113.6721  73.9020    2.9  33.5  138.0   2.2043   3.9 ------	UNKNOWN
115.9905  -6.4759    2.8  55.2    5.1   7.1582   4.2 ------	UNKNOWN
142.7544  43.1184    0.9   0.0  -38.3   4.8934  12.5 ------	UNKNOWN
135.5068  -7.3431    2.3  50.9  -18.6   4.0846   5.0 ------	UNKNOWN
204.5400  34.2098    3.6  48.0 -129.0   5.8264   3.2 ------	UNKNOWN
154.1105  -7.9277    3.5  52.1  -42.2   6.8922   3.3 ------	UNKNOWN