Analysis Summary
Notes:
- 1) No attempt has been made to eliminate the non-significant decimal places.
- 2) This batgrbproduct analysis is done using the HEASARC data.
- 3) This batgrbproduct analysis is using the flight position for the mask-weighting calculation.
======================================================================
                  BAT GRB EVENT DATA PROCESSING REPORT
    Process Script Ver: batgrbproduct v2.46
    Process Start Time: Sun Dec  4 15:23:55 EST 2016
             Host Name: bat1
   Current Working Dir: /local/data/bat1/alien/Swift_3rdBATcatalog/event/batevent_reproc/trigger722604
======================================================================

  Trigger: 00722604      Segment: 000

  BAT Trigger Time: 501039353.856   [s; MET]
      Trigger Stop: 501039354.88   [s; MET]
               UTC: 2016-11-17T01:35:36.685460    [includes UTCF correction]
       Where From?: TDRSS position message

  BAT
    RA: 322.070183555621   Dec: -29.629062738768  [deg; J2000]

     Catalogged Source?: NO
     Point Source?:      YES
     GRB Indicated?:     YES    [ by BAT flight software ]
     Image S/N Ratio:    19.39
     Image Trigger?:     NO
     Rate S/N Ratio:     65.5209890035247  [ if not an image trigger ]
     Image S/N Ratio:    19.39

  Analysis Position:   [ source = BAT ]
    RA: 322.070183555621   Dec: -29.629062738768  [deg; J2000]

  Refined Position:   [ source = BAT pre-slew burst ]
    RA: 322.052476301016   Dec: -29.6103324860122  [deg; J2000]
        { 21h 28m 12.6s , -29d 36' 37.2" }
         +/- 0.582240065175013 [arcmin] (estimated 90% radius based on SNR)
         +/- 0.203809376258581 [arcmin] (formal 1-sigma fit error)
    SNR: 65.869873186728

  Angular difference between the analysis and refined position is 1.454648 arcmin

  Partial Coding Fraction: 1.015625    [ including projection effects ]

  Duration
     T90: 125.699999928474 +/- 1.09337644623115
        Measured from: 1.58399999141693
                   to: 127.283999919891     [s; relative to TRIGTIME]
     T50: 74.5439999103546 +/- 0.556345192965492
        Measured from: 37.8040000200272
                   to: 112.347999930382     [s; relative to TRIGTIME]


  Fluence
     Peak Flux  (peak 1 second)
        Measured from: 110.995999991894
                   to: 111.995999991894     [s; relative to TRIGTIME]
     Total Fluence
        Measured from: -5.99599999189377
                   to: 154.43599998951     [s; relative to TRIGTIME]

             Band 1     Band 2     Band 3     Band 4
              15-25      25-50     50-100    100-350     keV
 Total    11.242242  14.920983   9.352851   1.468000
           0.086115   0.092706   0.078934   0.059793 [error]
 Peak      0.265268   0.331778   0.204678   0.032095
           0.009417   0.010346   0.008431   0.005188 [error]

     [ fluence units of on-axis counts / fully illuminated detector ]

======================================================================


====== Table of the duration information =============================

        Value   tstart    tstop
T100  160.432   -5.996  154.436
T90   125.700    1.584  127.284
T50    74.544   37.804  112.348
Peak    1.000  110.996  111.996


====== Spectral Analysis Summary =====================================

Model      : spectral model: simple power-law (PL) and cutoff power-law (CPL)
Ph_index   : photon index: E^{Ph_index}
Ph_90err   : 90% error of the photon index
Epeak      : Epeak in keV
Epeak_90err: 90% error of Epeak
Norm       : normalization at 50 keV in both the PL model and CPL model
Nomr_90err : 90% error of the normalization
chi2       : Chi-Squared
dof        : degree of freedo

=== Time-averaged spectral analysis ===
(Best model with acceptable fit: CPL)

Model Ph_index Ph_90err_low Ph_90err_hi  Epeak  Epeak_90err_low  Epeak_90err_hi  Norm       Nomr_90err_low    Norm_90err_hi    chi2    dof
PL      -1.828     N/A       N/A          -           -               -         1.42e-02        N/A               N/A        122.030   57
CPL     -1.200    -0.120      0.123       73.052      -3.710         4.797      2.67e-02     -2.94e-03          3.39e-03      34.640   56


=== 1-s peak spectral analysis ===
(Best model with acceptable fit: PL)

Model Ph_index Ph_90err_low Ph_90err_hi  Epeak  Epeak_90err_low  Epeak_90err_hi  Norm       Nomr_90err_low    Norm_90err_hi    chi2    dof
PL      -1.774     -0.069     0.068       -           -               -         4.99e-02     -2.01e-03          2.00e-03      52.160   57
CPL     -1.300     -0.275     0.293       73.441     -11.840        33.599      8.67e-02     -2.32e-02          3.44e-02      43.120   56


=== Fluence/Peak Flux Summary ===

              Model    Band1     Band2     Band3     Band4     Band5     Total
                       15-25     25-50    50-100    100-350    15-150    15-350    keV
Fluence         PL   3.97e-06  5.97e-06  6.73e-06  1.44e-05  2.10e-05  3.11e-05   erg/cm2
      90%_error_low    N/A       N/A       N/A       N/A       N/A       N/A      erg/cm2
      90%_error_hi     N/A       N/A       N/A       N/A       N/A       N/A      erg/cm2
Peak flux       PL   2.68e+00  2.29e+00  1.34e+00  1.17e+00  6.81e+00  7.47e+00   ph/cm2/s
      90%_error_low -1.74e-01 -9.28e-02 -6.85e-02 -1.17e-01 -2.75e-01 -2.86e-01   ph/cm2/s
      90%_error_hi   1.77e-01  9.25e-02  6.83e-02  1.24e-01  2.76e-01  2.86e-01   ph/cm2/s

Fluence        CPL   3.32e-06  6.09e-06  7.12e-06  7.74e-06  2.02e-05  2.43e-05   erg/cm2
      90%_error_low -1.55e-07 -1.12e-07 -1.29e-07 -7.63e-07 -3.26e-07 -8.39e-07   erg/cm2
      90%_error_hi   1.58e-07  1.12e-07  1.30e-07  8.70e-07  3.26e-07  9.34e-07   erg/cm2
Peak flux      CPL     N/A      N/A      N/A      N/A      N/A      N/A     ph/cm2/s
      90%_error_low -1.74e-01 -9.28e-02 -6.85e-02 -1.17e-01 -2.75e-01 -2.86e-01   ph/cm2/s
      90%_error_hi   1.77e-01  9.25e-02  6.83e-02  1.24e-01  2.76e-01  2.86e-01   ph/cm2/s

======================================================================
Image
Pre-slew 15.0-350.0 keV image (Event data)
#   RAcent    DECcent   POSerr    Theta     Phi              Peak Cts       SNR   Name
  322.0525   -29.6103   0.0029    12.3527  -172.9403         4.4081526     65.870 TRIG_00722604

Foreground time interval of the image:
 -5.996  11.645 (delta_t =  17.641 [sec])
Background time interval of the image:
-72.955  -5.996 (delta_t =  66.959 [sec])
Light Curves
Note: The mask-weighted lightcurves have units of either count/det or counts/sec/det, where a det is 0.4 x 0.4 = 0.16 sq cm.
Full-time range; 1 s binning
Other quick-look light curves:
- 64 ms binning (zoomed)
- 16 ms binning (zoomed)
- 8 ms binning (zoomed)
- 2 ms binning (zoomed)
- SN=5 or 10 s binning (full-time range)
- Raw light curve
Spectra
- 64 ms binning (zoomed)
- 16 ms binning (zoomed)
- 8 ms binning (zoomed)
- 2 ms binning (zoomed)
- SN=5 or 10 s binning (full-time range)
- Raw light curve
Spectra
Notes:
- 1) The fitting includes the systematic errors.
- 2) When the burst includes telescope slew time periods, the fitting uses an average response file made from multiple 5-s response files through out the slew time plus single time preiod for the non-slew times, and weighted by the total counts in the corresponding time period using addrmf. An average response file is needed becuase a spectral fit using the pre-slew DRM will introduce some errors in both a spectral shape and a normalization if the PHA file contains a lot of the slew/post-slew time interval.
- 3) For fits to more complicated models (e.g. a power-law over a cutoff power-law), the BAT team has decided to require a chi-square improvement of more than 6 for each extra dof.
Time averaged spectrum fit using the average DRM
Power-law model
Time interval is from   -5.996 sec. to  154.436 sec.

Spectral model in power-law:
------------------------------------------------------------
Parameters  : value       lower 90%   higher 90%
Photon index: -1.82769     (       )
Norm@50keV  : 1.42267E-02    (     )
------------------------------------------------------------
#Fit statistic : Chi-Squared =         122.03 using 59 PHA bins.
# Reduced chi-squared =         2.1408 for     57 degrees of freedom
# Null hypothesis probability =   1.240448e-06

Photon flux (15-150 keV)    in 160.4 sec: 1.98196 (    ) ph/cm2/s
Energy fluence (15-150 keV)             : 2.0994e-05 ( 0  0 ) ergs/cm2
Cutoff power-law model
Time interval is from   -5.996 sec. to  154.436 sec.
Spectral model in the cutoff power-law:
------------------------------------------------------------
Parameters  : value       lower 90%   higher 90%
Photon index: -1.2003     ( -0.119758   0.122674 )
Epeak [keV] : 73.0521      ( -3.70999 4.7972 )
Norm@50keV  : 2.66722E-02    ( -0.00294443   0.00338964 )
------------------------------------------------------------
#Fit statistic : Chi-Squared =          34.64 using 59 PHA bins.
# Reduced chi-squared =         0.6185 for     56 degrees of freedom
# Null hypothesis probability =   9.889438e-01

Photon flux (15-150 keV)    in 160.4 sec: 1.85653 ( -0.04161  0.04198 ) ph/cm2/s
Energy fluence (15-150 keV)             : 2.02173e-05 ( -3.25484e-07  3.25726e-07 ) ergs/cm2
1-s peak spectrum fit
Power-law model
Time interval is from  110.996 sec. to  111.996 sec.

Spectral model in power-law:
------------------------------------------------------------
Parameters  : value       lower 90%   higher 90%
Photon index: -1.77441     ( -0.0685205   0.0678074 )
Norm@50keV  : 4.99134E-02    ( -0.00200951   0.00200295 )
------------------------------------------------------------
#Fit statistic : Chi-Squared =          52.16 using 59 PHA bins.
# Reduced chi-squared =         0.9151 for     57 degrees of freedom
# Null hypothesis probability =   6.568476e-01

Photon flux (15-150 keV)    in 1 sec: 6.81125 ( -0.27545  0.27596 ) ph/cm2/s
Energy fluence (15-150 keV)             : 4.60055e-07 ( -1.8952e-08  1.90161e-08 ) ergs/cm2
Cutoff power-law model
Time interval is from  110.996 sec. to  111.996 sec.
Spectral model in the cutoff power-law:
------------------------------------------------------------
Parameters  : value       lower 90%   higher 90%
Photon index: -1.30001     ( -0.275209   0.292841 )
Epeak [keV] : 73.4409      ( -11.8397 33.5995 )
Norm@50keV  : 8.66748E-02    ( -0.0232434   0.0343686 )
------------------------------------------------------------
#Fit statistic : Chi-Squared =          43.12 using 59 PHA bins.
# Reduced chi-squared =         0.7700 for     56 degrees of freedom
# Null hypothesis probability =   8.962879e-01

Photon flux (15-150 keV)    in 1 sec:  (    ) ph/cm2/s
Energy fluence (15-150 keV)             : 0 ( 0  0 ) ergs/cm2
Time-resolved spectra
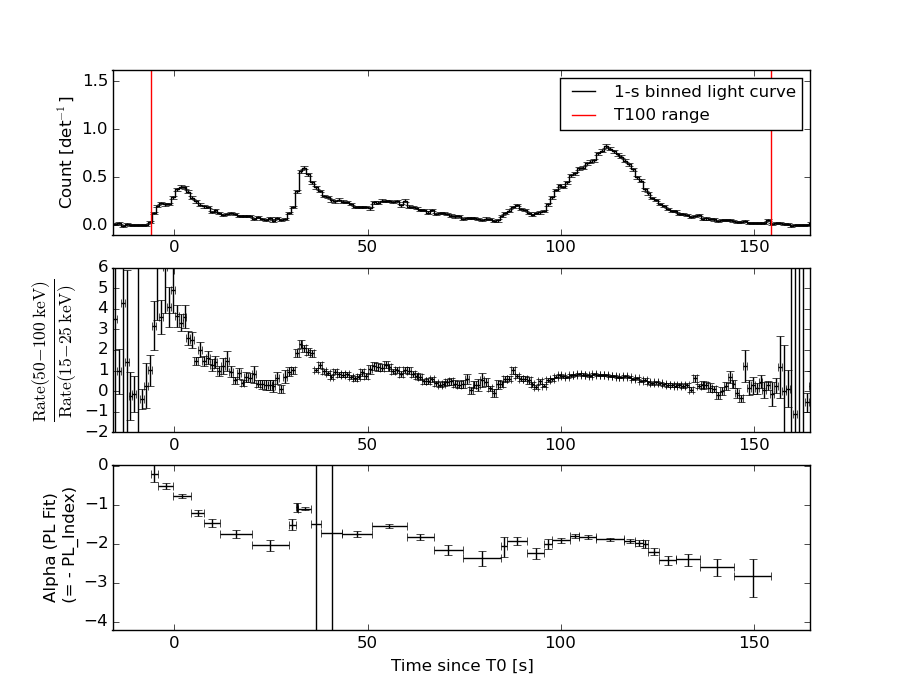
Distribution
T90 vs. Hardness ratio plot
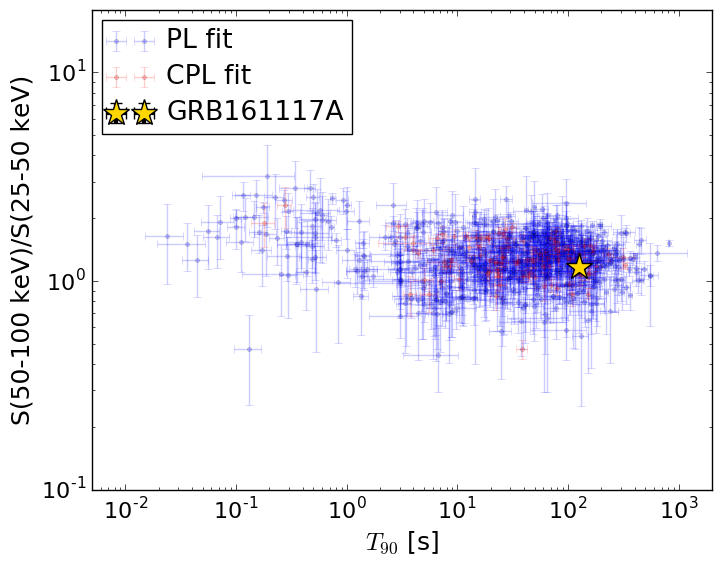
T90                                   = 125.7 sec.
Hardness ratio (energy fluence ratio) = 1.16912240009
S(15-50 keV) vs. S(50-150 keV) plot
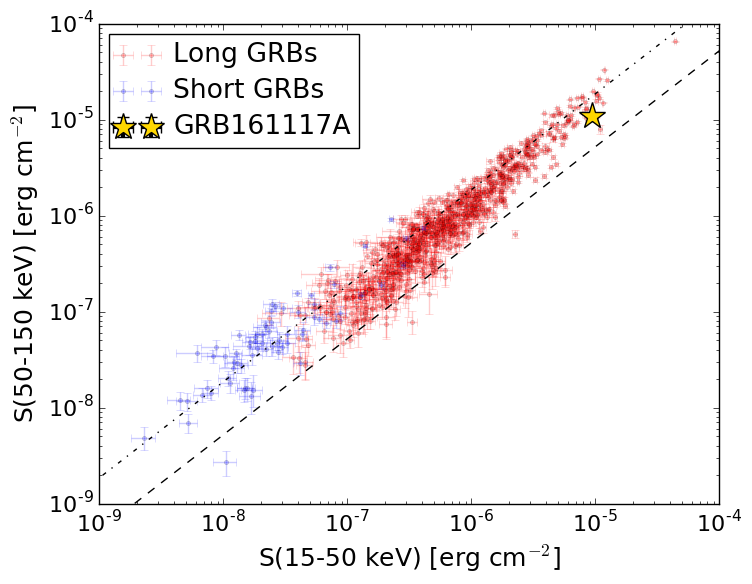
S(15-50 keV)  = 9.407165e-06
S(50-150 keV) = 1.081007e-05
The dash-dotted line and the dashed line traces the fluences calculated from the Band function with Epeak = 15 and 150 keV, respectively. Both lines assume a canonical values of alpha = -1 and beta = -2.5.
Mask shadow pattern
IMX = -2.173391656766071E-01, IMY = 2.691597681904080E-02
Spacecraft aspect plot
Bright source in the pre-burst/pre-slew/post-slew images
Pre-burst image of 15-350 keV band
Time interval of the image:
-72.955380 -5.996000

# RAcent  DECcent POSerr Theta    Phi  PeakCts   SNR AngSep     Name
#  [deg]    [deg]    ['] [deg]  [deg]                   [']
274.1620 -14.0791    6.7  41.5  -64.2  -0.5223  -1.7    9.4	GX 17+2
275.9782 -30.2419   29.6  39.4  -89.2   0.1681   0.4    8.0	H1820-303
284.9509 -24.8724    8.1  30.8  -81.7   0.2214   1.4    5.5	HT1900.1-2455
288.8902  11.0464    4.9  40.4  -19.2   0.3147   2.3    8.1	GRS 1915+105
299.5392  35.1909    5.7  55.8    9.3   1.0301   2.0    2.6	Cyg X-1
287.3058  -5.2671    2.3  31.9  -43.3   0.6037   4.9 ------	UNKNOWN
Pre-slew background subtracted image of 15-350 keV band
Time interval of the image:
-5.996000 11.644600

# RAcent  DECcent POSerr Theta    Phi  PeakCts   SNR AngSep     Name
#  [deg]    [deg]    ['] [deg]  [deg]                   [']
273.9667 -13.9223    5.6  41.8  -64.0  -0.5154  -2.1    7.2	GX 17+2
276.0876 -30.2941   28.0  39.3  -89.3   0.1214   0.4    9.5	H1820-303
285.2258 -24.9953    9.1  30.5  -82.0  -0.1471  -1.3   11.3	HT1900.1-2455
288.7427  10.8917   10.5  40.4  -19.6   0.1152   1.1    4.6	GRS 1915+105
299.6619  35.1768    6.3  55.8    9.4   0.7714   1.8    3.8	Cyg X-1
 13.9687 -42.0948    2.7  53.5  156.3   1.7484   4.2 ------	UNKNOWN
322.0624  15.4632    2.4  33.8   35.1   0.5377   4.7 ------	UNKNOWN
322.0525 -29.6103    0.2  12.4 -172.9   4.4076  65.9 ------	UNKNOWN
295.3913 -16.4626    2.4  21.0  -62.2   0.3745   4.8 ------	UNKNOWN
Post-slew image of 15-350 keV band
Time interval of the image:
49.644600 962.239400

# RAcent  DECcent POSerr Theta    Phi  PeakCts   SNR AngSep     Name
#  [deg]    [deg]    ['] [deg]  [deg]                   [']
275.9536 -30.3614  202.7  39.7  -86.4   0.1832   0.1    1.5	H1820-303
284.8802 -24.7979    0.0  33.3  -74.2  -1.4916  -1.2   11.2	HT1900.1-2455
288.7416  10.8797    3.7  51.7  -26.9   5.3663   3.1    5.2	GRS 1915+105
 32.2401 -60.1284    2.4  54.9  161.6  22.1191   4.9 ------	UNKNOWN
322.0588 -29.6136    0.3   0.0  -77.5  25.0906  43.3 ------	UNKNOWN
309.9942   3.4825    2.9  35.1   -4.7   3.0256   4.0 ------	UNKNOWN
286.9688 -79.2873    2.9  51.9 -155.6   7.4099   4.0 ------	UNKNOWN