Analysis Summary
Notes:
- 1) No attempt has been made to eliminate the non-significant decimal places.
- 2) This batgrbproduct analysis is done using the HEASARC data.
- 3) This batgrbproduct analysis is using the flight position for the mask-weighting calculation.
======================================================================
BAT GRB EVENT DATA PROCESSING REPORT
Process Script Ver: batgrbproduct v2.46
Process Start Time: Sun Mar 17 22:24:36 EDT 2019
Host Name: bat1
Current Working Dir: /local/data/bat1/alien/Swift_3rdBATcatalog/event/batevent_reproc/trigger889785
======================================================================
Trigger: 00889785 Segment: 000
BAT Trigger Time: 572324397.12 [s; MET]
Trigger Stop: 572324398.144 [s; MET]
UTC: 2019-02-20T02:59:34.673220 [includes UTCF correction]
Where From?: TDRSS position message
BAT
RA: 330.142349349267 Dec: -76.6910121240364 [deg; J2000]
Catalogged Source?: NO
Point Source?: YES
GRB Indicated?: YES [ by BAT flight software ]
Image S/N Ratio: 9.05
Image Trigger?: NO
Rate S/N Ratio: 14.560219778561 [ if not an image trigger ]
Image S/N Ratio: 9.05
Analysis Position: [ source = BAT ]
RA: 330.142349349267 Dec: -76.6910121240364 [deg; J2000]
Refined Position: [ source = BAT pre-slew burst ]
RA: 330.135316423617 Dec: -76.6701948837738 [deg; J2000]
{ 22h 00m 32.5s , -76d 40' 12.7" }
+/- 1.27494371989389 [arcmin] (estimated 90% radius based on SNR)
+/- 0.465767168414482 [arcmin] (formal 1-sigma fit error)
SNR: 21.4989342426043
Angular difference between the analysis and refined position is 1.252812 arcmin
Partial Coding Fraction: 0.46875 [ including projection effects ]
Duration
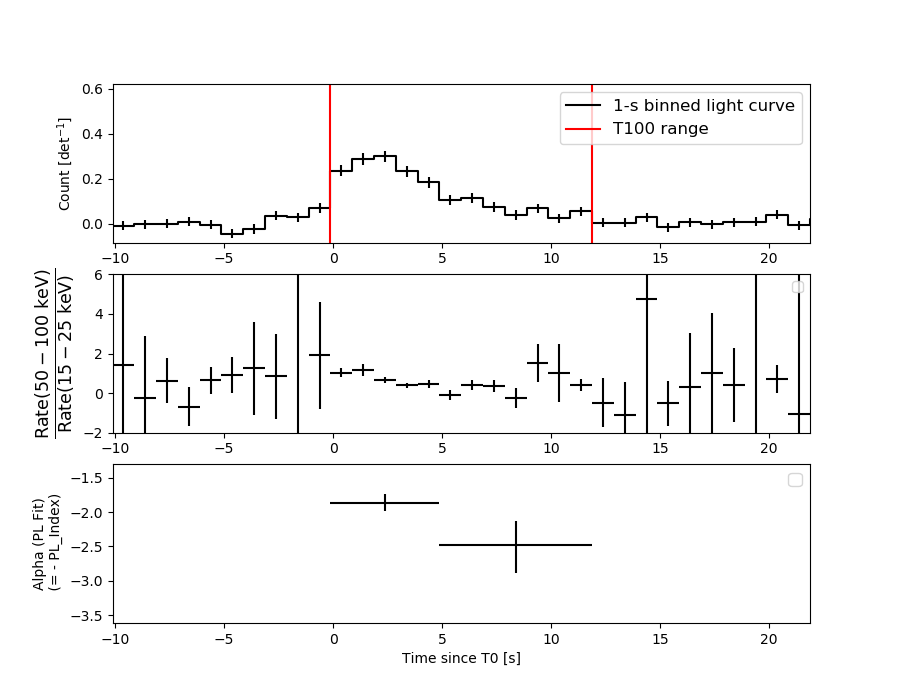
T90: 10 +/- 2
Measured from: -0.120000004768372
to: 9.87999999523163 [s; relative to TRIGTIME]
T50: 4 +/- 1
Measured from: 0.879999995231628
to: 4.87999999523163 [s; relative to TRIGTIME]
Fluence
Peak Flux (peak 1 second)
Measured from: 1.87999999523163
to: 2.87999999523163 [s; relative to TRIGTIME]
Total Fluence
Measured from: -0.120000004768372
to: 11.8799999952316 [s; relative to TRIGTIME]
Band 1 Band 2 Band 3 Band 4
15-25 25-50 50-100 100-350 keV
Total 0.583769 0.747544 0.350657 0.044812
0.040959 0.043984 0.037356 0.032845 [error]
Peak 0.088594 0.144092 0.059181 0.008910
0.011844 0.014862 0.012213 0.009664 [error]
[ fluence units of on-axis counts / fully illuminated detector ]
======================================================================
====== Table of the duration information =============================
Value tstart tstop
T100 12.000 -0.120 11.880
T90 10.000 -0.120 9.880
T50 4.000 0.880 4.880
Peak 1.000 1.880 2.880
====== Spectral Analysis Summary =====================================
Model : spectral model: simple power-law (PL) and cutoff power-law (CPL)
Ph_index : photon index: E^{Ph_index}
Ph_90err : 90% error of the photon index
Epeak : Epeak in keV
Epeak_90err: 90% error of Epeak
Norm : normalization at 50 keV in both the PL model and CPL model
Nomr_90err : 90% error of the normalization
chi2 : Chi-Squared
dof : degree of freedo
=== Time-averaged spectral analysis ===
(Best model with acceptable fit: N/A)
Model Ph_index Ph_90err_low Ph_90err_hi Epeak Epeak_90err_low Epeak_90err_hi Norm Nomr_90err_low Norm_90err_hi chi2 dof
PL -2.031 -0.138 0.133 - - - 8.89e-03 -8.10e-04 7.99e-04 90.690 57
CPL -0.775 -0.709 0.862 40.095 -6.282 7.014 4.73e-02 -2.87e-02 1.05e-01 80.300 56
=== 1-s peak spectral analysis ===
(Best model with acceptable fit: N/A)
Model Ph_index Ph_90err_low Ph_90err_hi Epeak Epeak_90err_low Epeak_90err_hi Norm Nomr_90err_low Norm_90err_hi chi2 dof
PL -1.870 -0.226 0.212 - - - 1.80e-02 -2.92e-03 2.87e-03 79.610 57
CPL 0.501 -1.423 2.265 43.210 -6.178 10.543 4.38e-01 -4.38e-01 9.81e+00 69.490 56
=== Fluence/Peak Flux Summary ===
Model Band1 Band2 Band3 Band4 Band5 Total
15-25 25-50 50-100 100-350 15-150 15-350 keV
Fluence PL 2.25e-07 2.99e-07 2.93e-07 5.14e-07 9.85e-07 1.33e-06 erg/cm2
90%_error_low -2.34e-08 -2.21e-08 -3.59e-08 -1.15e-07 -8.37e-08 -1.57e-07 erg/cm2
90%_error_hi 2.39e-08 2.21e-08 3.63e-08 1.34e-07 8.48e-08 1.72e-07 erg/cm2
Peak flux PL 1.06e+00 8.57e-01 4.69e-01 3.76e-01 2.55e+00 2.76e+00 ph/cm2/s
90%_error_low -1.93e-01 -1.17e-01 -9.53e-02 -1.26e-01 -3.49e-01 -3.83e-01 ph/cm2/s
90%_error_hi 1.99e-01 1.17e-01 9.60e-02 1.55e-01 3.49e-01 3.84e-01 ph/cm2/s
Fluence CPL 2.01e-07 3.43e-07 2.71e-07 8.70e-08 8.82e-07 9.02e-07 erg/cm2
90%_error_low -2.72e-08 -3.24e-08 -4.94e-08 -5.44e-08 -9.23e-08 -1.07e-07 erg/cm2
90%_error_hi 2.74e-08 3.35e-08 4.55e-08 1.27e-07 9.79e-08 1.54e-07 erg/cm2
Peak flux CPL 8.67e-01 1.13e+00 4.45e-01 3.48e-02 2.47e+00 2.47e+00 ph/cm2/s
90%_error_low -2.33e-01 -1.95e-01 -1.56e-01 -3.48e-02 -3.52e-01 -3.54e-01 ph/cm2/s
90%_error_hi 2.33e-01 2.11e-01 1.35e-01 1.04e-01 3.53e-01 3.57e-01 ph/cm2/s
======================================================================
Image
Pre-slew 15.0-350.0 keV image (Event data)
#   RAcent    DECcent   POSerr    Theta     Phi              Peak Cts       SNR   Name
  330.1353   -76.6702   0.0090    38.1911  -143.3517         1.7453922     21.499 TRIG_00889785

Foreground time interval of the image:
 -0.120  10.381 (delta_t =  10.501 [sec])
Background time interval of the image:
-239.120  -0.120 (delta_t = 239.000 [sec])
Light Curves
Note: The mask-weighted lightcurves have units of either count/det or counts/sec/det, where a det is 0.4 x 0.4 = 0.16 sq cm.
Full-time range; 1 s binning
Other quick-look light curves:
- 64 ms binning (zoomed)
- 16 ms binning (zoomed)
- 8 ms binning (zoomed)
- 2 ms binning (zoomed)
- SN=5 or 10 s binning (full-time range)
- Raw light curve
Spectra
- 64 ms binning (zoomed)
- 16 ms binning (zoomed)
- 8 ms binning (zoomed)
- 2 ms binning (zoomed)
- SN=5 or 10 s binning (full-time range)
- Raw light curve
Spectra
Notes:
- 1) The fitting includes the systematic errors.
- 2) When the burst includes telescope slew time periods, the fitting uses an average response file made from multiple 5-s response files through out the slew time plus single time preiod for the non-slew times, and weighted by the total counts in the corresponding time period using addrmf. An average response file is needed becuase a spectral fit using the pre-slew DRM will introduce some errors in both a spectral shape and a normalization if the PHA file contains a lot of the slew/post-slew time interval.
- 3) For fits to more complicated models (e.g. a power-law over a cutoff power-law), the BAT team has decided to require a chi-square improvement of more than 6 for each extra dof.
Time averaged spectrum fit using the average DRM
Power-law model
Time interval is from   -0.120 sec. to   11.880 sec.

Spectral model in power-law:
------------------------------------------------------------
Parameters  : value       lower 90%   higher 90%
Photon index: -2.03061     ( -0.137789   0.132559 )
Norm@50keV  : 8.88649E-03    ( -0.000809824   0.000798624 )
------------------------------------------------------------
#Fit statistic : Chi-Squared =          90.69 using 59 PHA bins.
# Reduced chi-squared =          1.591 for     57 degrees of freedom
# Null hypothesis probability =   3.007259e-03

Photon flux (15-150 keV)    in 12 sec: 1.35219 ( -0.10071  0.10077 ) ph/cm2/s
Energy fluence (15-150 keV)             : 9.85374e-07 ( -8.3738e-08  8.47922e-08 ) ergs/cm2
Cutoff power-law model
Time interval is from   -0.120 sec. to   11.880 sec.
Spectral model in the cutoff power-law:
------------------------------------------------------------
Parameters  : value       lower 90%   higher 90%
Photon index: -0.775417     ( -0.70867   0.861485 )
Epeak [keV] : 40.0953      ( -6.28147 7.01425 )
Norm@50keV  : 4.73217E-02    ( -0.028753   0.105022 )
------------------------------------------------------------
#Fit statistic : Chi-Squared =          80.30 using 59 PHA bins.
# Reduced chi-squared =          1.434 for     56 degrees of freedom
# Null hypothesis probability =   1.829973e-02

Photon flux (15-150 keV)    in 12 sec: 1.29015 ( -0.10546  0.10589 ) ph/cm2/s
Energy fluence (15-150 keV)             : 8.81681e-07 ( -9.23279e-08  9.79474e-08 ) ergs/cm2
1-s peak spectrum fit
Power-law model
Time interval is from    1.880 sec. to    2.880 sec.

Spectral model in power-law:
------------------------------------------------------------
Parameters  : value       lower 90%   higher 90%
Photon index: -1.8697     ( -0.226112   0.211614 )
Norm@50keV  : 1.80287E-02    ( -0.0029241   0.00286686 )
------------------------------------------------------------
#Fit statistic : Chi-Squared =          79.61 using 59 PHA bins.
# Reduced chi-squared =          1.397 for     57 degrees of freedom
# Null hypothesis probability =   2.563886e-02

Photon flux (15-150 keV)    in 1 sec: 2.55482 ( -0.34886  0.3489 ) ph/cm2/s
Energy fluence (15-150 keV)             : 1.65764e-07 ( -2.64291e-08  2.68687e-08 ) ergs/cm2
Cutoff power-law model
Time interval is from    1.880 sec. to    2.880 sec.
Spectral model in the cutoff power-law:
------------------------------------------------------------
Parameters  : value       lower 90%   higher 90%
Photon index: 0.501238     ( -1.43495   2.25263 )
Epeak [keV] : 43.2104      ( -6.12201 10.5987 )
Norm@50keV  : 0.437649    ( -0.45185   9.80023 )
------------------------------------------------------------
#Fit statistic : Chi-Squared =          69.49 using 59 PHA bins.
# Reduced chi-squared =          1.241 for     56 degrees of freedom
# Null hypothesis probability =   1.062866e-01

Photon flux (15-150 keV)    in 1 sec: 2.47245 ( -0.35215  0.35269 ) ph/cm2/s
Energy fluence (15-150 keV)             : 1.43747e-07 ( -2.53284e-08  2.82021e-08 ) ergs/cm2
Time-resolved spectra
Distribution
T90 vs. Hardness ratio plot
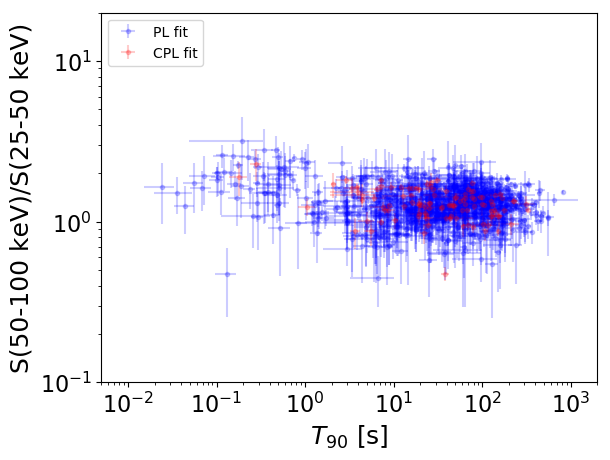
T90                                   = N/A sec.
Hardness ratio (energy fluence ratio) = N/A
S(15-50 keV) vs. S(50-150 keV) plot
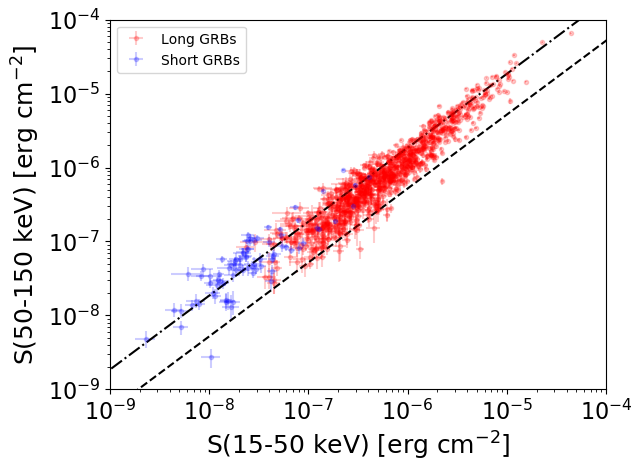
S(15-50 keV)  = N/A
S(50-150 keV) = N/A
The dash-dotted line and the dashed line traces the fluences calculated from the Band function with Epeak = 15 and 150 keV, respectively. Both lines assume a canonical values of alpha = -1 and beta = -2.5.
Mask shadow pattern
IMX = -6.311577760349268E-01, IMY = 4.695657479227315E-01
Spacecraft aspect plot
Bright source in the pre-burst/pre-slew/post-slew images
Pre-burst image of 15-350 keV band
Time interval of the image:
-239.120000 -0.120000

# RAcent  DECcent POSerr Theta    Phi  PeakCts   SNR AngSep     Name
#  [deg]    [deg]    ['] [deg]  [deg]                   [']
170.1571 -60.6493    5.1  44.8  151.7  -1.8807  -2.3    4.9	Cen X-3
186.9112 -62.7407    3.8  49.0  161.3   2.7952   3.1    7.2	GX 301-2
 86.4758  -5.6580    3.0  52.3   29.8   5.0467   3.9 ------	UNKNOWN
180.1996 -58.1628    2.5  50.2  154.0   4.7202   4.6 ------	UNKNOWN
 95.1514 -44.3058    2.5  18.0   68.1   1.3296   4.5 ------	UNKNOWN
241.3735 -64.5817    2.6  57.7 -171.4   6.7074   4.4 ------	UNKNOWN
357.5974 -65.3765    2.8  35.6 -120.1   1.9191   4.1 ------	UNKNOWN
 19.3388 -35.8731    3.6  42.3  -68.9   4.0704   3.3 ------	UNKNOWN
Pre-slew background subtracted image of 15-350 keV band
Time interval of the image:
-0.120000 10.380600

# RAcent  DECcent POSerr Theta    Phi  PeakCts   SNR AngSep     Name
#  [deg]    [deg]    ['] [deg]  [deg]                   [']
170.5567 -60.6272    5.0  44.9  151.8  -0.3068  -2.3    7.1	Cen X-3
186.9598 -62.7142    9.0  49.1  161.3  -0.1933  -1.3    9.0	GX 301-2
 80.7240  -5.2503    1.9  52.2   22.6   1.0534   6.1 ------	UNKNOWN
205.0691 -60.1765    2.3  56.2  168.2   1.3274   5.0 ------	UNKNOWN
 64.4611 -14.1312    2.5  43.9    0.5   0.3670   4.7 ------	UNKNOWN
259.7251 -71.1364    2.2  51.6 -162.6   0.7326   5.1 ------	UNKNOWN
330.1354 -76.6702    0.5  38.2 -143.4   1.7453  21.5 ------	UNKNOWN
341.6834 -75.8537    2.4  36.2 -140.0   0.3546   4.8 ------	UNKNOWN
274.6603 -65.0998    2.5  56.8 -154.8   1.4722   4.5 ------	UNKNOWN
Post-slew image of 15-350 keV band
Time interval of the image:
67.380570 962.924600

# RAcent  DECcent POSerr Theta    Phi  PeakCts   SNR AngSep     Name
#  [deg]    [deg]    ['] [deg]  [deg]                   [']
186.6338 -62.9459    0.0  38.5  112.7   8.6627   1.2   10.6	GX 301-2
255.9228 -37.8050   13.7  49.8 -178.0   5.1486   0.8    3.8	4U 1700-377
256.5206 -36.3739    5.4  51.0 -176.8  14.2657   2.1    5.1	GX 349+2
264.8194 -44.4213    5.8  41.4 -171.8  -8.2012  -2.0    3.7	4U 1735-44
275.8834 -30.2616    5.7  52.7 -155.0  16.1880   2.0    6.7	H1820-303
262.9464 -33.9564   11.4  51.9 -169.5  -6.9889  -1.0    7.6	GX 354-0
 97.3418 -50.2838    2.9  48.7   44.3  28.8518   4.1 ------	UNKNOWN
221.3293 -47.9699    3.2  47.7  145.9  35.1117   3.6 ------	UNKNOWN