Analysis Summary
Notes:
- 1) No attempt has been made to eliminate the non-significant decimal places.
- 2) This batgrbproduct analysis is done using the HEASARC data.
- 3) This batgrbproduct analysis is using the flight position for the mask-weighting calculation.
======================================================================
BAT GRB EVENT DATA PROCESSING REPORT
Process Script Ver: batgrbproduct v2.46
Process Start Time: Thu Apr 11 00:03:29 EDT 2019
Host Name: bat1
Current Working Dir: /local/data/bat1/alien/Swift_3rdBATcatalog/event/batevent_reproc/trigger893808
======================================================================
Trigger: 00893808 Segment: 000
BAT Trigger Time: 574737299.2 [s; MET]
Trigger Stop: 574737307.392 [s; MET]
UTC: 2019-03-20T01:14:36.601140 [includes UTCF correction]
Where From?: TDRSS position message
BAT
RA: 117.8105857429 Dec: -45.8897753307729 [deg; J2000]
Catalogged Source?: NO
Point Source?: YES
GRB Indicated?: YES [ by BAT flight software ]
Image S/N Ratio: 7.63
Image Trigger?: NO
Rate S/N Ratio: 11.4455231422596 [ if not an image trigger ]
Image S/N Ratio: 7.63
Analysis Position: [ source = BAT ]
RA: 117.8105857429 Dec: -45.8897753307729 [deg; J2000]
Refined Position: [ source = BAT pre-slew burst ]
RA: 117.826815025873 Dec: -45.8779326989759 [deg; J2000]
{ 07h 51m 18.4s , -45d 52' 40.6" }
+/- 1.90802222886645 [arcmin] (estimated 90% radius based on SNR)
+/- 0.781744084583066 [arcmin] (formal 1-sigma fit error)
SNR: 12.0860645250273
Angular difference between the analysis and refined position is 0.982023 arcmin
Partial Coding Fraction: 0.296875 [ including projection effects ]
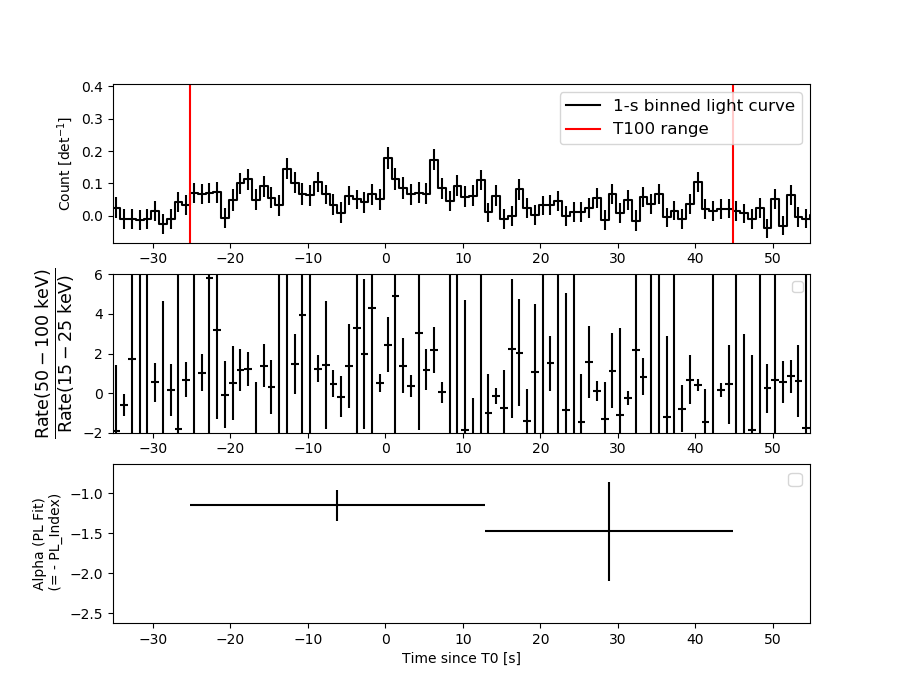
Duration
T90: 63 +/- 12.0830459735946
Measured from: -23.2000000476837
to: 39.7999999523163 [s; relative to TRIGTIME]
T50: 24 +/- 9.8488578017961
Measured from: -12.2000000476837
to: 11.7999999523163 [s; relative to TRIGTIME]
Fluence
Peak Flux (peak 1 second)
Measured from: -0.200000047683716
to: 0.799999952316284 [s; relative to TRIGTIME]
Total Fluence
Measured from: -25.2000000476837
to: 44.7999999523163 [s; relative to TRIGTIME]
Band 1 Band 2 Band 3 Band 4
15-25 25-50 50-100 100-350 keV
Total 0.719862 1.104909 1.397143 0.480562
0.142692 0.145610 0.125982 0.110195 [error]
Peak 0.035209 0.038800 0.086105 0.018330
0.018517 0.018366 0.016780 0.013357 [error]
[ fluence units of on-axis counts / fully illuminated detector ]
======================================================================
====== Table of the duration information =============================
Value tstart tstop
T100 70.000 -25.200 44.800
T90 63.000 -23.200 39.800
T50 24.000 -12.200 11.800
Peak 1.000 -0.200 0.800
====== Spectral Analysis Summary =====================================
Model : spectral model: simple power-law (PL) and cutoff power-law (CPL)
Ph_index : photon index: E^{Ph_index}
Ph_90err : 90% error of the photon index
Epeak : Epeak in keV
Epeak_90err: 90% error of Epeak
Norm : normalization at 50 keV in both the PL model and CPL model
Nomr_90err : 90% error of the normalization
chi2 : Chi-Squared
dof : degree of freedo
=== Time-averaged spectral analysis ===
(Best model with acceptable fit: PL)
Model Ph_index Ph_90err_low Ph_90err_hi Epeak Epeak_90err_low Epeak_90err_hi Norm Nomr_90err_low Norm_90err_hi chi2 dof
PL -1.220 -0.196 0.202 - - - 3.80e-03 -4.38e-04 4.35e-04 51.800 57
CPL -0.918 -0.398 0.910 221.131 -221.131 -221.131 5.06e-03 -1.95e-03 6.27e-03 51.360 56
=== 1-s peak spectral analysis ===
(Best model with acceptable fit: PL)
Model Ph_index Ph_90err_low Ph_90err_hi Epeak Epeak_90err_low Epeak_90err_hi Norm Nomr_90err_low Norm_90err_hi chi2 dof
PL -1.428 -0.611 0.586 - - - 1.06e-02 -3.74e-03 3.74e-03 68.340 57
CPL 7.634 -4.108 -7.634 70.359 -10.120 8.076 1.44e+01 -1.44e+01 4.02e+02 61.810 56
=== Fluence/Peak Flux Summary ===
Model Band1 Band2 Band3 Band4 Band5 Total
15-25 25-50 50-100 100-350 15-150 15-350 keV
Fluence PL 2.61e-07 5.70e-07 9.79e-07 3.88e-06 2.68e-06 5.69e-06 erg/cm2
90%_error_low -6.03e-08 -8.31e-08 -1.18e-07 -9.70e-07 -3.04e-07 -1.03e-06 erg/cm2
90%_error_hi 6.58e-08 8.16e-08 1.16e-07 1.18e-06 3.04e-07 1.20e-06 erg/cm2
Peak flux PL 4.08e-01 4.29e-01 3.19e-01 3.83e-01 1.30e+00 1.54e+00 ph/cm2/s
90%_error_low -2.30e-01 -1.78e-01 -1.27e-01 -2.41e-01 -4.89e-01 -5.41e-01 ph/cm2/s
90%_error_hi 2.98e-01 1.76e-01 1.23e-01 3.67e-01 5.02e-01 5.41e-01 ph/cm2/s
Fluence CPL 2.38e-07 5.76e-07 1.02e-06 2.80e-06 2.66e-06 4.88e-06 erg/cm2
90%_error_low -8.11e-08 -8.67e-08 -1.44e-07 -1.49e-06 -3.11e-07 -1.77e-06 erg/cm2
90%_error_hi 8.25e-08 8.70e-08 1.54e-07 1.39e-06 3.10e-07 7.97e-07 erg/cm2
Peak flux CPL 5.05e-03 1.86e-01 6.21e-01 3.78e-02 8.30e-01 8.30e-01 ph/cm2/s
90%_error_low -3.23e-03 -6.98e-02 -2.20e-01 -3.78e-02 -2.30e-01 -2.29e-01 ph/cm2/s
90%_error_hi 7.77e-02 2.38e-01 1.65e-01 8.40e-02 3.23e-01 3.26e-01 ph/cm2/s
======================================================================
Image
Pre-slew 15.0-350.0 keV image (Event data)
#   RAcent    DECcent   POSerr    Theta     Phi              Peak Cts       SNR   Name
  117.8268   -45.8779   0.0158    49.8054     3.7520         3.8570092     12.086 TRIG_00893808

Foreground time interval of the image:
-25.200  44.800 (delta_t =  70.000 [sec])
Background time interval of the image:
-239.200 -25.200 (delta_t = 214.000 [sec])
Light Curves
Note: The mask-weighted lightcurves have units of either count/det or counts/sec/det, where a det is 0.4 x 0.4 = 0.16 sq cm.
Full-time range; 1 s binning
Other quick-look light curves:
- 64 ms binning (zoomed)
- 16 ms binning (zoomed)
- 8 ms binning (zoomed)
- 2 ms binning (zoomed)
- SN=5 or 10 s binning (full-time range)
- Raw light curve
Spectra
- 64 ms binning (zoomed)
- 16 ms binning (zoomed)
- 8 ms binning (zoomed)
- 2 ms binning (zoomed)
- SN=5 or 10 s binning (full-time range)
- Raw light curve
Spectra
Notes:
- 1) The fitting includes the systematic errors.
- 2) When the burst includes telescope slew time periods, the fitting uses an average response file made from multiple 5-s response files through out the slew time plus single time preiod for the non-slew times, and weighted by the total counts in the corresponding time period using addrmf. An average response file is needed becuase a spectral fit using the pre-slew DRM will introduce some errors in both a spectral shape and a normalization if the PHA file contains a lot of the slew/post-slew time interval.
- 3) For fits to more complicated models (e.g. a power-law over a cutoff power-law), the BAT team has decided to require a chi-square improvement of more than 6 for each extra dof.
Time averaged spectrum fit using the average DRM
Power-law model
Time interval is from  -25.200 sec. to   44.800 sec.

Spectral model in power-law:
------------------------------------------------------------
Parameters  : value       lower 90%   higher 90%
Photon index: -1.22042     ( -0.196324   0.202436 )
Norm@50keV  : 3.79671E-03    ( -0.000438344   0.000434765 )
------------------------------------------------------------
#Fit statistic : Chi-Squared =          51.80 using 59 PHA bins.
# Reduced chi-squared =         0.9088 for     57 degrees of freedom
# Null hypothesis probability =   6.698382e-01

Photon flux (15-150 keV)    in 70 sec: 0.446982 ( -0.055991  0.056556 ) ph/cm2/s
Energy fluence (15-150 keV)             : 2.68138e-06 ( -3.0422e-07  3.04473e-07 ) ergs/cm2
Cutoff power-law model
Time interval is from  -25.200 sec. to   44.800 sec.
Spectral model in the cutoff power-law:
------------------------------------------------------------
Parameters  : value       lower 90%   higher 90%
Photon index: -0.917786     ( -0.398436   0.909618 )
Epeak [keV] : 221.131      ( -221.135 -221.135 )
Norm@50keV  : 5.05996E-03    ( -0.00194604   0.00627187 )
------------------------------------------------------------
#Fit statistic : Chi-Squared =          51.36 using 59 PHA bins.
# Reduced chi-squared =         0.9172 for     56 degrees of freedom
# Null hypothesis probability =   6.507826e-01

Photon flux (15-150 keV)    in 70 sec: 0.438935 ( -0.059747  0.059566 ) ph/cm2/s
Energy fluence (15-150 keV)             : 2.66096e-06 ( -3.10958e-07  3.09599e-07 ) ergs/cm2
1-s peak spectrum fit
Power-law model
Time interval is from   -0.200 sec. to    0.800 sec.

Spectral model in power-law:
------------------------------------------------------------
Parameters  : value       lower 90%   higher 90%
Photon index: -1.4283     ( -0.61119   0.58604 )
Norm@50keV  : 1.06214E-02    ( -0.00373834   0.00373816 )
------------------------------------------------------------
#Fit statistic : Chi-Squared =          68.34 using 59 PHA bins.
# Reduced chi-squared =          1.199 for     57 degrees of freedom
# Null hypothesis probability =   1.443969e-01

Photon flux (15-150 keV)    in 1 sec: 1.30204 ( -0.488792  0.50181 ) ph/cm2/s
Energy fluence (15-150 keV)             : 1.0207e-07 ( -3.70271e-08  3.72778e-08 ) ergs/cm2
Cutoff power-law model
Time interval is from   -0.200 sec. to    0.800 sec.
Spectral model in the cutoff power-law:
------------------------------------------------------------
Parameters  : value       lower 90%   higher 90%
Photon index: 9.99987     ( -6.47343   -9.99996 )
Epeak [keV] : 68.6168      ( -8.37877 9.81709 )
Norm@50keV  : 108.389    ( -108.188   307.708 )
------------------------------------------------------------
#Fit statistic : Chi-Squared =          60.91 using 59 PHA bins.
# Reduced chi-squared =          1.088 for     56 degrees of freedom
# Null hypothesis probability =   3.035969e-01

Photon flux (15-150 keV)    in 1 sec: 0.830355 ( -0.229918  0.322865 ) ph/cm2/s
Energy fluence (15-150 keV)             : 3.81075e-08 ( 0  0 ) ergs/cm2
Time-resolved spectra
Distribution
T90 vs. Hardness ratio plot
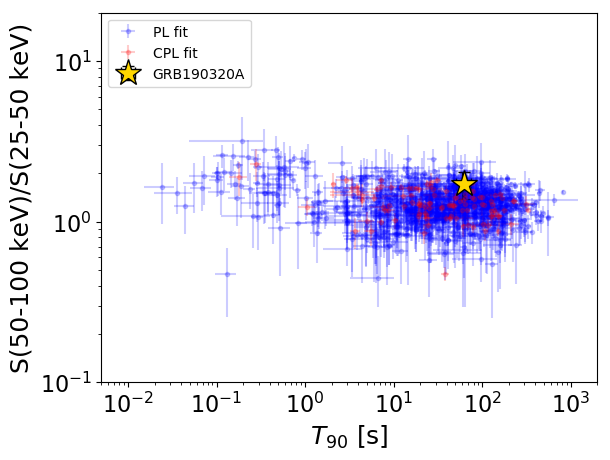
T90                                   = 63.0 sec.
Hardness ratio (energy fluence ratio) = 1.71668284964
S(15-50 keV) vs. S(50-150 keV) plot
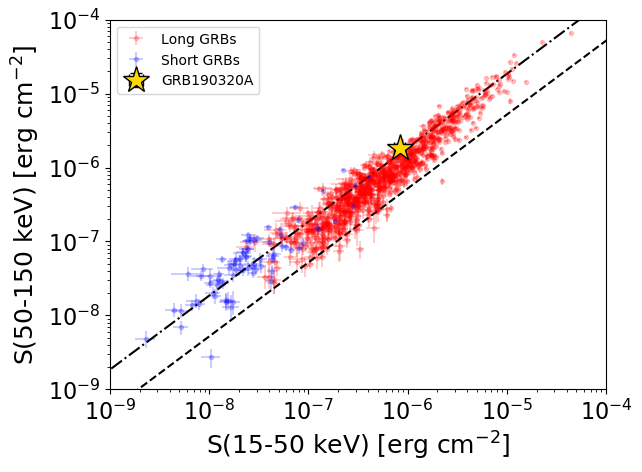
S(15-50 keV)  = 8.313607e-07
S(50-150 keV) = 1.8499852e-06
The dash-dotted line and the dashed line traces the fluences calculated from the Band function with Epeak = 15 and 150 keV, respectively. Both lines assume a canonical values of alpha = -1 and beta = -2.5.
Mask shadow pattern
IMX = 1.181030750815701E+00, IMY = -7.745111219418808E-02
Spacecraft aspect plot
Bright source in the pre-burst/pre-slew/post-slew images
Pre-burst image of 15-350 keV band
Time interval of the image:
-239.200000 -25.200000

# RAcent  DECcent POSerr Theta    Phi  PeakCts   SNR AngSep     Name
#  [deg]    [deg]    ['] [deg]  [deg]                   [']
135.5568 -40.5437    2.3  46.4   22.0   3.5083   5.0    1.4	Vela X-1
170.3144 -60.7013    3.3  17.2   19.9   0.9595   3.5    4.7	Cen X-3
186.9241 -62.6378    6.3   9.1   23.0   0.5409   1.8   10.8	GX 301-2
244.9775 -15.6369    1.7  54.4  164.8  11.1588   6.7    0.2	Sco X-1
256.0609 -38.0349    0.0  38.5 -169.2   0.4206   1.0   12.0	4U 1700-377
256.4978 -36.5337    6.4  39.9 -170.0   0.7993   1.8    7.3	GX 349+2
262.9529 -24.5680    8.4  53.1 -171.5  -1.2835  -1.4   11.1	GX 1+4
264.7181 -44.3887    6.0  37.2 -154.5  -0.7901  -1.9    3.8	4U 1735-44
270.3867 -25.0298    4.2  55.9 -164.0   3.1964   2.7    6.3	GX 5-1
270.4039 -25.7734    5.8  55.2 -163.5   2.2376   2.0    5.8	GRS 1758-258
275.9270 -30.3605   16.0  53.8 -155.5   0.7343   0.7    0.4	H1820-303
263.1123 -33.8803   11.7  45.1 -165.3  -0.5851  -1.0    6.7	GX 354-0
232.7855 -15.0450    3.2  51.5  150.5   5.7104   3.6 ------	UNKNOWN
139.0143 -41.3293    2.9  44.3   24.3   2.3199   4.0 ------	UNKNOWN
203.8169 -46.0954    2.6  17.3  110.5   1.4422   4.5 ------	UNKNOWN
207.1200 -63.2568    1.1   0.0 -171.8   2.8726  10.3 ------	UNKNOWN
297.1158 -51.9806    3.6  45.3 -122.0   4.1768   3.2 ------	UNKNOWN
Pre-slew background subtracted image of 15-350 keV band
Time interval of the image:
-25.200000 44.800000

# RAcent  DECcent POSerr Theta    Phi  PeakCts   SNR AngSep     Name
#  [deg]    [deg]    ['] [deg]  [deg]                   [']
135.7064 -40.4924   44.4  46.4   22.1  -0.0833  -0.3    8.9	Vela X-1
170.0055 -60.6457   10.9  17.4   19.9  -0.1503  -1.1    9.2	Cen X-3
186.3447 -62.8253    6.4   9.4   21.5   0.2504   1.8    9.2	GX 301-2
244.8209 -15.6610    6.2  54.3  164.6   1.3416   1.9    9.2	Sco X-1
256.0339 -37.8256    4.8  38.7 -169.4   0.4993   2.4    2.5	4U 1700-377
256.3559 -36.2554    4.5  40.1 -170.4   0.5752   2.6   10.8	GX 349+2
263.0422 -24.7181    6.3  53.0 -171.4   0.8178   1.8    2.4	GX 1+4
264.6633 -44.3696    3.7  37.2 -154.5   0.6451   3.1    5.9	4U 1735-44
270.1828 -25.0979    4.7  55.7 -164.1  -1.4479  -2.5    5.6	GX 5-1
270.3060 -25.7608    6.9  55.2 -163.6  -0.9014  -1.7    1.1	GRS 1758-258
275.8033 -30.3444   11.0  53.7 -155.6  -0.5327  -1.0    6.4	H1820-303
262.9015 -33.6475    0.0  45.2 -165.7  -0.3771  -1.4   12.1	GX 354-0
175.0732 -48.8934    2.1  22.5   52.6   0.9172   5.6 ------	UNKNOWN
117.8268 -45.8779    0.9  49.8    3.8   3.8572  12.1 ------	UNKNOWN
Post-slew image of 15-350 keV band
Time interval of the image:
596.000600 659.489300
660.800000 720.435100
720.800000 962.819100

# RAcent  DECcent POSerr Theta    Phi  PeakCts   SNR AngSep     Name
#  [deg]    [deg]    ['] [deg]  [deg]                   [']
270.1327 -24.9478   75.4  37.1   88.5   0.1460   0.2   11.4	GX 5-1
270.3262 -25.6248    3.0  36.9   87.4   3.4826   3.9    7.2	GRS 1758-258
274.1210 -14.1133    4.9  35.7  107.8   1.9631   2.4    8.1	GX 17+2
276.0473 -30.2510   13.0  31.9   79.1   0.5979   0.9    9.4	H1820-303
285.2020 -25.0140    8.2  23.5   89.3   0.6434   1.4   10.6	HT1900.1-2455
288.7936  10.9807    3.8  39.7  155.7   2.5082   3.0    2.1	GRS 1915+105
285.3477 -65.7251    2.7  46.3   24.8   3.4559   4.3 ------	UNKNOWN
313.8305 -10.6829    2.9  12.1 -154.7   1.2983   4.0 ------	UNKNOWN