E. Sonbas (Adiyaman Univ.), K.L. Page (U. Leicester) and M.H. Siegel (PSU) for the Swift team
At 00:12:41 UT, the Swift Burst Alert Telescope (BAT) triggered and located GRB 210905A (trigger=1071993) (Sonbas et al. GCN Circ. 30765). Swift slewed immediately to the burst. At the time of the trigger, the initial BAT position was 132° from the Sun (9.7 hours East) and 154° from the 5%-illuminated Moon. Table 1 contains the best reported positions from Swift, and the latest XRT position can be viewed at http://www.swift.ac.uk/xrt_positions.
Strausbaugh and Cucchiara (GCN Circ. 30769) reported the position from LCO for the optical afterglow of this GRB. Tanvir et al. (GCN Circ. 30771) determined a redshift of 6.318 from VLT. Table 2 is a summary of GCN Circulars about this GRB from observatories other than Swift.
Standard analysis products for this burst are available at https://gcn.gsfc.nasa.gov/swift_gnd_ana.html.
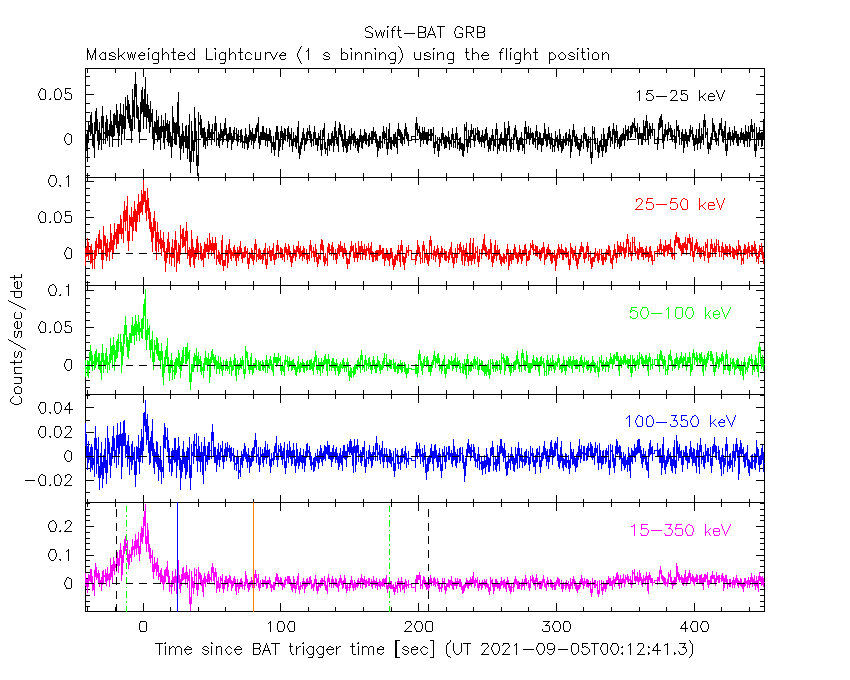
BAT refined results are not available.
Analysis of the initial XRT data was reported by Page et al. (GCN Circ. 30776). We have analysed 106 ks of XRT data for GRB 210905A, from 82 s to 3784.5 ks after the BAT trigger. The data comprise 219 s in Windowed Timing (WT) mode (the first 8 s were taken while Swift was slewing) with the remainder in Photon Counting (PC) mode. The enhanced XRT position for this burst was given by Beardmore et al. (GCN Circ. 30768).
The late-time light curve (Figure 2) (from T0+3.8 ks) can be modelled with an initial power-law decay with an index of α=0.1 (+0.4, -0.6), followed by a break at T+9440 s to an α of 1.05 (+0.05, -0.04).
A spectrum formed from the WT mode data can be fitted with an absorbed power-law with a photon spectral index of 1.42 (+0.05, -0.04). The best-fitting absorption column is 4.5 (+1.9, -1.8) x 1
A summary of the PC-mode spectrum is thus:
Galactic foreground: 3.4 x 1
Intrinsic column: 2.8 (+3.7, -2.8) x 1
Photon index: 1.86 (+0.13, -0.12)
The results of the XRT team automatic analysis are available at http://www.swift.ac.uk/xrt_products/01071993.
The Swift/UVOT began settled observations of the field of GRB 210905A 157 s after the BAT trigger
(Siegel and Sonbas GCN Circ. 30785).
No optical afterglow consistent with the XRT position (Beardmore et al. GCN Circ. 30768) is detected in the initial UVOT exposures.
Table 3 gives preliminary
magnitudes using the UVOT photometric system
(Breeveld et al. 2011, AIP Conf. Proc., 1358, 373).
No correction has been made for the expected extinction in the Milky Way
corresponding to a reddening of
Figure 1. The BAT
mask-weighted light curve in the four individual and total
energy bands. The units are counts
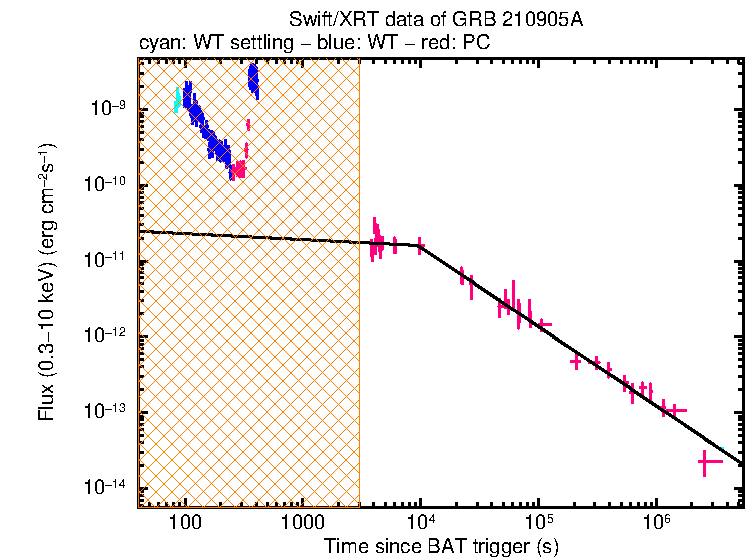
Figure 2. The XRT light curve.
Any data from a crosshatched region are not included in the fit.
| RA (J2000) | Dec (J2000) | Error | Note | Reference |
|---|---|---|---|---|
| 2 |
-44°26'24.3" | 1.5" | XRT-final | UKSSDC |
| 2 |
-44°26'22.4" | 2.6" | XRT-enhanced | Beardmore et al. GCN Circ. 30768 |
| 2 |
-44°25'50" | 3' | BAT-initial | Sonbas et al. GCN Circ. 30765 |
| Band | Authors | GCN Circ. | Subject | Observatory | Notes |
|---|---|---|---|---|---|
| Optical | Lipunov et al. | 30766 | Swift GRB 210905A: Global MASTER-Net observations report |
MASTER | |
| Optical | Strausbaugh and Cucchiara | 30769 | LCO Optical Detection | LCO | detection |
| Optical | Strausbaugh and Cucchiara | 30770 | Continued LCO Optical Observations | LCO | |
| Optical | Tanvir et al. | 30771 | VLT/X-shooter spectroscopic redshift | VLT | redshift |
| Optical | D'Avanzo et al. | 30772 | REM NIR afterglow detection | REM | detection |
| Optical | Cooke et al. | 30773 | DECam Detection | Dark Energy Camera | detection |
| Optical | Guelbenzu et al. | 30781 | GROND observations | GROND | detection |
| Radio | Laskar et al. | 30783 | ALMA detection | ALMA | detection |
| Radio | Laskar et al. | 30784 | ATCA detection | ATCA | detection |
| X-ray | Laskar et al. | 31127 | Chandra observations | Chandra | detection |
| Gamma-ray | Veres and Roberts | 30779 | Fermi GBM Sub-Threshold Detection | Fermi GBM | |
| Gamma-ray | Frederiks et al. | 30780 | Konus-Wind detection | Konus-Wind | |
| Gamma-ray | Prasad et al. | 30782 | AstroSat CZTI detection | CZTI |
| Filter | Exp(s) | Mag | ||
|---|---|---|---|---|
| 157 | 407 | 246 | >20.1 | |
| v | 4193 | 4393 | 197 | >19.3 |
| b | 3782 | 3982 | 197 | >21.4 |
| w1 | 4603 | 4803 | 197 | >20.1 |
| m2 | 4398 | 4597 | 197 | >19.5 |
| w2 | 3988 | 4188 | 197 | >19.4 |
Table 3. UVOT observations reported by Siegel and Sonbas (GCN Circ. 30785). The start and stop times of the exposures are given in seconds since the BAT trigger. The preliminary 3-σ upper limits are given. No correction has been made for extinction in the Milky Way.
November 26, 2021