A. Tohuvavohu (U. Toronto), A. D'Ai (INAF-IASFPA) and N.P.M. Kuin (UCL-MSSL) for the Swift team
At 05:09:55 UT, the Swift Burst Alert Telescope (BAT) triggered and located GRB 220101A (trigger=1091101) (Tohuvavohu et al. GCN Circ. 31347). Swift slewed immediately to the burst. At the time of the trigger, the initial BAT position was 137° from the Sun (9.6 hours West) and 65° from the 41%-illuminated Moon. Table 1 contains the best reported positions from Swift, and the latest XRT position can be viewed at http://www.swift.ac.uk/xrt_positions.
Tohuvavohu et al. (GCN Circ. 31347) reported the discovery with UVOT of an optical afterglow. Fu et al. (GCN Circ. 31353) determined a redshift of 4.61 from Xinglong, Perley (GCN Circ. 31357) determined a redshift from Liverpool Telescope, Fynbo et al. (GCN Circ. 31359) determined a redshift of 4.618 from NOT, Tomasella et al. (GCN Circ. 31363) determined a redshift of 4.61, and Kumar et al. (GCN Circ. 31442) determined a redshift of 4.618 from DFOT. Table 2 is a summary of GCN Circulars about this GRB from observatories other than Swift.
Standard analysis products for this burst are available at https://gcn.gsfc.nasa.gov/swift_gnd_ana.html.
As reported by Markwardt et al. (GCN Circ. 31369), the BAT ground-calculated position is RA, Dec = 1.360, 31.758 deg.
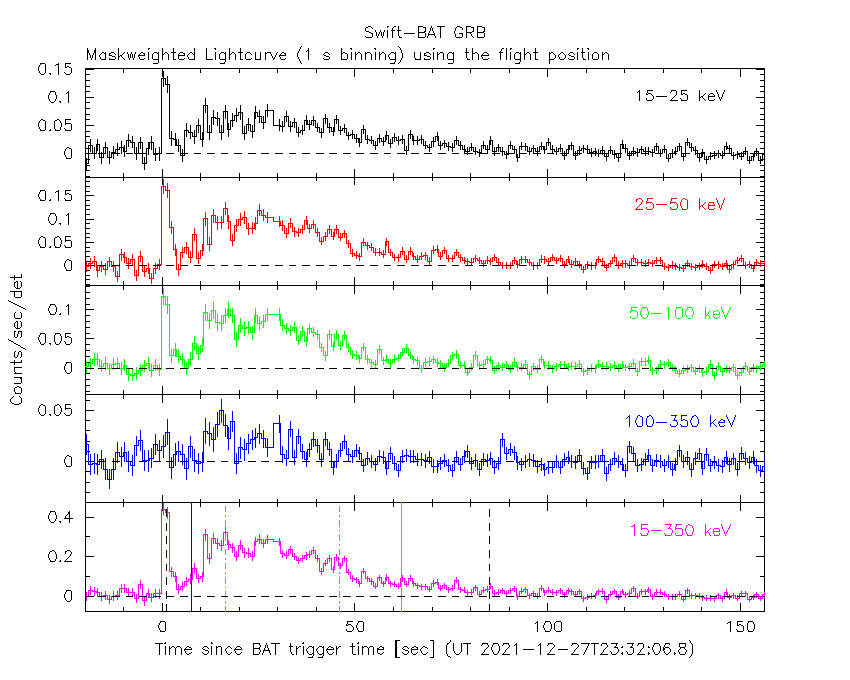
The BAT lightcurve (Figure 1) shows a complex lightcurve extending to at least T+170 with a peak of 7000 counts/s (15-350 keV), at ~89 s after the trigger.
The time-averaged spectrum from T-58.08 to T+259.11 s is best fit by a power law with an exponential cutoff.
This fit gives a photon index 1.13 ± 0.13, and
The results of the batgrbproduct analysis are available at https://gcn.gsfc.nasa.gov/notices_s/1091101/BA/.
Analysis of the initial XRT data was reported by D'Ai et al. (GCN Circ. 31355). We have analysed 19 ks of XRT data for GRB 211227A (Beardmore et al. GCN Circ. 31316), from 63 s to 257.6 ks after the BAT trigger. The data comprise 182 s in Windowed Timing (WT) mode (the first 9 s were taken while Swift was slewing) with the remainder in Photon Counting (PC) mode. The enhanced XRT position for this burst was given by Goad et al. (GCN Circ. 31322).
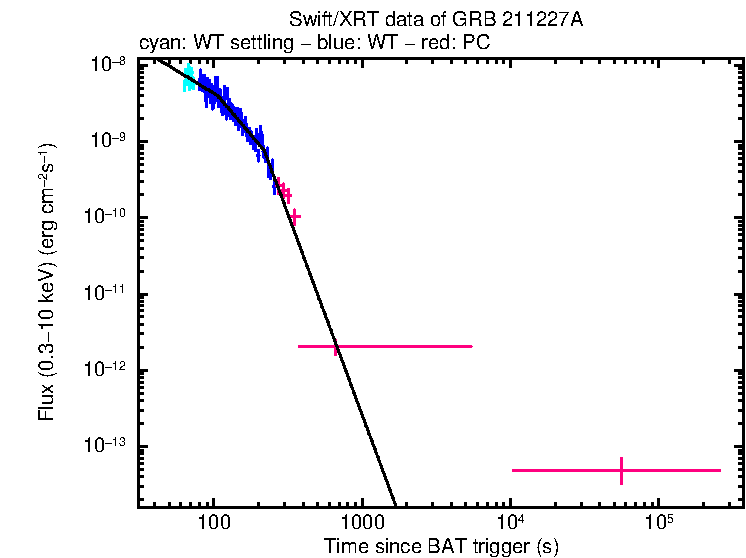
The light curve (Figure 2) can be modelled with a series of power-law decays. The initial decay index is α=1.19 (+0.25, -0.20). At T+106 s the decay steepens to an α of 2.30 (+0.34, -0.18) before breaking again at T+219 s to a final decay with index α=5.26 (+0.35, -0.28).
A spectrum formed from the WT mode data can be fitted with an absorbed power-law with a photon spectral index of 1.11 ± 0.07. The best-fitting absorption column is 2.2 (+0.5, -0.4) x 1
A summary of the WT-mode spectrum is thus:
Total column: 2.2 (+0.5, -0.4) x 1
Galactic foreground: 2.4 x 1
Excess significance: 7.8 σ
Photon index: 1.11 ± 0.07
The results of the XRT team automatic analysis are available at http://www.swift.ac.uk/xrt_products/01091101.
The Swift/UVOT began settled observations of the field of GRB 220101 90 s after the BAT trigger
(Kuin and Tohuvavohu GCN Circ. 31351).
A rapidly decayig source consistent with the XRT position (Osborne et al., GCN Circ. 31349) is detected in the initial UVOT exposures.
Table 3 gives preliminary
magnitudes using the UVOT photometric system
(Breeveld et al. 2011, AIP Conf. Proc., 1358, 373).
No correction has been made for the expected extinction in the Milky Way
corresponding to a reddening of

Figure 1. The BAT
mask-weighted light curve in the four individual and total
energy bands. The units are counts

Figure 2. The XRT light curve.
Any data from a crosshatched region are not included in the fit.
| RA (J2000) | Dec (J2000) | Error | Note | Reference |
|---|---|---|---|---|
| 0 |
+31°46'08.4" | 0.42" | UVOT-refined | Kuin and Tohuvavohu GCN Circ. 31351 |
| 0 |
+31°46'07.7" | 1.9" | XRT-final | UKSSDC |
| 0 |
+31°46'08.0" | 2.1" | XRT-enhanced | Osborne et al. GCN Circ. 31349 |
| 0 |
+31°45'28.3" | 2.2' | BAT-refined | Markwardt et al. GCN Circ. 31369 |
| Band | Authors | GCN Circ. | Subject | Observatory | Notes |
|---|---|---|---|---|---|
| Optical | Lipunov et al. | 31352 | Swift GRB220101.22: Global MASTER-Net observations report |
MASTER | |
| Optical | Fu et al. | 31353 | Xinglong-2.16m photometry and spectroscopy |
Xinglong | spectroscopy |
| Optical | Hentunen et al. | 31356 | THO optical observations | Taurus Hill Obs. | detection |
| Optical | Perley | 31357 | Liverpool telescope imaging of a high-redshift afterglow |
Liverpool Telescope | redshift |
| Optical | de Ugarte Postigo et al. | 31358 | CAHA 2.2m/CAFOS detection | CAHA | detection |
| Optical | Fynbo et al. | 31359 | NOT redshift confirmation | NOT | redshift |
| Optical | Vinko et al. | 31361 | optical afterglow detection from Konkoly Observatory |
Konkoly | detection |
| Optical | Mao et al. | 31364 | GMG observation | Gao-Mei-Gu | detection |
| Optical | Noschese et al. | 31366 | OASDG optical observations | S.Di Giacomo Obs. | detection |
| Optical | Mao et al. | 31368 | GMG observation (2nd epoch) | Gao-Mei-Gu | |
| Optical | Guelbenzu et al. | 31370 | Tautenburg observations | Tautenburg | |
| Optical | Strausbaugh and Cucchiara | 31371 | LCO Optical Observations | LCO | |
| Optical | D'Avanzo et al. | 31373 | TNG NIR afterglow detection | TNG | detection |
| Optical | Strausbaugh and Cucchiara | 31383 | LCO Continued Optical Observations | LCO | |
| Optical | Dimple et al. | 31384 | 1.3m DFOT observations | DFOT | |
| Optical | 31387 | iTelescope optical observations | iTelescope | ||
| Optical | Caballero-Garcia et al. | 31388 | 2.2m CAHA (+CAFOS) first day optical detection |
CAHA | detection |
| Optical | Strausbaugh and Cucchiara | 31389 | 3rd LCO Optical Observation | LCO | |
| Optical | Belkin et al. | 31390 | Mondy optical observations | Mondy | detection |
| Optical | Ror et al. | 31394 | continued 1.3m DFOT Optical Observations | DFOT | detection |
| Optical | D'Avanzo et al. | 31395 | further TNG NIR observations | TNG | detection |
| Optical | Pankov et al. | 31398 | Continued Mondy optical observations | Mondy | detection |
| Optical | Guelbenzu et al. | 31401 | Tautenburg observations | Tautenburg | |
| Optical | Moskvitin et al. | 31420 | SAO RAS optical observations | SAO RAS | detection |
| Optical | Perley | 31425 | Additional Liverpool telescope photometry |
Liverpool Telescope | |
| Optical | Kumar et al. | 31442 | continued 1.3m DFOT optical observations of a high-redshift afterglow |
DFOT | redshift |
| Optical | Pankov et al. | 31471 | TSHAO optical observation, Terskol, AbAO upper limits |
Abastumani Astro. Obs. | upper limits |
| Optical | Fouad et al. | 31504 | KAO optical-R observation | Kottamia | |
| Radio | Laskar | 31372 | ALMA detection | ALMA | detection |
| Radio | Laskar | 31385 | VLA detection | VLA | detection |
| Gamma-ray | Arimoto et al. | 31350 | Fermi-LAT detection | Fermi LAT | |
| Gamma-ray | Ursi et al. | 31354 | AGILE detection | AGILE | |
| Gamma-ray | Lesage and Meegan | 31360 | Fermi GBM Detection | Fermi GBM | Fluence=7.7±0.1x1 (brighter than 97.0% of long GRBs) |
| Gamma-ray | Tsvetkova et al. | 31433 | Konus-Wind detection | Konus-Wind | |
| Gamma-ray | Tsvetkova | 31436 | Konus-Wind detection of GRB 220101A (correction to GCN Circ. 31433) |
Konus-Wind | |
| Other | Tomasella et al. | 31363 | Asiago spectroscopic and photometric detection |
detection | |
| Other | Atteia | 31365 | energy |
detection | |
| Other | Ruffini et al. | 31465 | The most powerful GRB and BDHN I in 26 years |
||
| Other | Ruffini et al. | 31648 | The first example of a Petanova |
| Filter | Exp(s) | Mag | ||
|---|---|---|---|---|
| white | 90 | 240 | 147 | 14.68 ± 0.02 |
| v | 4448 | 4647 | 197 | 18.70 ± 0.18 |
| b | 3833 | 4032 | 197 | >19.8 |
| u | 3628 | 5201 | 334 | >20.1 |
| w1 | 4858 | 5057 | 197 | >20.1 |
| m2 | 4652 | 4852 | 197 | >20.2 |
| w2 | 4243 | 4443 | 197 | >20.4 |
Table 3. UVOT observations reported by Kuin and Tohuvavohu (GCN Circ. 31351). The start and stop times of the exposures are given in seconds since the BAT trigger. The preliminary detections and 3-σ upper limits are given. No correction has been made for extinction in the Milky Way.
February 26, 2022