E. Ambrosi (INAF-IASFPA) and P.A. Evans (U. Leicester) for the Swift team
At 13:53:15 UT, the Swift Burst Alert Telescope (BAT) triggered and located GRB 220430A (trigger=1104692) (Ambrosi et al. GCN Circ. 31972). Swift slewed immediately to the burst. At the time of the trigger, the initial BAT position was 59° from the Sun (4.0 hours East) and 62° from the 0%-illuminated Moon. Table 1 contains the best reported positions from Swift, and the latest XRT position can be viewed at http://www.swift.ac.uk/xrt_positions.
Table 2 is a summary of GCN Circulars about this GRB from observatories other than Swift.
Standard analysis products for this burst are available at https://gcn.gsfc.nasa.gov/swift_gnd_ana.html.
As reported by Barthelmy et al. (GCN Circ. 31981),
the BAT ground-calculated position is RA, Dec = 97.616, 9.547 deg which is RA(J2000) = 0
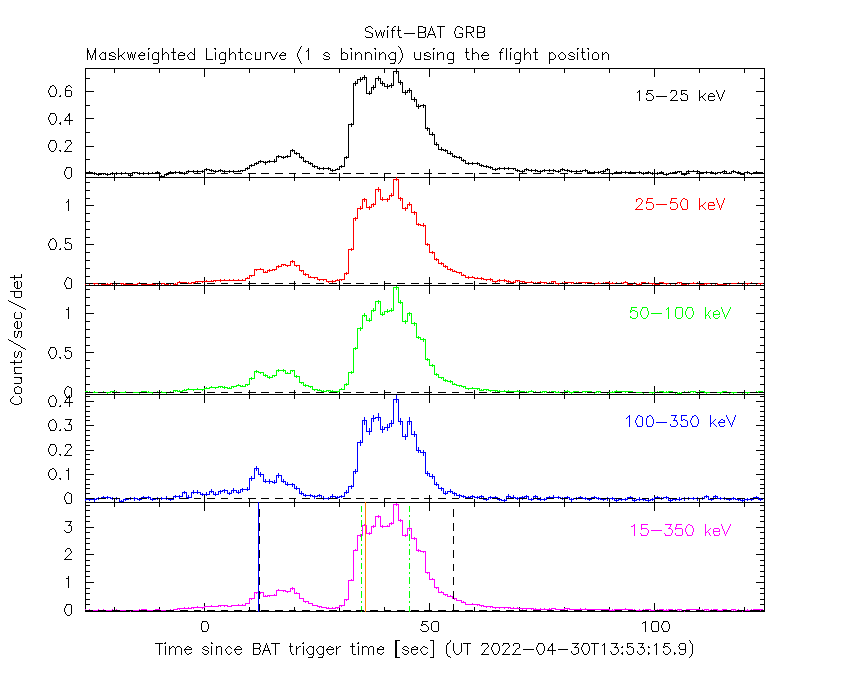
The mask-weighted light curve (Figure 1) shows two major pulse emissions.
The first one starts at ~T-7 s, peaks at ~T+20 s, and ends at ~T+30 s.
It is followed by another larger pulse with several peaks.
The largest peak occurs at ~T+42 s.
The burst emission ends at ~T+100 s.
The time-averaged spectrum from T-6.53 to T+94.36 s is best fit by a simple power-law model.
The power law index of the time-averaged spectrum is 1.24 ± 0.02.
The fluence in the 15-150 keV band is 4.4 ± 0.05 x 1
The results of the batgrbproduct analysis are available at https://gcn.gsfc.nasa.gov/notices_s/1104692/BA/.
Analysis of the initial XRT data was reported by Evans et al. (GCN Circ. 31979). We have analysed 23 ks of XRT data for GRB 220430A, from 39 s to 263.7 ks after the BAT trigger. The data comprise 539 s in Windowed Timing (WT) mode (the first 11 s were taken while Swift was slewing) with the remainder in Photon Counting (PC) mode. The enhanced XRT position for this burst was given by Osborne et al. (GCN Circ. 31973).
The late-time light curve (Figure 2) (from T0+4.2 ks) can be modelled with a power-law decay with a decay index of α=1.45 ± 0.06.
A spectrum formed from the WT mode data can be fitted with an absorbed power-law with a photon spectral index of 1.65 ± 0.05. The best-fitting absorption column is 1.05 (+0.07, -0.06) x 1
A summary of the PC-mode spectrum is thus:
Total column: 1.01 (+0.19, -0.17) x 1
Galactic foreground: 6.5 x 1
Excess significance: 3.6 σ
Photon index: 1.83 (+0.17, -0.16)
The results of the XRT team automatic analysis are available at http://www.swift.ac.uk/xrt_products/01104692.
UVOT results are not available.
Figure 1. The BAT
mask-weighted light curve in the four individual and total
energy bands. The units are counts
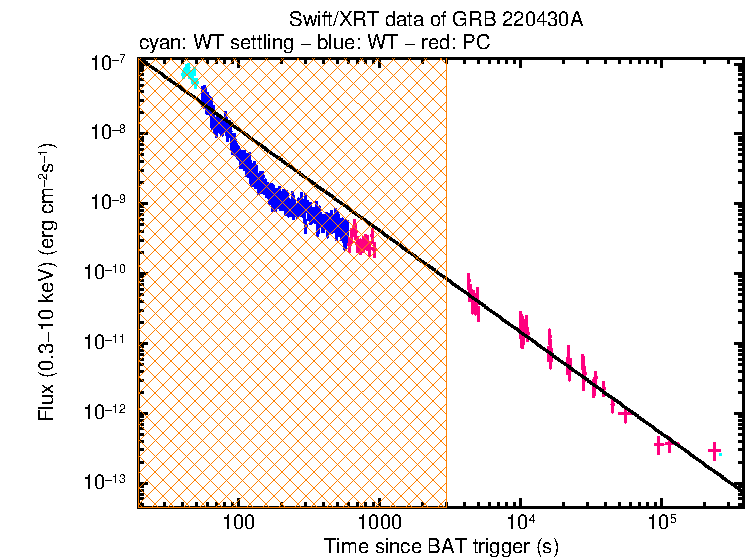
Figure 2. The XRT light curve.
Any data from a crosshatched region are not included in the fit.
| RA (J2000) | Dec (J2000) | Error | Note | Reference |
|---|---|---|---|---|
| 0 |
+09°32'51.1" | 2.0" | XRT-final | UKSSDC |
| 0 |
+09°32'51.1" | 2.0" | XRT-enhanced | Osborne et al. GCN Circ. 31973 |
| 0 |
+09°32'50.1" | 1.0' | BAT-refined | Barthelmy et al. GCN Circ. 31981 |
| Band | Authors | GCN Circ. | Subject | Observatory | Notes |
|---|---|---|---|---|---|
| Optical | Groot et al. | 31974 | MeerLICHT optical upper limits | MeerLICHT | upper limits |
| Optical | Pankov et al. | 31976 | Mondy and AbAO optical upper limits | Abastumani Astro. Obs. | upper limits |
| Optical | Dornic et al. | 31977 | GRANDMA observations | GRANDMA | |
| Optical | Lipunov et al. | 31978 | Swift GRB 220430A: Global MASTER-Net observations report |
MASTER | |
| Optical | Hu et al. | 31980 | CAHA 2.2m telescope optical limit | CAHA | upper limits |
| Optical | Swain et al. | 31997 | GIT optical upper limits | GROWTH-India Tel. | upper limits |
| Optical | Jiang et al. | 31998 | Nanshan/HMT optical upper limit | Xinjiang Astro. Obs. | upper limits |
| Optical | Jiang et al. | 31999 | Nanshan/NEXT optical upper limit | Xinjiang Astro. Obs. | upper limits |
| Gamma-ray | Ursi et al. | 31975 | AGILE detection | AGILE | |
| Gamma-ray | Gopalakrishnan et al. | 31987 | AstroSat CZTI detection | CZTI |
May 7, 2022