S. Dichiara (PSU), A. Tohuvavohu (U. Toronto) and N.P.M. Kuin (UCL-MSSL) for the Swift team
At 23:20:21 UT, the Swift Burst Alert Telescope (BAT) triggered and located GRB 220521A (trigger=1107466) (Dichiara et al. GCN Circ. 32076). Swift slewed immediately to the burst. At the time of the trigger, the initial BAT position was 133° from the Sun (9.6 hours West) and 57° from the 59%-illuminated Moon. Table 1 contains the best reported positions from Swift, and the latest XRT position can be viewed at http://www.swift.ac.uk/xrt_positions.
Malesani and Pursimo (GCN Circ. 32078) reported the position from NOT for the optical afterglow of this GRB. Fynbo et al. (GCN Circ. 32079) determined a redshift of 5.6 from NOT. Table 2 is a summary of GCN Circulars about this GRB from observatories other than Swift.
Standard analysis products for this burst are available at https://gcn.gsfc.nasa.gov/swift_gnd_ana.html.
As reported by Lien et al. (GCN Circ. 32090),
the BAT ground-calculated position is RA, Dec = 275.218, 10.372 deg which is RA(J2000) = 1
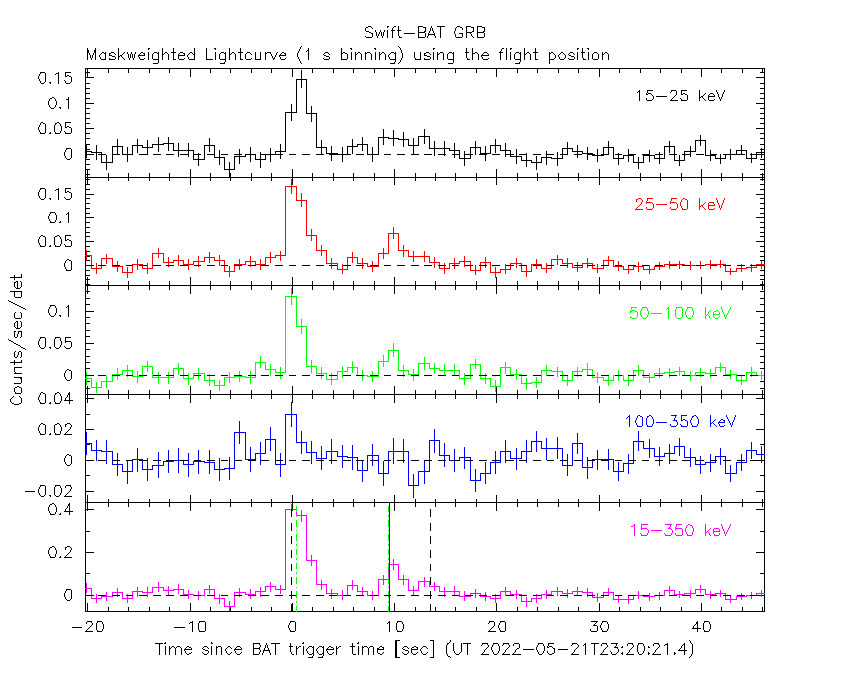
The mask-weighted light curve (Figure 1) shows a multi-peaked structure that starts at ~
The time-averaged spectrum from T-0.23 to T+16.17 s is best fit by a simple power-law model.
The power law index of the time-averaged spectrum is 1.97 ± 0.18.
The fluence in the 15-150 keV band is 8.1 ± 0.8 x 1
The results of the batgrbproduct analysis are available at https://gcn.gsfc.nasa.gov/notices_s/1107466/BA/.
Analysis of the initial XRT data was reported by Tohuvavohu et al. (GCN Circ. 32086). We have analysed 21 ks of XRT data for GRB 220521A, from 104 s to 250.9 ks after the BAT trigger. The data are entirely in Photon Counting (PC) mode. The enhanced XRT position for this burst was given by Evans et al. (GCN Circ. 32077).
The late-time light curve (Figure 2) (from T0+3.8 ks) can be modelled with a power-law decay with a decay index of α=1.71 (+0.21, -0.18).
A spectrum formed from the PC mode data can be fitted with an absorbed power-law with a photon spectral index of 2.02 (+0.24, -0.17). The best-fitting absorption column is 7 (+57, -7) x 1
A summary of the PC-mode spectrum is thus:
Galactic foreground: 1.9 x 1
Intrinsic column: 7 (+57, -7) x 1
Photon index: 2.02 (+0.24, -0.17)
The results of the XRT team automatic analysis are available at http://www.swift.ac.uk/xrt_products/01107466.
The Swift/UVOT began settled observations
(Kuin and Dichiara GCN Circ. 32085) of the field of GRB 220521A 100 s after the BAT trigger.No optical afterglow consistent with the XRT position (Evans et al. GCN Circ. 32081) is detected in the initial UVOT exposures.
Preliminary 3-sigma upper limits using the UVOT photometric system (Breeveld et al. 2011, AIP Conf. Proc. 1358, 373) for the first finding chart (FC) exposure and subsequent exposures are:
Table 3 gives preliminary
magnitudes using the UVOT photometric system
(Breeveld et al. 2011, AIP Conf. Proc., 1358, 373).
No correction has been made for the expected extinction in the Milky Way
corresponding to a reddening of
Figure 1. The BAT
mask-weighted light curve in the four individual and total
energy bands. The units are counts
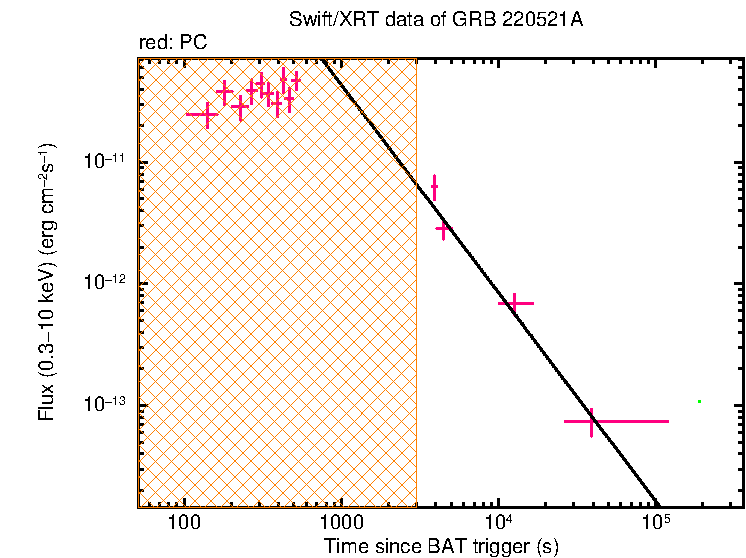
Figure 2. The XRT light curve.
Any data from a crosshatched region are not included in the fit.
| RA (J2000) | Dec (J2000) | Error | Note | Reference |
|---|---|---|---|---|
| 1 |
+10°22'18.4" | 2.1" | XRT-final | UKSSDC |
| 1 |
+10°22'18.3" | 2.1" | XRT-enhanced | Evans et al. GCN Circ. 32081 |
| 1 |
+10°22'20.0" | 1.7' | BAT-refined | Lien et al. GCN Circ. 32090 |
| Band | Authors | GCN Circ. | Subject | Observatory | Notes |
|---|---|---|---|---|---|
| Optical | Lipunov et al. | 32074 | Swift GRB220521.97: Global MASTER-Net observations report |
MASTER | |
| Optical | Malesani and Pursimo | 32078 | NOT optical afterglow detection | NOT | detection |
| Optical | Fynbo et al. | 32079 | NOT spectroscopic redshift | NOT | redshift |
| Optical | Goranskij and Moskvitin | 32082 | SAO RAS optical observations | SAO RAS | detection |
| Optical | Watson et al. | 32087 | RATIR Optical and NIR Observations | RATIR | upper limits |
| Optical | Nazarov et al. | 32088 | Sintesz-Newton/CrAO optical upper limit | CrAO | upper limits |
| Optical | Strausbaugh and Cucchiara | 32091 | LCO Optical Detection | LCO | detection |
| Optical | Ferro et al. | 32096 | REM optical/NIR upper limits | REM | upper limits |
| Optical | Rastinejad et al. | 32097 | MMT Afterglow Imaging | MMT | detection |
| Optical | Cucchiara et al. | 32099 | Gemini Observations | Gemini | detection |
| Optical | Sato et al. | 32101 | MITSuME Akeno optical upper limits | MITSuME Akeno | upper limits |
| Optical | Belkin et al. | 32103 | ISON-Castelgrande observatory optical observations |
Castelgrande Obs. | |
| Optical | Hu et al. | 32107 | BOOTES-2/TELMA and CAHA 2.2m telescope optical upper limit |
BOOTES-2 | upper limits |
| Radio | Laskar et al. | 32110 | ALMA detection | ALMA | detection |
| Radio | Laskar et al. | 32111 | ATCA detection | ATCA | detection |
| Gamma-ray | Fermi | 32075 | Fermi GBM Final Real-time Localization | Fermi GBM | |
| Gamma-ray | Poolakkil and Meegan | 32089 | Fermi GBM detection | Fermi GBM | Fluence=6.62±0.49x1 (brighter than 8% of long GRBs) |
| Gamma-ray | Minaev et al. | 32105 | classification and detection by SPI-ACS/INTEGRAL |
INTEGRAL |
| Filter | Exp(s) | Mag | ||
|---|---|---|---|---|
| whit |
100 | 250 | 147 | >20.8 |
| 312 | 548 | 232 | >19.2 | |
| white | 100 | 4178 | 344 | >21.5 |
| v | 4389 | 4589 | 197 | >19.5 |
| b | 3773 | 3973 | 197 | >20.4 |
| u | 312 | 5050 | 278 | >19.4 |
| w1 | 4798 | 4998 | 197 | >20.2 |
| m2 | 4593 | 4793 | 197 | >19.7 |
| w2 | 4184 | 4383 | 197 | >19.7 |
Table 3. UVOT observations reported by Kuin and Dichiara (GCN Circ. 32085). The start and stop times of the exposures are given in seconds since the BAT trigger. The preliminary 3-σ upper limits are given. No correction has been made for extinction in the Milky Way.
May 25, 2022