K.L. Page (U. Leicester) for the Swift team
At 18:08:39 UT, the Swift Burst Alert Telescope (BAT) triggered and located GRB 220806A (trigger=1119268) (Page et al. GCN Circ. 32445). Swift could not slew to the burst location due to a Moon constraint. At the time of the trigger, the initial BAT position was 128° from the Sun (8.3 hours East) and 21° from the 64%-illuminated Moon. Table 1 contains the best reported positions from Swift.
Table 2 is a summary of GCN Circulars about this GRB from observatories other than Swift.
Standard analysis products for this burst are available at https://gcn.gsfc.nasa.gov/swift_gnd_ana.html.
As reported by Palmer et al. (GCN Circ. 32453),
the BAT ground-calculated position is RA, Dec = 260.858, -26.021 deg which is RA(J2000) = 1
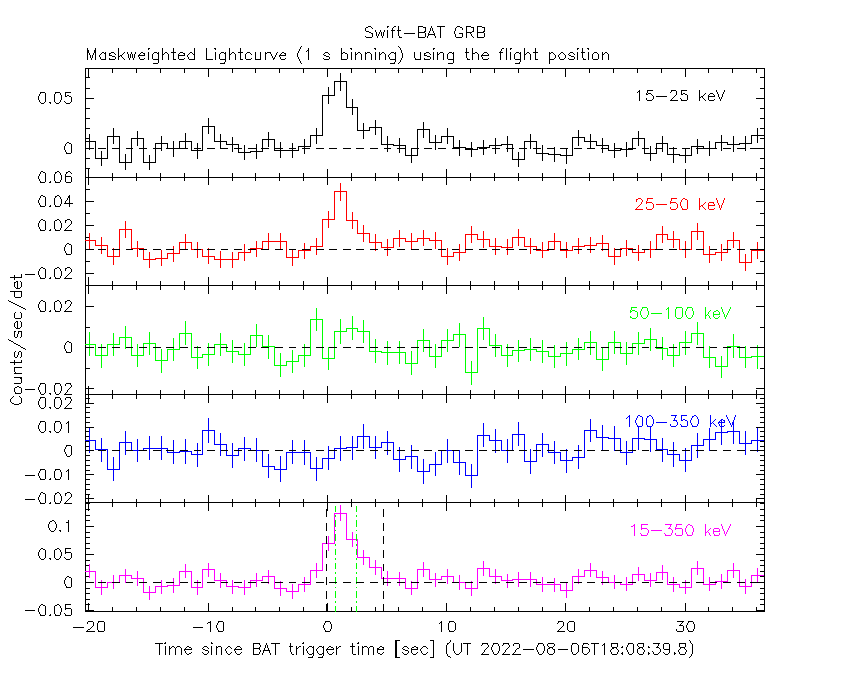
The BAT light curve (Figure 1) showed a single peaked structure with a duration of about 6 s.
The time-averaged spectrum from T-0.30 to T+6.66 s is best fit by a simple power-law model.
The power law index of the time-averaged spectrum is 2.81 ± 0.33.
The fluence in the 15-150 keV band is 1.5 ± 0.3 x 1
The results of the batgrbproduct analysis are available at https://gcn.gsfc.nasa.gov/notices_s/1119268/BA/.
XRT refined results are not available.
UVOT results are not available.
Figure 1. The BAT
mask-weighted light curve in the four individual and total
energy bands. The units are counts
| RA (J2000) | Dec (J2000) | Error | Note | Reference |
|---|---|---|---|---|
| 1 |
-26°01'15.2" | 2.0' | BAT-refined | Palmer et al. GCN Circ. 32453 |
| Band | Authors | GCN Circ. | Subject | Observatory | Notes |
|---|---|---|---|---|---|
| Optical | Lipunov et al. | 32444 | Swift GRB220806.76: Global MASTER-Net observations report |
MASTER |
August 10, 2022