
S. Dichiara (PSU), A. Tohuvavohu (U. Toronto) and A.A. Breeveld (UCL-MSSL) for the Swift team
At 05:50:50 UT, the Swift Burst Alert Telescope (BAT) triggered and located GRB 230228A (trigger=1156572) (Dichiara et al. GCN Circ. 33378). Swift slewed immediately to the burst. At the time of the trigger, the initial BAT position was 63° from the Sun (2.5 hours East) and 50° from the 59%-illuminated Moon. Table 1 contains the best reported positions from Swift, and the latest XRT position can be viewed at http://www.swift.ac.uk/xrt_positions.
Table 2 is a summary of GCN Circulars about this GRB from observatories other than Swift.
Standard analysis products for this burst are available at https://gcn.gsfc.nasa.gov/swift_gnd_ana.html.
Analysis of the BAT data was reported by Krimm and Barthelmy (GCN Circ. 33393).
The mask-weighted light curve (Figure 1) shows a Fast Rise Exponential Decay single pulse.
The time-averaged spectrum from T-0.05 to T+2.53 s is best fit by a simple
The results of the batgrbproduct analysis are available at https://gcn.gsfc.nasa.gov/notices_s/1156572/BA/.
Analysis of the initial XRT data was reported by Tohuvavohu et al. (GCN Circ. 33384). We have analysed 10 ks of XRT data for GRB 230228A, from 102 s to 97.7 ks after the BAT trigger. The data comprise 10 s in Windowed Timing (WT) mode (taken while Swift was slewing), with the remainder in Photon Counting (PC) mode. The enhanced XRT position for this burst was given by Beardmore et al. (GCN Circ. 33379).
The light curve (Figure 2) can be modelled with a power-law decay with a decay index of α=0.94 ± 0.07.
A spectrum formed from the PC mode data can be fitted with an absorbed power-law with a photon spectral index of 1.82 (+0.27, -0.25). The best-fitting absorption column is 2.1 (+1.1, -0.9) x 1
A summary of the PC-mode spectrum is thus:
Total column: 2.1 (+1.1, -0.9) x 1
Galactic foreground: 9.7 x 1
Excess significance: 1.9 σ
Photon index: 1.82 (+0.27, -0.25)
The results of the XRT team automatic analysis are available at http://www.swift.ac.uk/xrt_products/01156572.
The Swift/UVOT began settled observations of the field of GRB 230228A 122 s after the BAT trigger
(Breeveld and Dichiara GCN Circ. 33392).
No optical afterglow consistent with the enhanced XRT position (Beardmore et al., GCN Circ. 33382) is detected in the initial UVOT exposures.
Table 3 gives preliminary
magnitudes using the UVOT photometric system
(Breeveld et al. 2011, AIP Conf. Proc., 1358, 373).
No correction has been made for the expected extinction in the Milky Way
corresponding to a reddening of
Figure 1. The BAT
mask-weighted light curve in the four individual and total
energy bands. The units are counts
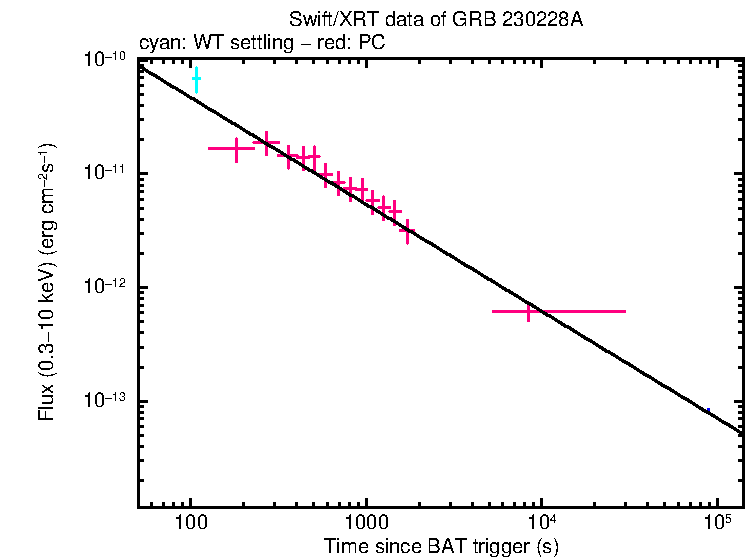
Figure 2. The XRT light curve.
Any data from a crosshatched region are not included in the fit.
| RA (J2000) | Dec (J2000) | Error | Note | Reference |
|---|---|---|---|---|
| 0 |
+44°28'58.5" | 2.1" | XRT-final | UKSSDC |
| 0 |
+44°28'58.5" | 2.1" | XRT-enhanced | Beardmore et al. GCN Circ. 33382 |
| 0 |
+44°29'41.9" | 1.5' | BAT-refined | Krimm and Barthelmy GCN Circ. 33393 |
| Band | Authors | GCN Circ. | Subject | Observatory | Notes |
|---|---|---|---|---|---|
| Optical | Lim et al. | 33380 | Miryang Arirang Astronomical Observatory (MAAO) 0.7-m telescope optical upper limit |
Miryang Arirang Astro.Obs. | upper limits |
| Optical | Lu et al. | 33381 | Nanshan/NEXT optical upper limit | Xinjiang Astro. Obs. | upper limits |
| Optical | Belkin et al. | 33383 | Mondy optical upper limit | Mondy | upper limits |
| Optical | Hu et al. | 33387 | OSN optical upper limit | Obs.de Sierra Nevada | upper limits |
| Optical | Noonan et al. | 33426 | VIRT Optical Upper Limit | Virgin Island Robotic Telescope | upper limits |
| Optical | Komesh et al. | 33436 | NUTTelA-TAO / BSTI Optical Limits | NUTTelA | upper limits |
| Optical | Hu et al. | 33557 | detection by GTC of the potential host galaxy |
GTC | |
| Radio | Schroeder et al. | 33394 | 6 GHz VLA radio upper limit | VLA | upper limits |
| Gamma-ray | Fletcher et al. | 33389 | Fermi GBM Observation | Fermi GBM | Fluence=5.9±0.6x1 (brighter than 7% of long GRBs) |
| Filter | Exp(s) | Mag | ||
|---|---|---|---|---|
| whit |
122 | 272 | 147 | >20.2 |
| 335 | 585 | 246 | >19.5 | |
| white | 122 | 1706 | 240 | >20.6 |
| v | 665 | 1752 | 97 | >18.8 |
| b | 591 | 1851 | 88 | >19.8 |
| u | 335 | 1830 | 341 | >19.7 |
| w1 | 714 | 1806 | 117 | >20.0 |
| m2 | 689 | 1780 | 97 | >19.7 |
| w2 | 640 | 1731 | 78 | >20.1 |
Table 3. UVOT observations reported by Breeveld and Dichiara (GCN Circ. 33392). The start and stop times of the exposures are given in seconds since the BAT trigger. The preliminary 3-σ upper limits are given. No correction has been made for extinction in the Milky Way.
April 3, 2023