T.N. Ukwatta (LANL) for the Swift team
At 02:47:06 UT, the Swift Burst Alert Telescope (BAT) triggered and located GRB 180113A (trigger=804999) (Ukwatta et al. GCN Circ. 22325). Due to an observing constraint, Swift could not slew to this burst. At the time of the trigger, the initial BAT position was 108° from the Sun (5.7 hours East) and 120° from the 14%-illuminated Moon. Table 1 contains the best reported positions from Swift.
Table 2 is a summary of GCN Circulars about this GRB from observatories other than Swift.
Standard analysis products for this burst are available at https://gcn.gsfc.nasa.gov/swift_gnd_ana.html.
As reported by Ukwatta et al. (GCN Circ. 22332),
the BAT ground-calculated position is RA, Dec = 19.211, 68.682 deg which is RA(J2000) = 0
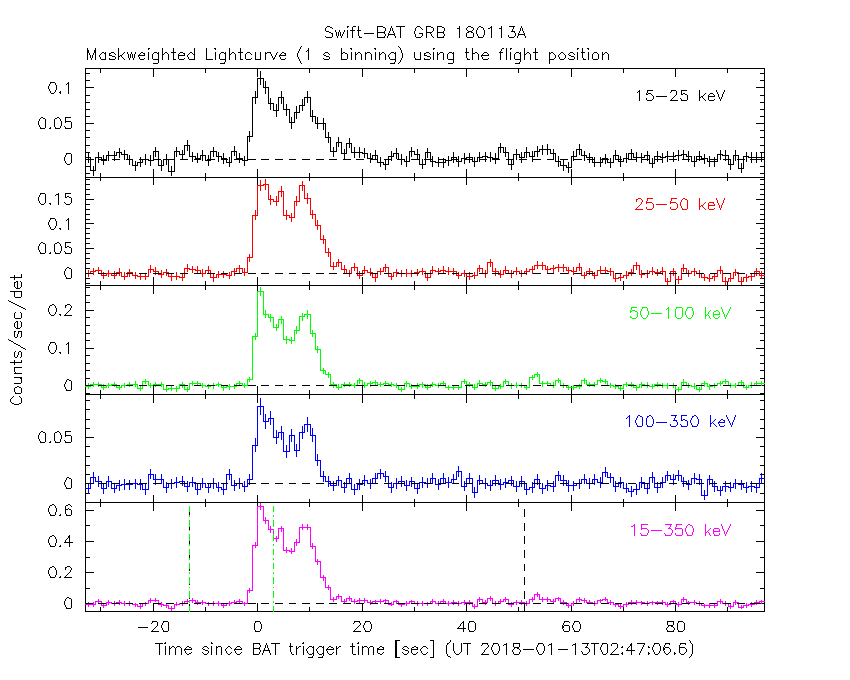
The mask-weighted light curve (Figure 1) shows some weak emissions that starts at ~T-15 s, followed by the main structure with several overlapping pulses from ~
The time-averaged spectrum from T-12.98 to T+67.02 s is best fit by a simple power-law model.
The power law index of the time-averaged spectrum is 1.08 ± 0.06.
The fluence in the 15-150 keV band is 4.8 ± 0.2 x 1
The results of the batgrbproduct analysis are available at https://gcn.gsfc.nasa.gov/notices_s/804999/BA/.
XRT refined results are not available.
UVOT results are not available.
Figure 1. The BAT
mask-weighted light curve in the four individual and total
energy bands. The units are counts
| RA (J2000) | Dec (J2000) | Error | Note | Reference |
|---|---|---|---|---|
| 0 |
+68°40'55.9" | 1.0' | BAT-refined | Ukwatta et al. GCN Circ. 22332 |
| Band | Authors | GCN Circ. | Subject | Observatory | Notes |
|---|---|---|---|---|---|
| Optical | Zheng and Filippenko | 22330 | KAIT Optical Observations | KAIT | |
| Gamma-ray | Veres | 22328 | Fermi GBM observation | Fermi GBM | Fluence=1.007±0.012x1 (7 |
| Gamma-ray | Frederiks et al. | 22344 | Konus-Wind observation | Konus-Wind | |
| Gamma-ray | Torii et al. | 22359 | CALET Gamma-Ray Burst Monitor detection | CALET | |
| Gamma-ray | Sharma et al. | 22363 | AstroSat CZTI detection | CZTI |
April 13, 2018