M.H. Siegel (PSU) and K.L. Page (U. Leicester) for the Swift team
At 14:21:44 UT, the Swift Burst Alert Telescope (BAT) triggered and located GRB 180720B (trigger=848890) (Siegel et al. GCN Circ. 22973). Swift slewed immediately to the burst. At the time of the trigger, the initial BAT position was 118° from the Sun (7.9 hours West) and 142° from the 58%-illuminated Moon. Table 1 contains the best reported positions from Swift, and the latest XRT position can be viewed at http://www.swift.ac.uk/xrt_positions.
Martone et al. (GCN Circ. 22976) reported the position from LCO for the optical afterglow of this GRB. Vreeswijk et al. (GCN Circ. 22996) determined a redshift of 0.654 from VLT. Table 2 is a summary of GCN Circulars about this GRB from observatories other than Swift.
Standard analysis products for this burst are available at https://gcn.gsfc.nasa.gov/swift_gnd_ana.html.
As reported by Barthelmy et al. (GCN Circ. 22998),
the BAT ground-calculated position is RA, Dec = 0.528, -2.925 deg which is RA(J2000) = 0
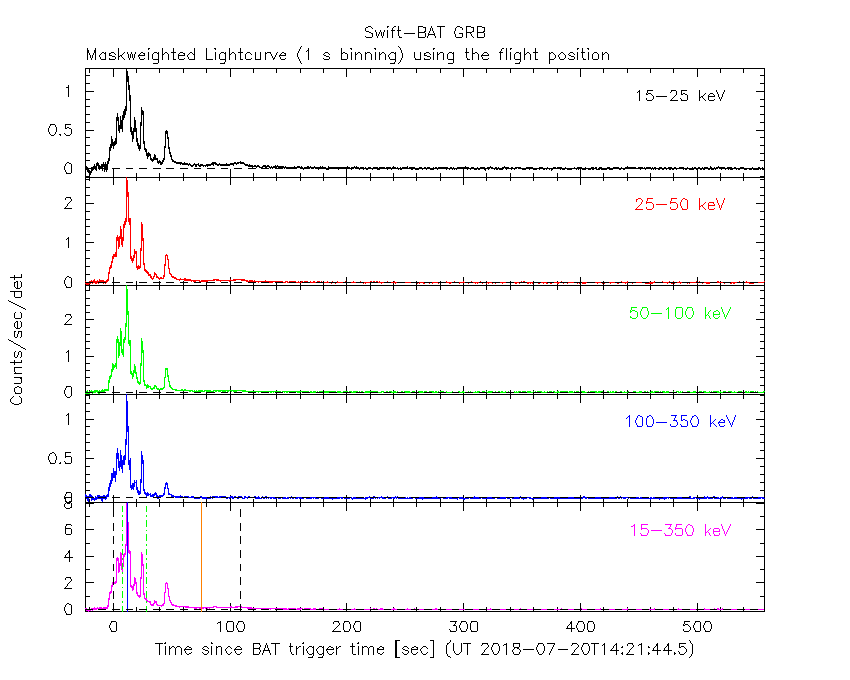
The mask-weighted light curve (Figure 1) shows a multi-peaked structure, with the main peak occurs around ~T+11 s.
The burst emission starts around ~T-20 s, although there might be additional emission before the GRB came into the BAT FOV at ~T-57 s.
The burst lasts beyond the available event data range (until T+962 s).
Analysis using the BAT survey data shows that the burst emission extends at least till ~ T+2000 s, when Swift went into SAA and no more data were collected.
The burst came back into the BAT FOV at ~
The time-averaged spectrum from T-20.0 to T+961.1 s is best fit by a simple power-law model.
The power law index of the time-averaged spectrum is 1.36 ± 0.03.
The fluence in the 15-150 keV band is 8.6 ± 0.1 x 1
The results of the batgrbproduct analysis are available at https://gcn.gsfc.nasa.gov/notices_s/848890/BA/.
Analysis of the initial XRT data was reported by Page et al. (GCN Circ. 22984). We have analysed 60 ks of XRT data for GRB 180720B, from 76 s to 1224.0 ks after the BAT trigger. The data comprise 3.3 ks in Windowed Timing (WT) mode (the first 8 s were taken while Swift was slewing) with the remainder in Photon Counting (PC) mode.
The late-time light curve (Figure 2) (from T0+5.6 ks) can be modelled with an initial power-law decay with an index of α=1.329 (+0.014, -0.015), followed by a break at T+172 ks to an α of 1.52 (+0.17, -0.06).
A spectrum formed from the WT mode data can be fitted with an absorbed power-law with a photon spectral index of 1.761 ± 0.010. The best-fitting absorption column is 1.77 ± 0.07 x 1
A summary of the PC-mode spectrum is thus:
Galactic foreground: 3.9 x 1
Intrinsic column: 2.4 ± 0.4 x 1
Photon index: 1.83 ± 0.06
The results of the XRT team automatic analysis are available at http://www.swift.ac.uk/xrt_products/00848890.
UVOT results are not available.
Figure 1. The BAT
mask-weighted light curve in the four individual and total
energy bands. The units are counts
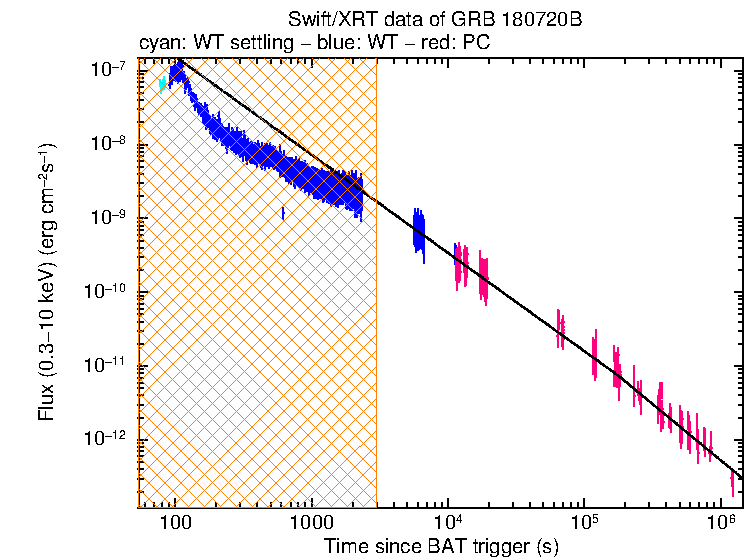
Figure 2. The XRT light curve.
Any data from a crosshatched region are not included in the fit.
| RA (J2000) | Dec (J2000) | Error | Note | Reference |
|---|---|---|---|---|
| 0 |
-02°55'08.1" | 3.5" | XRT-final | UKSSDC |
| 0 |
-02°55'08.1" | 3.5" | XRT-refined | Page et al. GCN Circ. 22984 |
| 0 |
-02°55'31.3" | 1.2' | BAT-refined | Barthelmy et al. GCN Circ. 22998 |
| Band | Authors | GCN Circ. | Subject | Observatory | Notes |
|---|---|---|---|---|---|
| Optical | Martone et al. | 22976 | LCO Haleakala possible bright optical candidate |
LCO | possible detection |
| Optical | Sasada et al. | 22977 | Kanata 1.5m optical/NIR observation | Kanata | detection |
| Optical | Reva et al. | 22979 | TSHAO optical observations | Zeiss-1000 | detection |
| Optical | Itoh et al. | 22983 | MITSuME Akeno optical observations | MITSuME Akeno | detection |
| Optical | Kann et al. | 22985 | OSN detection, fading slower? | Obs.de Sierra Nevada | detection |
| Optical | Crouzet and Malesani | 22988 | LCO optical afterglow observations | LCO | |
| Optical | Vreeswijk et al. | 22996 | VLT/X-shooter redshift | VLT | redshift |
| Optical | Horiuchi et al. | 23004 | MITSuME Ishigaki optical observations | MITSuME | detection |
| Optical | Watson et al. | 23017 | COATLI Optical Detection | COATLI | detection |
| Optical | Schmalz et al. | 23020 | ISON-Castelgrande optical observations | detection | |
| Optical | Covino and Fugazza | 23021 | REM photometry | REM | |
| Optical | Lipunov et al. | 23023 | MASTER Global Net OT observations | MASTER | |
| Optical | Jelinek et al. | 23024 | D50 optical observations | D50 | detection |
| Optical | Zheng and Filippenko | 23033 | KAIT Optical Observations | KAIT | detection |
| Optical | Izzo et al. | 23040 | OAJ optical observations | Obs. Astro. de Javalambre | detection |
| Radio | Sfaradi et al. | 23037 | AMI-LA 15.5 GHz observation | AMI | |
| Radio | Chandra et al. | 23073 | GMRT radio detection | GMRT | detection |
| X-ray | Negoro et al. | 22993 | MAXI/GSC detection | MAXI | detection |
| X-ray | Bellm and Cenko | 23041 | NuSTAR observations | NuSTAR | |
| Gamma-ray | Bissaldi and Racusin | 22980 | Fermi-LAT detection | Fermi LAT | |
| Gamma-ray | Roberts and Meegan | 22981 | Fermi GBM observation | Fermi GBM | |
| Gamma-ray | Frederiks et al. | 23011 | Konus-Wind observation | Konus-Wind | |
| Gamma-ray | Cherry et al. | 23042 | CALET Gamma-Ray Burst Monitor detection | CALET | |
| Other | Evans | 22986 | GCN Circ. 22984 was for GRB 180720B | ||
| Other | Ruffini et al. | 23019 | Testing the universality of the newly born neutron star in BdHNe |
||
| Other | 23036 | long follow up requested |
August 4, 2018