S.J. LaPorte (PSU), P. D'Avanzo (INAF-OAB) and M.H. Siegel (PSU) for the Swift team
At 03:10:49 UT, the Swift Burst Alert Telescope (BAT) triggered and located GRB 190114A (trigger=883600) (LaPorte et al. GCN Circ. 23677). Swift slewed immediately to the burst. At the time of the trigger, the initial BAT position was 128° from the Sun (8.7 hours East) and 44° from the 49%-illuminated Moon. Table 1 contains the best reported positions from Swift, and the latest XRT position can be viewed at http://www.swift.ac.uk/xrt_positions.
Siegel and LaPorte (GCN Circ. 23678) reported the detection with UVOT of an optical afterglow. Bolmer and Schady (GCN Circ. 23682) reported the position from GROND for the optical afterglow of this GRB. de Ugarte Postigo et al. (GCN Circ. 23680) determined a redshift of 3.3765 from VLT. Table 2 is a summary of GCN Circulars about this GRB from observatories other than Swift.
Standard analysis products for this burst are available at https://gcn.gsfc.nasa.gov/swift_gnd_ana.html.
As reported by Barthelmy et al. (GCN Circ. 23685),
the BAT ground-calculated position is RA, Dec = 65.543, 2.196 deg which is RA(J2000) = 0
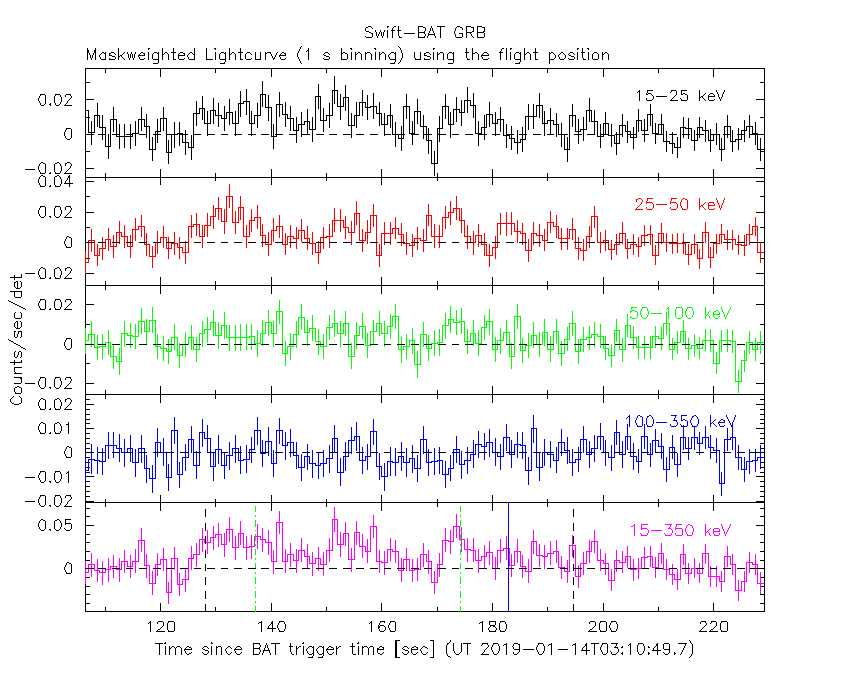
The mask-weighted light curve (Figure 1) shows some weak-overlapping pulses that start at ~T+125 s and end at ~T+200 s.
The time-averaged spectrum from T+126.40 to T+199.22 s is best fit by a simple power-law model.
The power law index of the time-averaged spectrum is 2.06 ± 0.22.
The fluence in the 15-150 keV band is 8.0 ± 1.2 x 1
The results of the batgrbproduct analysis are available at https://gcn.gsfc.nasa.gov/notices_s/883600/BA/.
Analysis of the initial XRT data was reported by D'Avanzo et al. (GCN Circ. 23683). We have analysed 16 ks of XRT data for GRB 190114A, from 235 s to 127.8 ks after the BAT trigger. The data comprise 64 s in Windowed Timing (WT) mode (the first 9 s were taken while Swift was slewing) with the remainder in Photon Counting (PC) mode. The enhanced XRT position for this burst was given by Evans et al. (GCN Circ. 23679).
The light curve (Figure 2) can be modelled with a series of power-law decays. The initial decay index is α=7.87 (+0.13, -0.43). At T+403 s the decay flattens to an α of 0.01 (+0.20, -0.17) before breaking again at T+2409 s to a final decay with index α=1.16 ± 0.07.
A spectrum formed from the WT mode data can be fitted with an absorbed power-law with a photon spectral index of 2.38 (+0.17, -0.12). The best-fitting absorption column is 1 (+13, -1) x 1
A summary of the PC-mode spectrum is thus:
Galactic foreground: 1.6 x 1
Intrinsic column: 4.4 (+9.8, -4.4) x 1
Photon index: 1.83 (+0.09, -0.08)
The results of the XRT team automatic analysis are available at http://www.swift.ac.uk/xrt_products/00883600.
Analysis of the UVOT data was reported by Siegel and LaPorte (GCN Circ. 23678).
UVOT took a finding chart exposure of 150 seconds with the White filter starting 859 seconds after the BAT trigger.
Table 3 gives preliminary
magnitudes using the UVOT photometric system
(Breeveld et al. 2011, AIP Conf. Proc., 1358, 373).
No correction has been made for the expected extinction in the Milky Way
corresponding to a reddening of
The Swift/UVOT began settled observations of the field of GRB 190114A 258 s after the BAT trigger
(Siegel and LaPorte GCN Circ. 23719).
We confirm a source consistent with the XRT position (Evans et al. GCN Circ. 23681) as initially reported in UVOT (Siegel \& LaPorte, GCN Circ. 23678) and later detected by GROND (Bolmer \& Schady, GCN Circ. 23682), OSN (de Ugarte Postigo et al., GCN Circ. 23687) and NOT (Selsing et al., GCN Circ. 23697).
Table 3 gives preliminary
magnitudes using the UVOT photometric system
(Breeveld et al. 2011, AIP Conf. Proc., 1358, 373).
No correction has been made for the expected extinction in the Milky Way
corresponding to a reddening of
Figure 1. The BAT
mask-weighted light curve in the four individual and total
energy bands. The units are counts
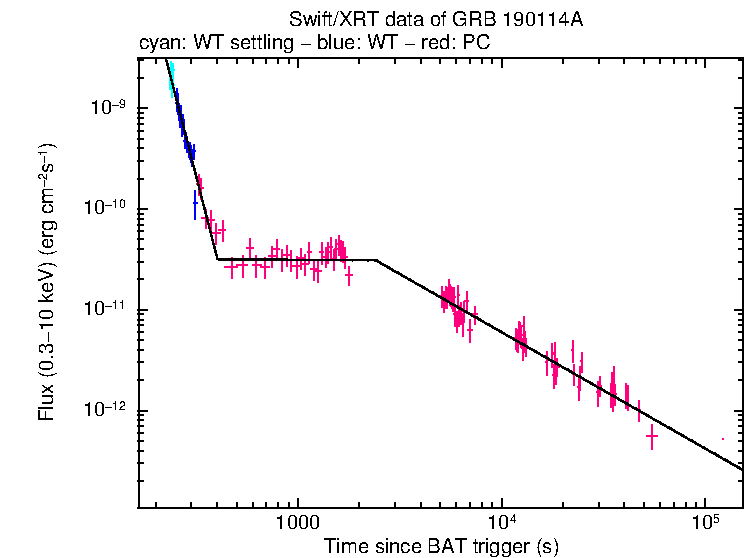
Figure 2. The XRT light curve.
Any data from a crosshatched region are not included in the fit.
| RA (J2000) | Dec (J2000) | Error | Note | Reference |
|---|---|---|---|---|
| 0 |
+02°11'29.6" | 0.42" | UVOT-refined | Siegel and LaPorte GCN Circ. 23719 |
| 0 |
+02°11'29.1" | 1.4" | XRT-final | UKSSDC |
| 0 |
+02°11'29.4" | 1.7" | XRT-enhanced | Evans et al. GCN Circ. 23681 |
| 0 |
+02°11'45.8" | 1.7' | BAT-refined | Barthelmy et al. GCN Circ. 23685 |
| Band | Authors | GCN Circ. | Subject | Observatory | Notes |
|---|---|---|---|---|---|
| Optical | de Ugarte Postigo et al. | 23680 | VLT/X-shooter redshift | VLT | redshift |
| Optical | Bolmer and Schady | 23682 | GROND detection of the afterglow | GROND | detection |
| Optical | de Ugarte Postigo et al. | 23687 | OSN Detection | Obs.de Sierra Nevada | detection |
| Optical | Selsing et al. | 23697 | NOT optical observations | NOT | |
| Optical | Mazaeva et al. | 23718 | Mondy optical afterglow detectio | Mondy | detection |
| Optical | Paek et al. | 23731 | DOAO/LOAO optical observation | DOAO | |
| Optical | Paek et al. | 23738 | DOAO/LOAO optical observation | DOAO | |
| Radio | de Ugarte Postigo et al. | 23739 | NOEMA detection of the mm afterglow | NOEMA | detection |
| Filter | Exp(s) | Mag | ||
|---|---|---|---|---|
| white (fc) | 258 | 408 | 147 | >20.58 |
| white | 514 | 1701 | 264 | 19.69±0.13 |
| v | 564 | 1752 | 136 | 18.33±0.22 |
| b | 490 | 1676 | 136 | 19.57±0.27 |
| u | 465 | 1825 | 155 | >19.64 |
| uvw1 | 440 | 1801 | 155 | >19.17 |
| uvm2 | 5866 | 7502 | 393 | >19.66 |
| uvw2 | 540 | 1726 | 136 | >19.12 |
Table 3. UVOT observations reported by Siegel and LaPorte (GCN Circ. 23719). The start and stop times of the exposures are given in seconds since the BAT trigger. The preliminary detections and 3-σ upper limits are given. No correction has been made for extinction in the Milky Way.
January 17, 2019