J.D. Gropp (PSU), V. D'Elia (ASDC) and M.H. Siegel (PSU) for the Swift team
At 20:57:03 UT, the Swift Burst Alert Telescope (BAT) triggered and located GRB 190114C (trigger=883832) (Gropp et al. GCN Circ. 23688). Swift slewed immediately to the burst. At the time of the trigger, the initial BAT position was 103° from the Sun (7.9 hours East) and 41° from the 56%-illuminated Moon. Table 1 contains the best reported positions from Swift, and the latest XRT position can be viewed at http://www.swift.ac.uk/xrt_positions.
Gropp et al. (GCN Circ. 23688) reported the discovery with UVOT of an optical afterglow. Tyurina et al. (GCN Circ. 23690) reported the position from MASTER for the optical afterglow of this GRB. Selsing et al. (GCN Circ. 23695) determined a redshift of 0.42 from NOT, and Castro-Tirado. Y. Hu et al. (GCN Circ. 23708) determined a redshift of 0.4245 from GTC. Table 2 is a summary of GCN Circulars about this GRB from observatories other than Swift.
Standard analysis products for this burst are available at https://gcn.gsfc.nasa.gov/swift_gnd_ana.html.
As reported by Krimm et al. (GCN Circ. 23724),
the BAT ground-calculated position is RA, Dec = 54.503, -26.938 deg which is RA(J2000) = 0
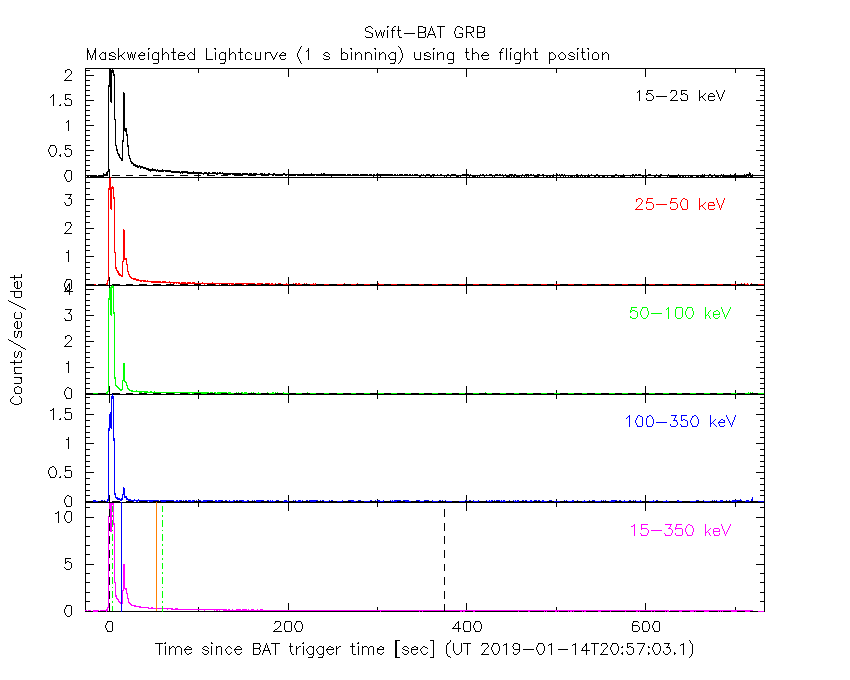
The mask-weighted light curve (Figure 1) shows a multi-peaked structure that starts at ~T-7 s.
The brightest emission contains two complex pulses and ends at ~T+50 s.
Afterwards, the emission appeared to decay exponentially out to beyond ~T+720 s, when the burst went out of the BAT field of view.
The burst did not come back into the BAT field of view until ~T+3800, and nothing significant was detected at that time.
The time-averaged spectrum from -6.604 to 703.192 s is best fit by a simple power-law model.
The power law index of the time-averaged spectrum is 1.43 ± 0.02.
The fluence in the 15-150 keV band is 8.3 ± 0.1 x 1
The results of the batgrbproduct analysis are available at https://gcn.gsfc.nasa.gov/notices_s/883832/BA/.
Analysis of the initial XRT data was reported by D'Elia et al. (GCN Circ. 23706). We have analysed 116 ks of XRT data for GRB 190114C, from 58 s to 2477.6 ks after the BAT trigger. The data comprise 1.0 ks in Windowed Timing (WT) mode (the first 4 s were taken while Swift was slewing) with the remainder in Photon Counting (PC) mode. The enhanced XRT position for this burst was given by Osborne et al. (GCN Circ. 23704).
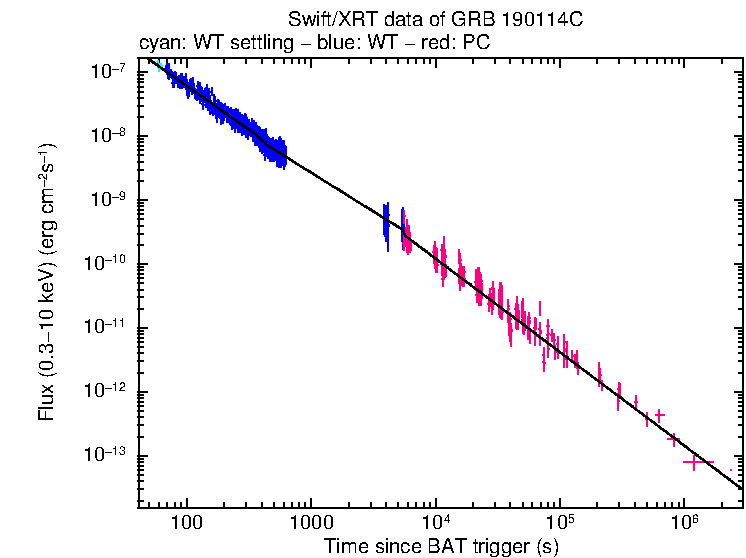
The light curve (Figure 2) can be modelled with a series of power-law decays. The initial decay index is α=1.367 ± 0.025. At T+361 s the decay steepens to an α of 1.81 (+0.60, -0.19). The light curve breaks again at T+449 s to a decay with α=1.216 (+0.019, -0.017), and again at T+5520 s s to α=8.0 (+0.0, -4.4), before a final break at T+5649 s s after which the decay index is 1.464 (+0.025, -0.023).
A spectrum formed from the WT mode data can be fitted with an absorbed power-law with a photon spectral index of 1.66 ± 0.04. The best-fitting absorption column is 8.19 (+0.24, -0.23) x 1
A summary of the PC-mode spectrum is thus:
Galactic foreground: 7.5 x 1
Intrinsic column: 7.7 ± 0.6 x 1
Photon index: 1.81 (+0.11, -0.10)
The results of the XRT team automatic analysis are available at http://www.swift.ac.uk/xrt_products/00883832.
The Swift/UVOT began settled observations of the field of GRB 190114C 74 s after the BAT trigger
(Siegel and Gropp GCN Circ. 23725).
A source consistent with the XRT position (Osborne et al. GCN Circ. 23704) and previously reported optical detections (Tyurina et al., GCN Circ. 23690, Selsing et al., GCN Circ. 23695, Izzy et al., GCN Circ. 23699, Bolmer & Schady, GCN Circ. 23702, Im et al., GCN Circ. 23717) is detected in the initial UVOT exposures.
Table 3 gives preliminary
magnitudes using the UVOT photometric system
(Breeveld et al. 2011, AIP Conf. Proc., 1358, 373).
No correction has been made for the expected extinction in the Milky Way
corresponding to a reddening of

Figure 1. The BAT
mask-weighted light curve in the four individual and total
energy bands. The units are counts

Figure 2. The XRT light curve.
Any data from a crosshatched region are not included in the fit.
| RA (J2000) | Dec (J2000) | Error | Note | Reference |
|---|---|---|---|---|
| 0 |
-26°56'46.9" | 0.42" | UVOT-refined | Siegel and Gropp GCN Circ. 23725 |
| 0 |
-26°56'47.8" | 1.4" | XRT-final | UKSSDC |
| 0 |
-26°56'47.6" | 1.4" | XRT-enhanced | Osborne et al. GCN Circ. 23704 |
| 0 |
-26°56'17.5" | 1.0' | BAT-refined | Krimm et al. GCN Circ. 23724 |
| Band | Authors | GCN Circ. | Subject | Observatory | Notes |
|---|---|---|---|---|---|
| Optical | Tyurina et al. | 23690 | MASTER afterglow Detection | MASTER | detection |
| Optical | de Ugarte Postigo et al. | 23692 | Possible host galaxy in Pan-STARRS | Pan-STARRS | |
| Optical | Lipunov et al. | 23693 | MASTER 4-polarizations filters OT detection |
MASTER | detection |
| Optical | Selsing et al. | 23695 | NOT optical counterpart and redshift | NOT | redshift |
| Optical | Izzo et al. | 23699 | OASDG optical observations | S.Di Giacomo Obs. | detection |
| Optical | Bolmer and Schady | 23702 | GROND detection of the afterglow | GROND | detection |
| Optical | Castro-Tirado. Y. Hu et al. | 23708 | refined redshift by the 10.4m GTC | GTC | redshift |
| Optical | Kann et al. | 23710 | X-shooter observations of a highly extinguished afterglow |
X-shooter | |
| Optical | Im et al. | 23717 | Optical observations | ||
| Optical | Mazaeva et al. | 23727 | Mondy optical observations | Mondy | |
| Optical | D'Avanzo et al. | 23729 | REM optical/NIR detection | REM | detection |
| Optical | Kim and Im | 23732 | LSGT optical observation | Lee Sang Gak Telescope | |
| Optical | Kumar et al. | 23733 | GRowth-India detection of optical afterglow |
GROWTH-India | detection |
| Optical | Kim et al. | 23734 | KMTNet optical observation | ||
| Optical | Im et al. | 23740 | UKIRT JHK observation | UKIRT | detection |
| Optical | Mazaeva et al. | 23741 | CHILESCOPE optical observations | detection | |
| Optical | Kumar et al. | 23742 | Optical detection from HCT | Himalayan Chandra Telescope | detection |
| Optical | Mazaeva et al. | 23746 | continued CHILESCOPE optical obs | detection | |
| Optical | Im et al. | 23747 | Continued UKIRT JHK observation | UKIRT | |
| Optical | Ragosta et al. | 23748 | ePESSTO NTT optical observations | PESSTO | detection |
| Optical | Watson et al. | 23749 | COATLI Optical Detection | COATLI | detection |
| Optical | Watson et al. | 23751 | RATIR Optical and NIR Detections | RATIR | detection |
| Optical | D'Avanzo | 23754 | REM optical/NIR detection (CORRECTION) | REM | detection |
| Optical | Im et al. | 23756 | UKIRT JHK observation continuation - steady fading? |
UKIRT | |
| Optical | Im et al. | 23757 | UKIRT JHK observation (CORRECTIONS) | UKIRT | |
| Optical | Bikmaev et al. | 23766 | RTT150 optical observations | RTT150 | detection |
| Optical | Mazaeva et al. | 23787 | CHILESCOPE optical observations | detection | |
| Optical | Singh et al. | 23798 | Optical follow-up from HCT | Himalayan Chandra Telescope | detection |
| Radio | Alexander et al. | 23726 | VLA Detection | VLA | detection |
| Radio | Laskar et al. | 23728 | ALMA detection of a fading mm counterpart |
ALMA | detection |
| Radio | Schulze et al. | 23745 | ATCA detection of the radio afterglow | ATCA | detection |
| Radio | Volvach et al. | 23750 | RT-22 detection at 36.8 GHz | CrAO RT-22 | detection |
| Radio | Marongiu et al. | 23753 | Sardinia Radio Telescope observations | ||
| Radio | Marongiu | 23755 | Sardinia Radio Telescope observations (CORRECTION) |
||
| Radio | Tremou et al. | 23760 | MeerKAT radio observation | detection | |
| Radio | Cherukuri et al. | 23762 | GMRT detection at 1.26GHz | GMRT | detection |
| Radio | Smith et al. | 23823 | JCMT SCUBA-2 sub-mm observations | SCUBA | |
| X-ray | 23698 | #: Planned XMM-Newton observation | XMM | plans | |
| X-ray | 23700 | CORRECTED TARGET NAME: GRB 190114C: Planned XMM-Newton observation |
XMM | plans | |
| Gamma-ray | Mirzoyan and Noda | 23701 | MAGIC detects the GRB 190114C in the TeV energy domain |
MAGIC | |
| Gamma-ray | Hamburg et al. | 23707 | Fermi GBM detection | Fermi GBM | |
| Gamma-ray | Kocevski et al. | 23709 | Fermi-LAT detection | Fermi LAT | |
| Gamma-ray | Ursi et al. | 23712 | AGILE/MCAL detection | AGILE | |
| Gamma-ray | Minaev and Pozanenko | 23714 | SPI-ACS/INTEGRAL extended emission detection |
INTEGRAL | |
| Gamma-ray | Xiao et al. | 23716 | Insight-HXMT/HE detection | Insight-HXMT | |
| Gamma-ray | Frederiks et al. | 23737 | Konus-Wind observation | Konus-Wind | |
| Other | Ruffini et al. | 23715 | A type 1 BdHN with TeV emission | ||
| Other | Dado | 23735 | Long follow up urged | light curve | |
| Other | Melandri et al. | 23983 | photometric detection of a SN component | ||
| Other | Giroletti et al. | 24766 | East Asia VLBI Network observations |
| Filter | Exp(s) | Mag | ||
|---|---|---|---|---|
| white (fc) | 74 | 224 | 147 | 14.89±0.02 |
| white | 566 | 586 | 19 | 16.90±0.07 |
| white | 5851 | 6050 | 196 | 19.19±0.09 |
| white | 21950 | 22857 | 885 | 20.22±0.09 |
| v | 616 | 627 | 10 | 16.28±0.19 |
| v | 16295 | 17136 | 820 | 18.97±0.13 |
| v | 26775 | 27682 | 885 | 19.41±0.24 |
| v | 39149 | 57221 | 1694 | 19.92±0.20 |
| b | 542 | 561 | 19 | 17.38±0.14 |
| b | 5646 | 5845 | 196 | 19.38±0.16 |
| b | 21038 | 46521 | 1591 | 20.83±0.26 |
| u (fc) | 286 | 536 | 245 | 17.58±0.07 |
| u | 33738 | 34038 | 295 | >20.28 |
| uvw1 | 4044 | 51522 | 3671 | 21.05±0.31 |
| uvm2 | 3839 | 50615 | 3251 | 21.00±0.30 |
| uvw2 | 6056 | 56384 | 3552 | >21.33 |
Table 3. UVOT observations reported by Siegel and Gropp (GCN Circ. 23725). The start and stop times of the exposures are given in seconds since the BAT trigger. The preliminary detections and 3-σ upper limits are given. No correction has been made for extinction in the Milky Way.
June 7, 2019