A.Y. Lien (GSFC/UMBC) and P. Kuin (UCL/MSSL) for the Swift team
At 01:39:30 UT, the Swift Burst Alert Telescope (BAT) triggered and located GRB 190202A (trigger=887217) (Lien et al. GCN Circ. 23830). Swift slewed immediately to the burst. At the time of the trigger, the initial BAT position was 149° from the Sun (9.9 hours West) and 118° from the 7%-illuminated Moon. Table 1 contains the best reported positions from Swift, and the latest XRT position can be viewed at http://www.swift.ac.uk/xrt_positions.
Lien et al. (GCN Circ. 23830) reported the discovery with UVOT of an optical afterglow. Table 2 is a summary of GCN Circulars about this GRB from observatories other than Swift.
Standard analysis products for this burst are available at https://gcn.gsfc.nasa.gov/swift_gnd_ana.html.
As reported by Markwardt et al. (GCN Circ. 23836),
the BAT ground-calculated position is RA, Dec = 166.506, 9.393 deg which is RA(J2000) = 1
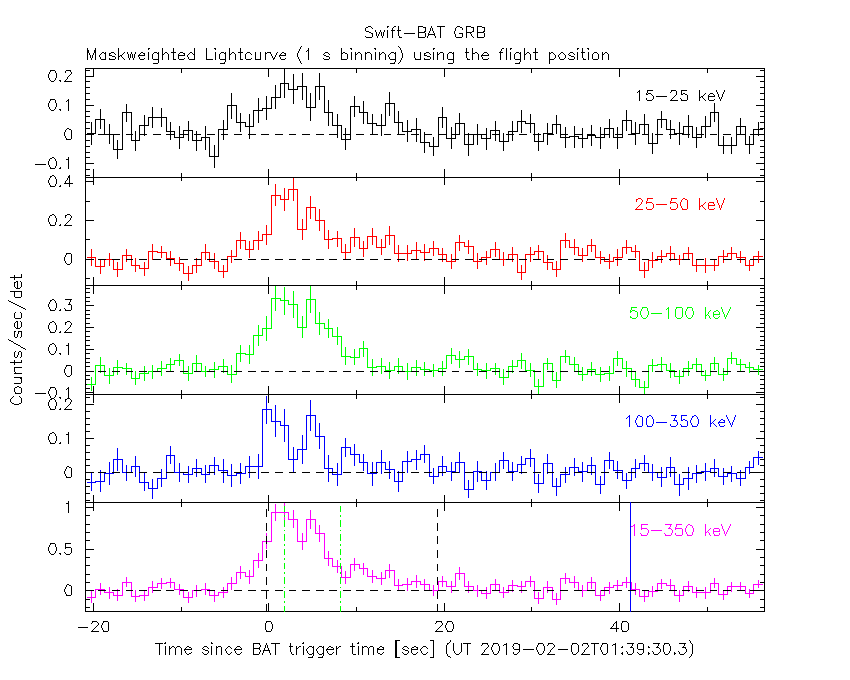
The mask-weighted light curve (Figure 1) shows two overlapping pulses that start at ~
The time-averaged spectrum from T-0.90 to T+26.52 s is best fit by a simple power-law model.
The power law index of the time-averaged spectrum is 1.32 ± 0.13.
The fluence in the 15-150 keV band is 6.0 ± 0.5 x 1
The results of the batgrbproduct analysis are available at https://gcn.gsfc.nasa.gov/notices_s/887217/BA/.
Analysis of the initial XRT data was reported by Lien (GCN Circ. 23840). We have analysed 32 ks of XRT data for GRB 190202A, from 152 s to 500.7 ks after the BAT trigger. The data comprise 823 s in Windowed Timing (WT) mode (the first 9 s were taken while Swift was slewing) with the remainder in Photon Counting (PC) mode. The enhanced XRT position for this burst was given by Evans et al. (GCN Circ. 23832).
The light curve (Figure 2) can be modelled with an initial power-law decay with an index of α=0.594 (+0.021, -0.085), followed by a break at T+1874 s to an α of 1.453 (+0.025, -0.027).
A spectrum formed from the WT mode data can be fitted with an absorbed power-law with a photon spectral index of 1.88 ± 0.05. The best-fitting absorption column is consistent with the Galactic value of 2.4 x 1
A summary of the PC-mode spectrum is thus:
Total column: 6.8 (+3.1, -2.8) x 1
Galactic foreground: 2.4 x 1
Excess significance: 2.5 σ
Photon index: 1.82 ± 0.12
The results of the XRT team automatic analysis are available at http://www.swift.ac.uk/xrt_products/00887217.
The Swift/UVOT began settled observations of the field of GRB 190202A 173 s after the BAT trigger
(Kuin and Lien GCN Circ. 23834).
The source was also observed in R (Novichonok et al., GCN Circ. 23831).
Table 3 gives preliminary
magnitudes using the UVOT photometric system
(Breeveld et al. 2011, AIP Conf. Proc., 1358, 373).
No correction has been made for the expected extinction in the Milky Way
corresponding to a reddening of
Figure 1. The BAT
mask-weighted light curve in the four individual and total
energy bands. The units are counts
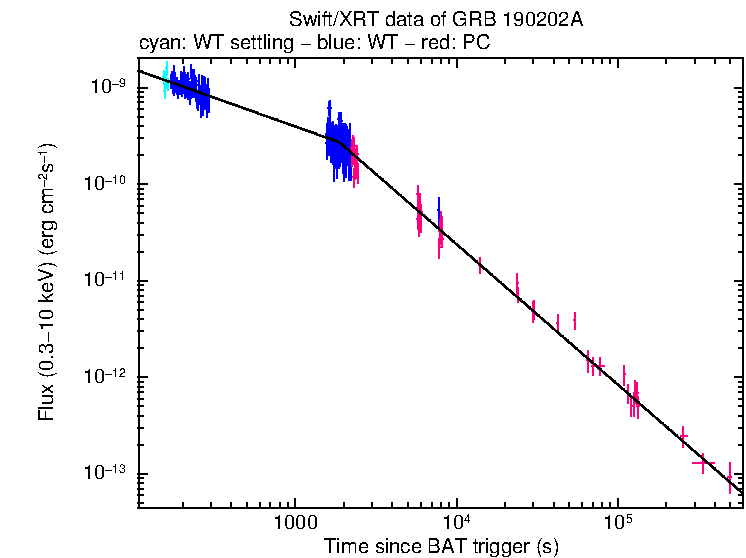
Figure 2. The XRT light curve.
Any data from a crosshatched region are not included in the fit.
| RA (J2000) | Dec (J2000) | Error | Note | Reference |
|---|---|---|---|---|
| 1 |
+09°22'36.7" | 0.42" | UVOT-refined | Kuin and Lien GCN Circ. 23834 |
| 1 |
+09°22'36.7" | 1.5" | XRT-final | UKSSDC |
| 1 |
+09°22'36.8" | 1.7" | XRT-enhanced | Evans et al. GCN Circ. 23832 |
| 1 |
+09°23'33.9" | 1.9' | BAT-refined | Markwardt et al. GCN Circ. 23836 |
| Band | Authors | GCN Circ. | Subject | Observatory | Notes |
|---|---|---|---|---|---|
| Optical | Novichonok et al. | 23831 | Koshka Zeiss-1000 optical observations | Zeiss-1000 | detection |
| Optical | Steeghs et al. | 23833 | GOTO optical observations | Gravitational-wave Optical Transient Observer | detection |
| Optical | Cucchiara | 23839 | LCO-CTIO optical observations | LCO | detection |
| Optical | Paek et al. | 23841 | McDonald 0.8-m telescope optical observation |
McDonald 0.8 | detection |
| Optical | Malesani et al. | 23842 | NOT optical observations | NOT | |
| Optical | Belkin et al. | 23843 | TSHAO optical observations | Zeiss-1000 | |
| Optical | Moskvitin and Spiridonova | 23844 | SAO RAS optical observations | SAO RAS | detection |
| Optical | Kumar et al. | 23853 | R and I band observation from HCT | Himalayan Chandra Telescope | detection |
| Optical | Moskvitin et al. | 23870 | SAO RAS further optical observations | SAO RAS | detection |
| Optical | Xu et al. | 23871 | Xinglong-2.16m optical observations | Xinglong | |
| Optical | Kumar et al. | 23874 | GROWTH-India detection of optical afterglow |
GROWTH-India | detection |
| Optical | Sokolov et al. | 23881 | Terskol 2-m optical observations | Terskol | detection |
| Gamma-ray | Verrecchia et al. | 23835 | AGILE ratemeters detection | AGILE | |
| Gamma-ray | Veres and Meegan | 23838 | Fermi GBM observation | Fermi GBM | Fluence=1.81±0.03x1 (8 |
| Gamma-ray | Sharma et al. | 23875 | AstroSat CZTI detection | CZTI |
| Filter | Exp(s) | Mag | ||
|---|---|---|---|---|
| white | 173 | 299 | 124 | 16.02 ± 0.03 |
| v | 1613 | 2153 | 78 | 17.94 ± 0.18 |
| b | 1711 | 1903 | 39 | 18.38 ± 0.16 |
| u | 1686 | 2054 | 58 | 18.20 ± 0.17 |
| w1 | 1662 | 2376 | 97 | >18.5 |
Table 3. UVOT observations reported by Kuin and Lien (GCN Circ. 23834). The start and stop times of the exposures are given in seconds since the BAT trigger. The preliminary detections and 3-σ upper limits are given. No correction has been made for extinction in the Milky Way.
February 8, 2019