A.P. Beardmore (U. Leicester) and J.P. Osborne (U. Leicester) for the Swift team
At 19:38:58 UT, the Swift Burst Alert Telescope (BAT) triggered and located GRB 190219A (trigger=889748) (Beardmore et al. GCN Circ. 23902). Swift slewed immediately to the burst. At the time of the trigger, the initial BAT position was 112° from the Sun (9.5 hours West) and 66° from the 100%-illuminated Moon. Table 1 contains the best reported positions from Swift, and the latest XRT position can be viewed at http://www.swift.ac.uk/xrt_positions.
Table 2 is a summary of GCN Circulars about this GRB from observatories other than Swift.
Standard analysis products for this burst are available at https://gcn.gsfc.nasa.gov/swift_gnd_ana.html.
As reported by Ukwatta et al. (GCN Circ. 23913),
the BAT ground-calculated position is RA, Dec = 189.686, 76.606 deg which is RA(J2000) = 1
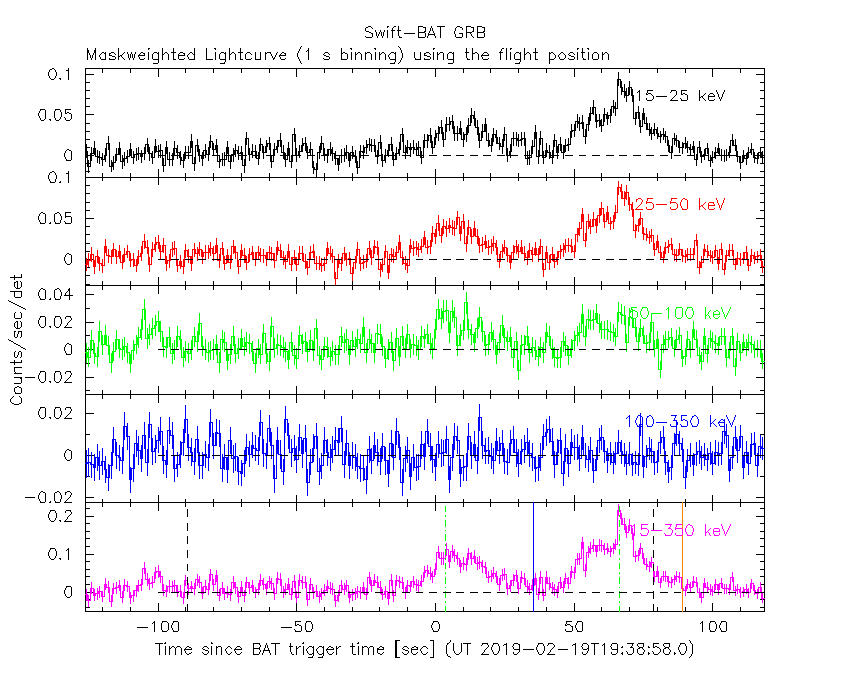
The mask-weighted light curve (Figure 1) shows a multi-peaked structure that starts at ~ T-110 s and ends at ~T+100 s.
The first major pulse starts at ~T-5 s, peaks at ~T+5 s, and end at ~T+40 s.
It is followed by the second major pulse that peaks at ~T+65 s and ends at ~T+90 s.
The time-averaged spectrum from T-106.20 to T+88.68 s is best fit by a simple power-law model.
The power law index of the time-averaged spectrum is 2.24 ± 0.10.
The fluence in the 15-150 keV band is 3.9 ± 0.2 x 1
The results of the batgrbproduct analysis are available at https://gcn.gsfc.nasa.gov/notices_s/889748/BA/.
Analysis of the initial XRT data was reported by Osborne et al. (GCN Circ. 23909). We have analysed 10 ks of XRT data for GRB 190219A, from 104 s to 81.2 ks after the BAT trigger. The data comprise 168 s in Windowed Timing (WT) mode with the remainder in Photon Counting (PC) mode. The enhanced XRT position for this burst was given by Beardmore et al. (GCN Circ. 23903).
The light curve (Figure 2) can be modelled with a series of power-law decays. The initial decay index is α=1.6 (+0.7, -0.9). At T+129 s the decay steepens to an α of 5.27 ± 0.12. The light curve breaks again at T+554 s to a decay with α=0.13 (+0.07, -0.08), before a final break at T+65.0 ks s after which the decay index is 8.0 (+0.0, -4.6).
A spectrum formed from the WT mode data can be fitted with an absorbed power-law with a photon spectral index of 2.63 ± 0.07. The best-fitting absorption column is 1.88 (+0.17, -0.16) x 1
A summary of the PC-mode spectrum is thus:
Total column: 1.7 (+0.6, -0.5) x 1
Galactic foreground: 3.5 x 1
Excess significance: 4.2 σ
Photon index: 2.12 (+0.20, -0.19)
The results of the XRT team automatic analysis are available at http://www.swift.ac.uk/xrt_products/00889748.
UVOT results are not available.
Figure 1. The BAT
mask-weighted light curve in the four individual and total
energy bands. The units are counts
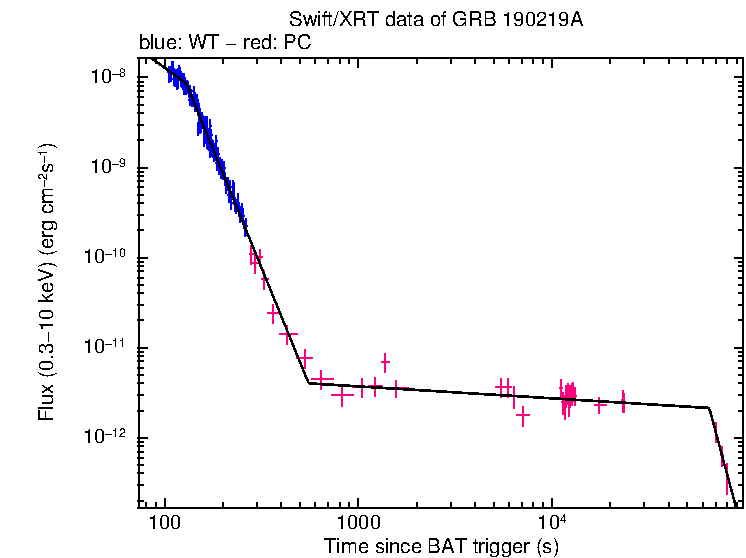
Figure 2. The XRT light curve.
Any data from a crosshatched region are not included in the fit.
| RA (J2000) | Dec (J2000) | Error | Note | Reference |
|---|---|---|---|---|
| 1 |
+76°36'44.9" | 1.6" | XRT-final | UKSSDC |
| 1 |
+76°36'45.4" | 1.7" | XRT-enhanced | Beardmore et al. GCN Circ. 23907 |
| 1 |
+76°36'21.6" | 1.6' | BAT-refined | Ukwatta et al. GCN Circ. 23913 |
| Band | Authors | GCN Circ. | Subject | Observatory | Notes |
|---|---|---|---|---|---|
| Optical | del Pulgar et al. | 23904 | BOOTES-1 optical limits | BOOTES-1 | upper limits |
| Optical | Lipunov et al. | 23905 | MASTER Global Robotic Net optical observation |
MASTER | |
| Optical | Kann et al. | 23906 | CAHA 2.2m observations | CAHA | |
| Optical | Zhu et al. | 23910 | NEXT-0.6m optical upper limit | Xinjiang Astro. Obs. | upper limits |
| Optical | Xu et al. | 23911 | NOT optical afterglow candidate | NOT | detection |
| Optical | Volnova et al. | 23920 | CrAO and AbAO optical upper limit | Abastumani Astro. Obs. | upper limits |
February 22, 2019