V. D'Elia (SSDC), B. Sbarufatti (PSU) and J.D. Gropp (PSU) for the Swift team
At 21:23:31 UT, the Swift Burst Alert Telescope (BAT) triggered and located GRB 191031D (trigger=932608) (D'Elia et al. GCN Circ. 26112). Swift slewed immediately to the burst. At the time of the trigger, the initial BAT position was 86° from the Sun (4.5 hours East) and 71° from the 17%-illuminated Moon. Table 1 contains the best reported positions from Swift, and the latest XRT position can be viewed at http://www.swift.ac.uk/xrt_positions.
Table 2 is a summary of GCN Circulars about this GRB from observatories other than Swift.
Standard analysis products for this burst are available at https://gcn.gsfc.nasa.gov/swift_gnd_ana.html.
As reported by Sakamoto et al. (GCN Circ. 26133),
the BAT ground-calculated position is RA, Dec = 283.269, 47.645 deg which is RA(J2000) = 1
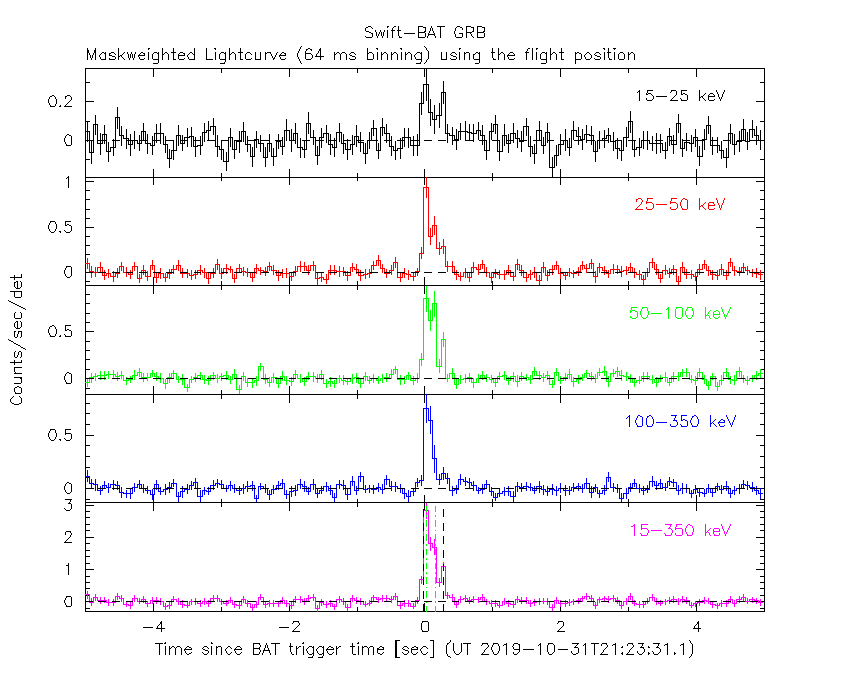
The mask-weighted light curve (Figure 1) shows a multi-peak structure from T-0.05 s to T+0.3 s with a harder first pulse and softer second pulse.
There is no sign of extended emission.
The time-averaged spectrum from T-0.03 to T+0.31 s is best fit by a simple power-law model.
The power law index of the time-averaged spectrum is 0.80 ± 0.15.
The fluence in the 15-150 keV band is 4.1 ± 0.4 x 1
The duration and hardness of GRB 191031D place it squarely within the distribution of short, hard bursts detected by BAT. Using the 4-ms binned light curve (Figure 1) , the spectral lag of the burst is 0.2 ms ± 2 ms for the 50-100 keV to 15-25 keV bands, and 0.4 ms ± 3 ms for the 100-350 keV to 25-50 keV bands. These values are consistent with a short GRB.
The results of the batgrbproduct analysis are available at https://gcn.gsfc.nasa.gov/notices_s/932608/BA/.
Analysis of the initial XRT data was reported by Sbarufatti et al. (GCN Circ. 26124). We have analysed 6.2 ks of XRT data for GRB 191031D, from 101 s to 17.5 ks after the BAT trigger. The data are entirely in Photon Counting (PC) mode.
The light curve (Figure 2) can be modelled with a power-law decay with a decay index of α=2.04 (+0.22, -0.21).
A spectrum formed from the PC mode data can be fitted with an absorbed
power-law with a photon spectral index of 1.90 (+0.26, -0.16). The
best-fitting absorption column is consistent with the Galactic value
of 6.6 x 1
The Swift/UVOT began settled observations of the field of GRB 191031D 93 s after the BAT trigger
(Gropp and D'Elia GCN Circ. 26128).
No optical afterglow consistent with the XRT position (Osborne et al. GCN Circ. 26117) is detected in the initial UVOT exposures.
Table 3 gives preliminary
magnitudes using the UVOT photometric system
(Breeveld et al. 2011, AIP Conf. Proc., 1358, 373).
No correction has been made for the expected extinction in the Milky Way
corresponding to a reddening of
Figure 1. The BAT
mask-weighted light curve in the four individual and total
energy bands. The units are counts
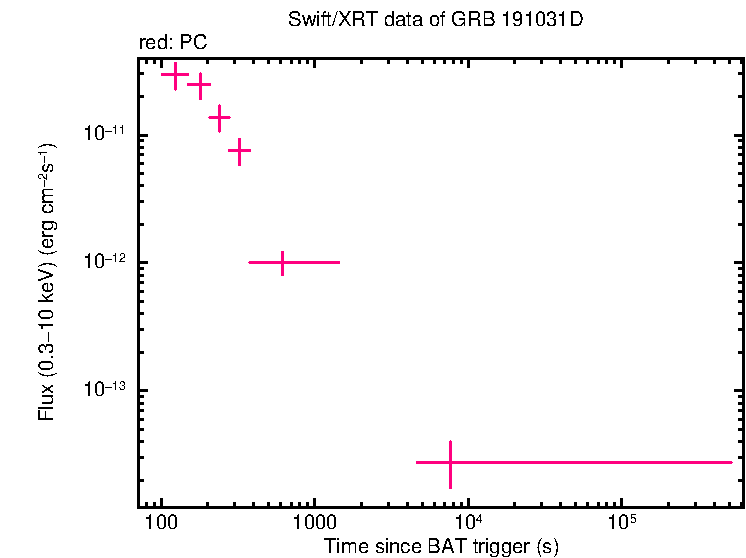
Figure 2. The XRT light curve.
Any data from a crosshatched region are not included in the fit.
| RA (J2000) | Dec (J2000) | Error | Note | Reference |
|---|---|---|---|---|
| 1 |
+47°38'38.5" | 1.8" | XRT-final | UKSSDC |
| 1 |
+47°38'38.6" | 1.9" | XRT-enhanced | Osborne et al. GCN Circ. 26117 |
| 1 |
+47°38'40.9" | 1.4' | BAT-refined | Sakamoto et al. GCN Circ. 26133 |
| Band | Authors | GCN Circ. | Subject | Observatory | Notes |
|---|---|---|---|---|---|
| Optical | Butler et al. | 26121 | RATIR Optical and NIR Observations | RATIR | upper limits |
| Optical | Watson et al. | 26122 | COATLI Optical Observations | COATLI | |
| Optical | Ogawa et al. | 26125 | MITSuME Akeno optical upper limits | MITSuME Akeno | upper limits |
| Optical | Paterson et al. | 26134 | MMT Binospec Optical Upper Limit | MMT | upper limits |
| Optical | Dichiara and Troja | 26147 | Gemini optical upper limit | Gemini | upper limits |
| Radio | Laskar et al. | 26120 | VLA 9.8 GHz upper limit | VLA | upper limits |
| X-ray | Escorial et al. | 26175 | Chandra upper limit | Chandra | upper limits |
| X-ray | D'Avanzo et al. | 26841 | XMM-Newton upper limit | XMM | upper limits |
| Gamma-ray | Mailyan and Meegan | 26118 | Fermi GBM detection | Fermi GBM | Fluence=4.36±0.09x1 (97 percentile for short GRBs) |
| Gamma-ray | Ursi et al. | 26123 | AGILE/MCAL observations | AGILE | |
| Gamma-ray | Frederiks et al. | 26126 | Konus-Wind observation | Konus-Wind | Duration=~0.35 seconds Fluence=2.72(-0.27,+0.31)x1 |
| Gamma-ray | Gaikwad et al. | 26129 | AstroSat CZTI detection | CZTI | |
| Gamma-ray | Frederiks | 26149 | Konus-Wind observation of GRB 191031D: correction to GCN Circ. 26126 |
Konus-Wind | Fluence=5.72(-0.63,+0.69)x1 |
| Gamma-ray | Shimizu et al. | 26240 | CALET Gamma-Ray Burst Monitor detection | CALET | |
| Other | Mailyan | 26114 | Correction in name: GRB 191031D (not GRB 191031C) |
| Filter | Exp(s) | Mag | ||
|---|---|---|---|---|
| whit |
93 | 242 | 147 | >20.8 |
| 306 | 555 | 246 | >20.2 | |
| white | 93 | 6694 | 575 | >21.1 |
| v | 636 | 5863 | 294 | >19.9 |
| b | 561 | 6683 | 471 | >20.4 |
| u | 306 | 6477 | 697 | >20.3 |
| w1 | 686 | 6273 | 452 | >19.8 |
| m2 | 661 | 6067 | 294 | >19.6 |
| w2 | 612 | 5658 | 294 | >19.9 |
Table 3. UVOT observations reported by Gropp and D'Elia (GCN Circ. 26128). The start and stop times of the exposures are given in seconds since the BAT trigger. The preliminary 3-σ upper limits are given. No correction has been made for extinction in the Milky Way.
January 22, 2020