S.B. Cenko (GSFC), P.A. Evans (U. Leicester) and A.A. Breeveld (UCL-MSSL) for the Swift team
At 02:34:57 UT, the Swift Burst Alert Telescope (BAT) triggered and located GRB 200303A (trigger=959431) (Cenko et al. GCN Circ. 27297). Swift slewed immediately to the burst. At the time of the trigger, the initial BAT position was 120° from the Sun (8.8 hours West) and 99° from the 53%-illuminated Moon. Table 1 contains the best reported positions from Swift, and the latest XRT position can be viewed at http://www.swift.ac.uk/xrt_positions.
Table 2 is a summary of GCN Circulars about this GRB from observatories other than Swift.
Standard analysis products for this burst are available at https://gcn.gsfc.nasa.gov/swift_gnd_ana.html.
As reported by Palmer et al. (GCN Circ. 27311),
the BAT ground-calculated position is RA, Dec = 212.695, 51.358 deg which is RA(J2000) = 1
The burst entered the BAT field of view around T-100 s during a spacecraft slew.
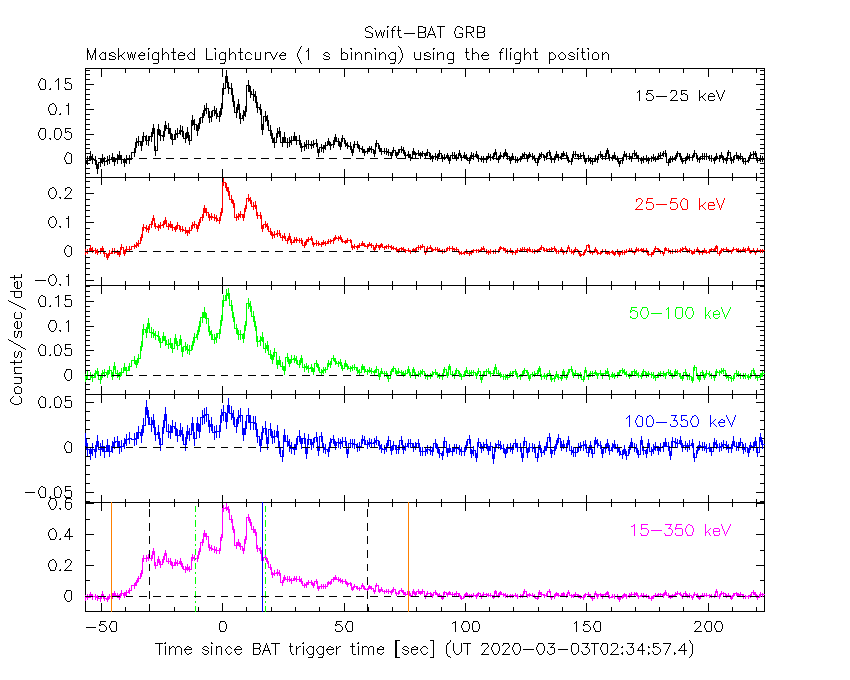
The mask-weighted light curve (Figure 1) shows a single episode with multiple pulses, starting at T-45 s, peaking at the trigger time and returning to near background by T+70 s.
There is extended low-level emission out to nearly T+200 s.
The time-averaged spectrum from T-36.55 to T+193.26 s is best fit by a power law with an exponential cutoff.
This fit gives a photon index 1.39 ± 0.17, and
The results of the batgrbproduct analysis are available at https://gcn.gsfc.nasa.gov/notices_s/959431/BA/.
Analysis of the initial XRT data was reported by Evans et al. (GCN Circ. 27312). We have analysed 11 ks of XRT data for GRB 200303A, from 77 s to 73.7 ks after the BAT trigger. The data comprise 595 s in Windowed Timing (WT) mode (the first 9 s were taken while Swift was slewing) with the remainder in Photon Counting (PC) mode. The enhanced XRT position for this burst was given by Goad et al. (GCN Circ. 27300).
The late-time light curve (Figure 2) (from T0+4.8 ks) can be modelled with a power-law decay with a decay index of α=1.36 ± 0.07.
A spectrum formed from the WT mode data can be fitted with an absorbed power-law with a photon spectral index of 2.41 ± 0.05. The best-fitting absorption column is 1.10 (+0.05, -0.04) x 1
A summary of the PC-mode spectrum is thus:
Total column: 7.5 (+1.0, -0.9) x 1
Galactic foreground: 1.6 x 1
Excess significance: 13.4 σ
Photon index: 2.38 (+0.15, -0.14)
The results of the XRT team automatic analysis are available at http://www.swift.ac.uk/xrt_products/00959431.
The Swift/UVOT began settled observations of the field of GRB 200303A 96 s after the BAT trigger
(Breeveld and Cenko GCN Circ. 27308).
No optical afterglow consistent with the XRT position (Goad et al. GCN Circ. 27300) is detected in the initial UVOT exposures.
Table 3 gives preliminary
magnitudes using the UVOT photometric system
(Breeveld et al. 2011, AIP Conf. Proc., 1358, 373).
No correction has been made for the expected extinction in the Milky Way
corresponding to a reddening of
Figure 1. The BAT
mask-weighted light curve in the four individual and total
energy bands. The units are counts
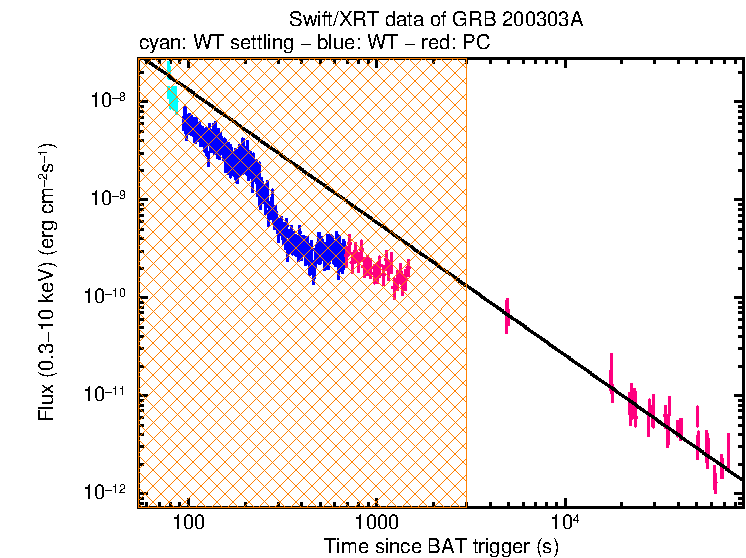
Figure 2. The XRT light curve.
Any data from a crosshatched region are not included in the fit.
| RA (J2000) | Dec (J2000) | Error | Note | Reference |
|---|---|---|---|---|
| 1 |
+51°21'33.5" | 1.4" | XRT-final | UKSSDC |
| 1 |
+51°21'33.5" | 1.7" | XRT-enhanced | Goad et al. GCN Circ. 27300 |
| 1 |
+51°21'29.3" | 1.0' | BAT-refined | Palmer et al. GCN Circ. 27311 |
| Band | Authors | GCN Circ. | Subject | Observatory | Notes |
|---|---|---|---|---|---|
| Optical | Lipunov et al. | 27296 | Swift GRB200303.11: Global MASTER-Net observations report |
MASTER | |
| Optical | de Ugarte Postigo et al. | 27303 | Optical limit from CAHA | CAHA | upper limits |
| Optical | Mong et al. | 27304 | GOTO observations upper limit | Gravitational-wave Optical Transient Observer | upper limits |
| Optical | Jelinek et al. | 27307 | FRAM-ORM optical limit | FRAM | upper limits |
| Optical | Xu et al. | 27309 | NOT optical observations | NOT | |
| Gamma-ray | Fermi | 27294 | Fermi GBM Final Real-time Localization | Fermi GBM | |
| Gamma-ray | Asaoka et al. | 27301 | CALET Gamma-Ray Burst Monitor detection | CALET | |
| Gamma-ray | Malacaria and Meegan | 27314 | Fermi GBM observation | Fermi GBM | Fluence=3.23±0.08x1 (9 |
| Gamma-ray | Tsvetkova et al. | 27316 | Konus-Wind observation | Konus-Wind | Fluence=3.88(-1.20,+0.80)x1 |
| Filter | Exp(s) | Mag | ||
|---|---|---|---|---|
| whit |
96 | 246 | 147 | >20.7 |
| 308 | 558 | 246 | >20.4 | |
| white | 96 | 5034 | 550 | >21.5 |
| v | 1219 | 1238 | 19 | >18.4 |
| b | 1144 | 1163 | 19 | >19.4 |
| u | 308 | 558 | 246 | >20.4 |
Table 3. UVOT observations reported by Breeveld and Cenko (GCN Circ. 27308). The start and stop times of the exposures are given in seconds since the BAT trigger. The preliminary 3-σ upper limits are given. No correction has been made for extinction in the Milky Way.
March 5, 2020