
Swift/BAT Hard X-ray Transient Monitor
Please Read Before Using These Results:README
Main page New! Red text indicates that the source has been detected in the BAT transient monitor.
Sources are considered detected under the following circumstances:
Data current through 11:12 UT, April 26 (DOY 117), 2024
Swift/BAT Transient Sources (Possible Flare Stars)
| Source Name | RA J2000 Degs | Dec J2000 Degs | Alternate Name | Source Type | Today# | Yesterday# | Tenday# | Mean* | Peak* | Days* | Last Day* | |
|---|---|---|---|---|---|---|---|---|---|---|---|---|
| 1 | Zeta And | 11.8346 | 24.2672 | NULL | Beta Lyra binary | - | - | 14 ( 3.1) | 0 | 43 | 3 | 53785 ( 6396) |
| 2 | CF Tuc | 13.2825 | -74.6517 | NULL | RS CVn | - | - | - | 0 | 155 | 6 | 60036 ( 145) |
| 3 | AY Cet | 19.1513 | -2.50028 | NULL | Binary | - | - | - | 0 | - | - | - |
| 4 | UV Psc | 19.2296 | 6.81167 | NULL | Beta Lyra binary | - | - | - | 0 | - | - | - |
| 5 | HD 8357 | 20.7367 | 7.41917 | 1H 0123+075 | X-ray binary | - | - | - | 0 | 63 | 3 | 53784 ( 6397) |
| 6 | UV Cet | 24.7563 | -17.9506 | NULL | Flare star | - | - | - | 0 | 0 | 3 | 1 ( 0) |
| 7 | CC Eri | 38.5940 | -43.7960 | NULL | BY Dra variable | - | - | - | 0 | 0 | 1 | 1 ( 0) |
| 8 | VY Ari | 42.1821 | 31.1153 | NULL | RS CVn variable | - | - | - | 0 | 0 | 4 | 1 ( 0) |
| 9 | RZ Cas | 42.2313 | 69.6342 | NULL | Algol type binary | - | - | - | 0 | - | - | - |
| 10 | Algol | 47.0421 | 40.9556 | bet Per | Algol type binary | - | - | - | 0 | 0 | 7 | 1 ( 0) |
| 11 | LX Per | 48.3433 | 48.1086 | HD 21242 | RS CVn variable | - | - | 8 ( 2.5) | 0 | 76 | 3 | 59825 ( 356) |
| 12 | UX Ari | 51.6475 | 28.7150 | NULL | RS CVn | - | - | - | 0 | 47 | 8 | 56853 ( 3328) |
| 13 | HR 1099 | 54.1971 | 0.587778 | V711 Tau | RS CVn variable | - | - | - | 0 | 0 | 2 | 1 ( 0) |
| 14 | HD 22403 | 54.2958 | 25.9911 | V837 Tau | BY Dra variable | - | - | - | 0 | - | - | - |
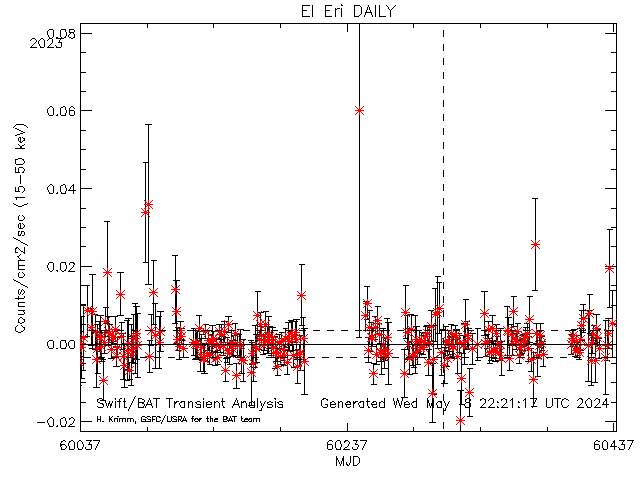
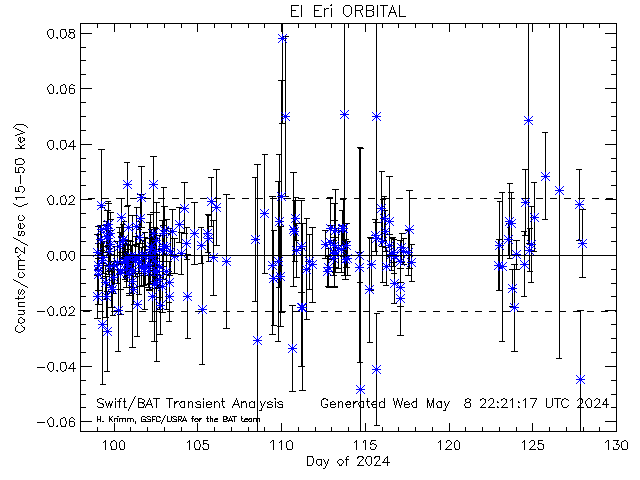
| 15 | EI Eri | 62.4204 | -7.89278 | NULL | RS CVn variable | - | - | - | 0 | 0 | 1 | 1 ( 0) |
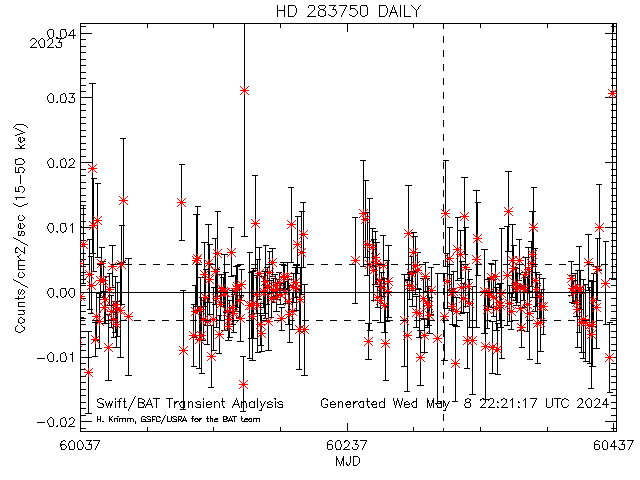
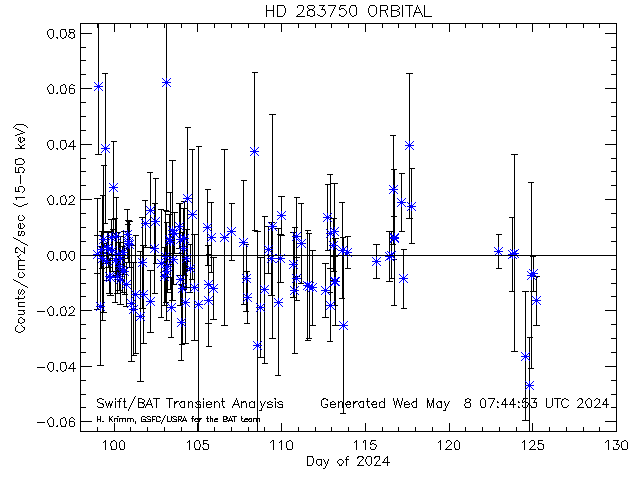
| 16 | HD 283750 | 69.2008 | 27.1322 | V833 Tau | BY Dra variable | - | - | - | 0 | 0 | 1 | 1 ( 0) |
| 17 | GJ 3305 | 69.4062 | -2.49111 | 2MASS J04373746-0229282 | T Tauri star | - | - | - | 0 | 0 | 2 | 1 ( 0) |
| 18 | YY Men | 74.5746 | -75.2772 | NULL | Variable star | - | 21 ( 2.0) | - | 0 | - | - | - |
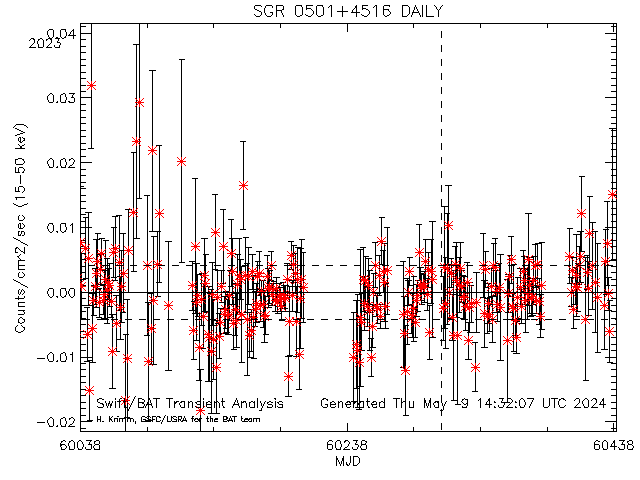
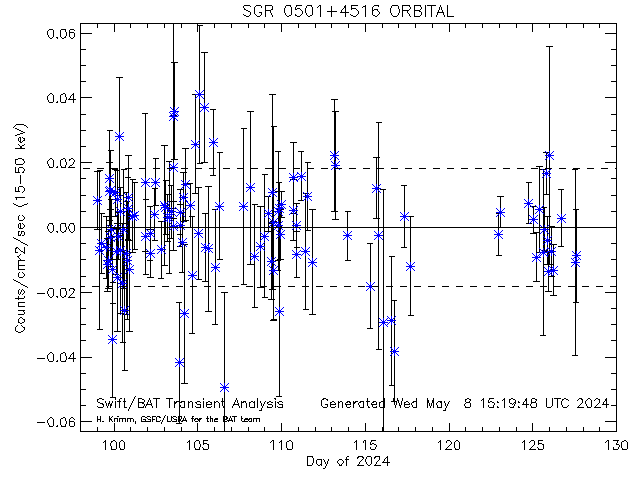
| 19 | SGR 0501+4516 | 75.2780 | 45.2762 | 1RXS J050107.9+451631 | SGR | - | - | - | 0 | 32 | 2 | 53784 ( 6397) |
| 20 | AB Dor | 82.1867 | -65.4486 | NULL | Variable star | - | - | - | 0 | 0 | 1 | 1 ( 0) |
| 21 | YY Gem | 113.656 | 31.8694 | NULL | BY Dra variable | - | - | - | 0 | 0 | 3 | 1 ( 0) |
| 22 | Sigma Gem | 115.828 | 28.8836 | NULL | RS CVn variable | - | - | 15 ( 2.2) | 0 | - | - | - |
| 23 | YZ CMi | 116.167 | 3.55200 | NULL | Flare star | - | - | - | 0 | - | - | - |
| 24 | TY Pyx | 134.928 | -27.8164 | NULL | RS CVn variable | - | - | - | 0 | 0 | 3 | 1 ( 0) |
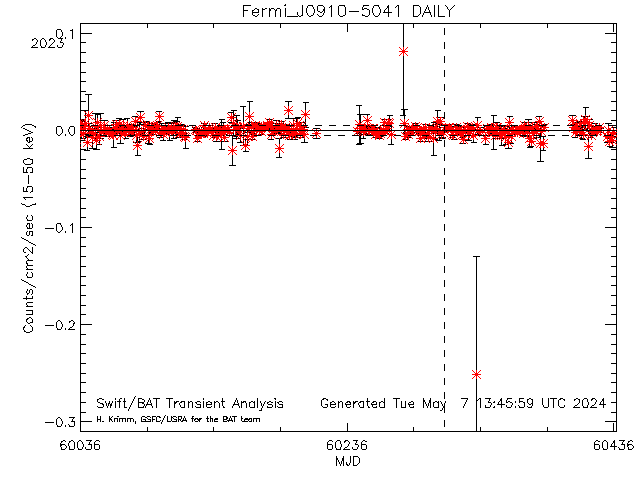
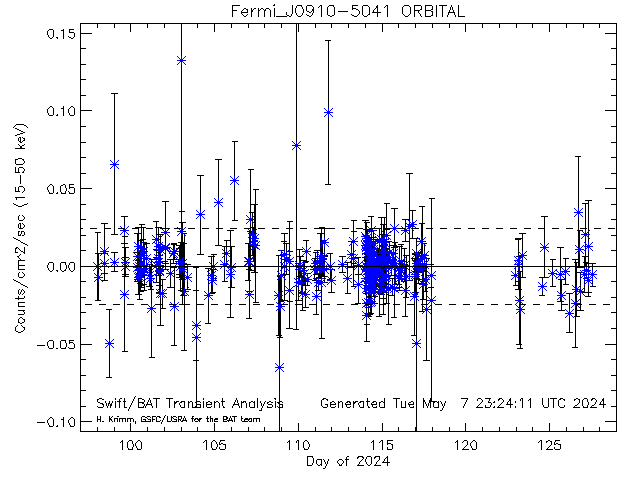
| 25 | Fermi_J0910-5041 | 137.690 | -50.7400 | NULL | Gamma-ray source | - | - | 14 ( 3.9) | 0 | - | - | - |
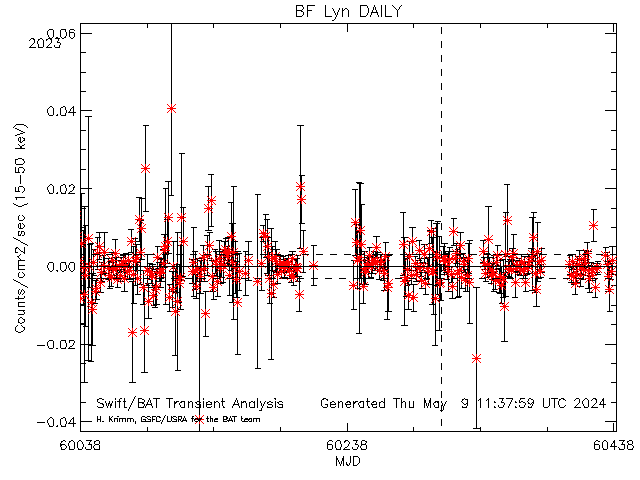
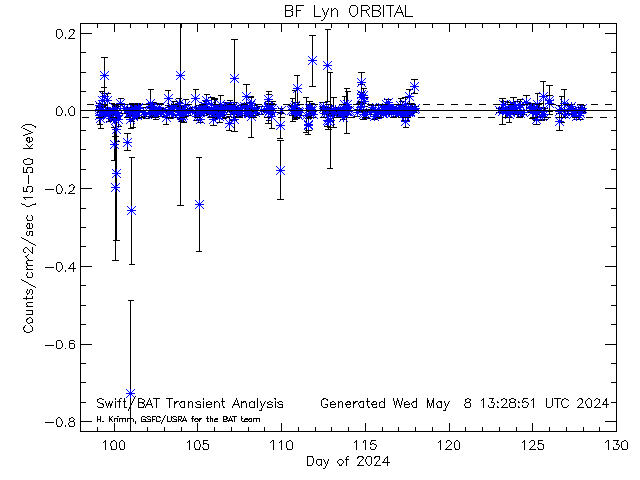
| 26 | BF Lyn | 140.608 | 40.2011 | NULL | BY Dra variable | - | 39 ( 4.0) | 18 ( 2.7) | 0 | 0 | 2 | 1 ( 0) |
| 27 | LQ Hya | 143.107 | -11.1847 | NULL | BY Dra variable | - | 127 ( 2.5) | - | 0 | 0 | 1 | 1 ( 0) |
| 28 | DH Leo | 150.007 | 24.5528 | HD 86590 | Multiple star | - | - | - | 0 | 0 | 1 | 1 ( 0) |
| 29 | AD Leo | 154.901 | 19.8700 | NULL | Flare star | - | - | - | 0 | 0 | 1 | 1 ( 0) |
| 30 | DM UMa | 163.931 | 60.4694 | NULL | RS CVn variable | - | - | - | 0 | 0 | 2 | 1 ( 0) |
| 31 | HD 101379 | 174.875 | -65.3978 | NULL | Double star | - | - | - | 0 | 0 | 7 | 1 ( 0) |
| 32 | RW UMa | 175.193 | 51.9981 | NULL | RS CVn variable | - | - | - | 0 | - | - | - |
| 33 | DK Dra | 183.923 | 72.5511 | NULL | RS CVn variable | - | - | - | 0 | - | - | - |
| 34 | RS CVn | 197.654 | 35.9350 | HD 114519 | Double star | - | - | - | 0 | 0 | 1 | 1 ( 0) |
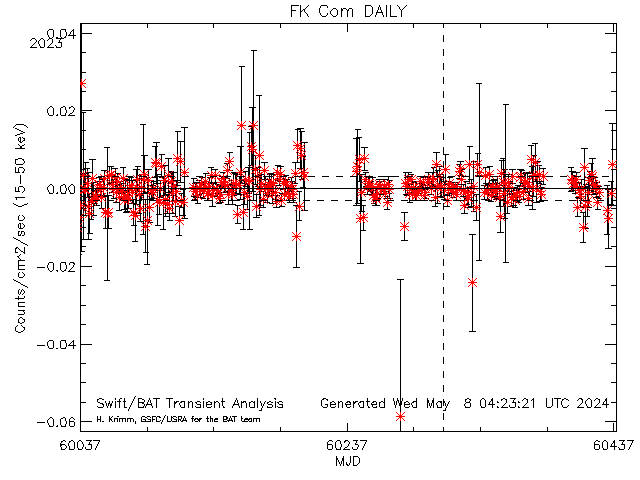
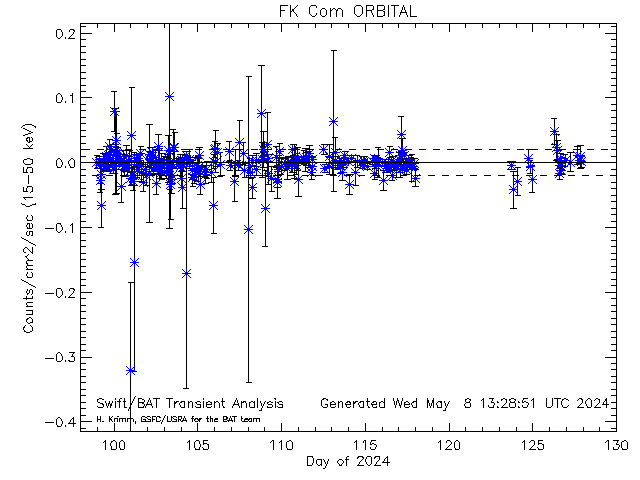
| 35 | FK Com | 202.695 | 24.2328 | NULL | Variable star | - | - | - | 0 | 0 | 1 | 1 ( 0) |
| 36 | HR 5110 | 203.699 | 37.1825 | BH CVn | RS CVn | - | - | - | 0 | - | - | - |
| 37 | Prox Cen | 217.429 | -62.6794 | V645 Cen | Flare star | - | - | - | 0 | - | - | - |
| 38 | EK Dra | 219.751 | 64.2917 | NULL | BY Dra variable | - | - | - | 0 | - | - | - |
| 39 | 44 Boo | 225.947 | 47.6542 | CCDM J15038+4739AB | Double star | - | - | - | 0 | 0 | 1 | 1 ( 0) |
| 40 | TZ CrB | 243.670 | 33.8586 | NULL | RS CVn variable | - | - | - | 0 | - | - | - |
| 41 | V824 Ara | 259.356 | -66.9511 | NULL | RS CVn variable | - | - | - | 0 | - | - | - |
| 42 | HD 163621 | 268.853 | 36.1889 | V835 Her | RS CVn variable | - | - | - | 0 | 0 | 2 | 1 ( 0) |
| 43 | V772 Her | 271.457 | 21.4458 | CCDM J18058+2127A | Double star | - | - | - | 0 | - | - | - |
| 44 | BY Dra | 278.483 | 51.7192 | NULL | BY Dra variable | - | - | 6 ( 2.1) | 0 | - | - | - |
| 45 | HR 7275 | 287.108 | 52.4258 | V1762 Cyg | RS CVn variable | - | - | - | 0 | 0 | 1 | 1 ( 0) |
| 46 | VW Cep | 309.340 | 75.6003 | HD 197433 | Double star | - | - | - | 0 | 0 | 1 | 1 ( 0) |
| 47 | AT Mic | 310.463 | -32.4353 | NULL | Flare star | - | - | - | 0 | - | - | - |
| 48 | AU Mic | 311.290 | -31.3408 | NULL | Flare star | - | - | - | 0 | 0 | 4 | 1 ( 0) |
| 49 | BO Mic | 311.937 | -36.5942 | NULL | BY Dra variable | - | - | - | 0 | - | - | - |
| 50 | V1794 Cyg | 313.473 | 44.3864 | NULL | Variable star | - | - | - | 0 | 0 | 1 | 1 ( 0) |
| 51 | ER Vul | 315.608 | 27.8075 | NULL | W UMa binary | - | - | - | 0 | 0 | 5 | 1 ( 0) |
| 52 | HK Lac | 331.236 | 47.2344 | NULL | RS CVn variable | - | - | - | 0 | - | - | - |
| 53 | AR Lac | 332.170 | 45.7422 | NULL | RS CVn variable | - | - | - | 0 | 85 | 2 | 58192 ( 1989) |
| 54 | EV Lac | 341.707 | 44.3339 | NULL | Flare star | - | - | - | 0 | - | - | - |
| 55 | IM Peg | 343.260 | 16.8411 | NULL | RS CVn variable | - | - | 12 ( 2.5) | 0 | - | - | - |
| 56 | KZ And | 347.489 | 47.9583 | NULL | BY Dra variable | - | - | - | 0 | - | - | - |
| 57 | SZ Psc | 348.349 | 2.67556 | NULL | RS CVn variable | - | - | - | 0 | 70 | 2 | 57037 ( 3144) |
| 58 | V368 Cep | 349.861 | 79.0036 | NULL | RS CVn variable | - | - | - | 0 | 0 | 1 | 1 ( 0) |
| 59 | EQ Peg | 352.967 | 19.9370 | NULL | Flare star | - | - | - | 0 | 0 | 1 | 1 ( 0) |
| 60 | Lambda And | 354.391 | 46.4581 | NULL | RS CVn variable | - | - | 10 ( 3.0) | 0 | - | - | - |
| 61 | HR 9024 | 357.421 | 36.4253 | OU And | Variable star | - | - | - | 0 | 0 | 1 | 1 ( 0) |
| 62 | II Peg | 358.767 | 28.6336 | NULL | RS CVn variable | - | - | 10 ( 2.4) | 0 | 0 | 2 | 1 ( 0) | Source Name | RA J2000 Degs | Dec J2000 Degs | Alternate Name | Source Type | Today# | Yesterday# | Tenday# | Mean* | Peak* | Days* | Last Day* |
* Explanation of last four table headings:
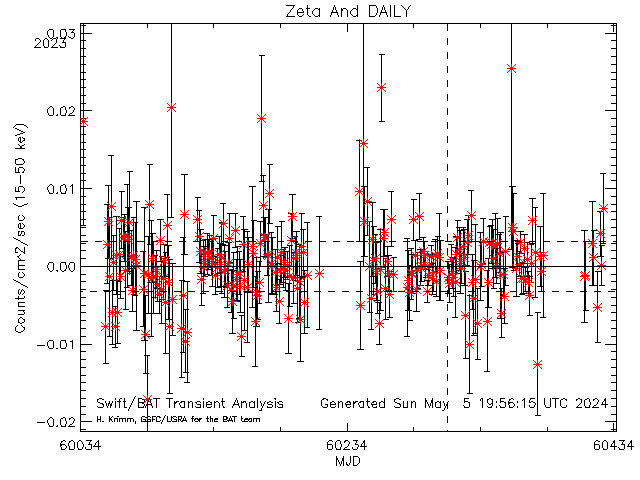
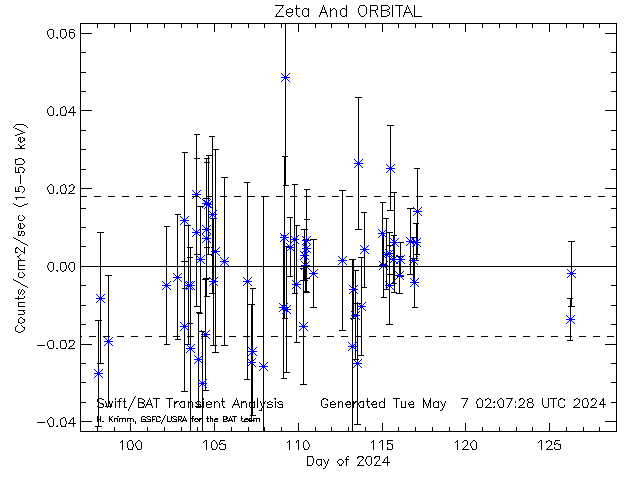
Dashed lines show average rate (and +/- 1 sigma standard deviation) for this source (derived from this plot)
[30150] Zeta And RA= 11.8346 degs; Dec= 24.2672 degs
Daily light curves: FITS version ASCII version
Orbit light curves: FITS version ASCII version
Full mission light curve
-------------------------------------------------------------------------------------------------------------------------------------------------------------------
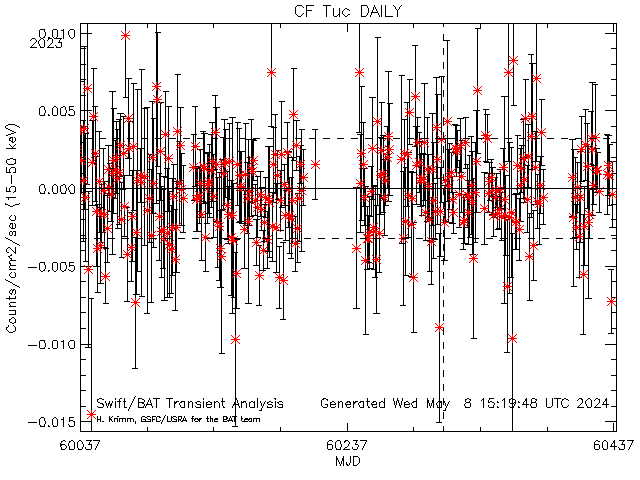
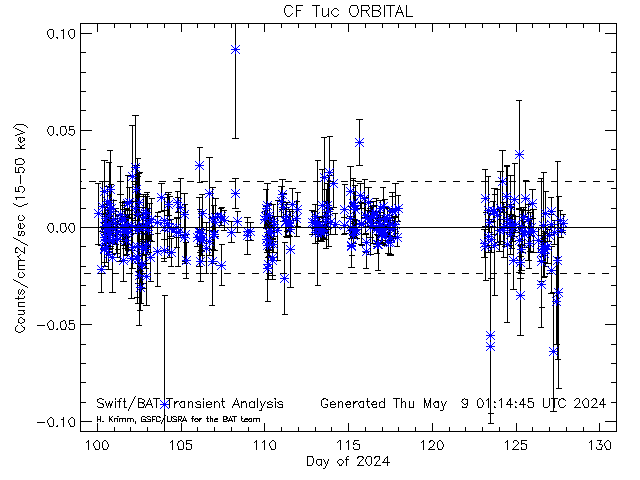
Dashed lines show average rate (and +/- 1 sigma standard deviation) for this source (derived from this plot)
[30151] CF Tuc RA= 13.2825 degs; Dec= -74.6517 degs
Daily light curves: FITS version ASCII version
Orbit light curves: FITS version ASCII version
Full mission light curve
-------------------------------------------------------------------------------------------------------------------------------------------------------------------
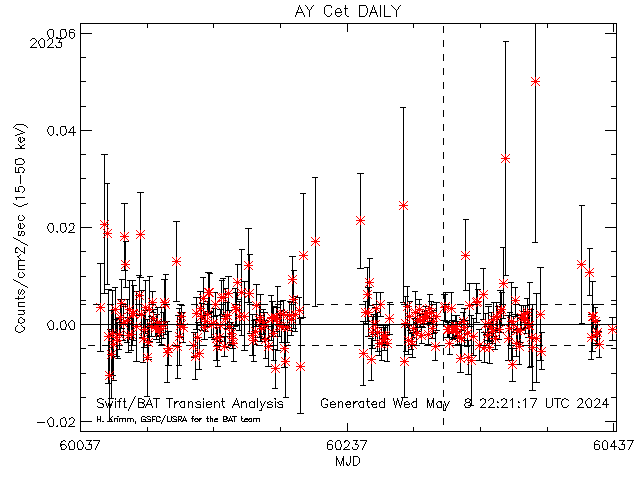
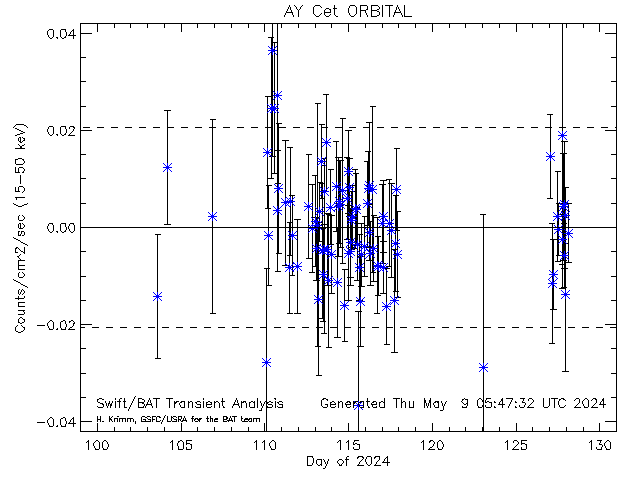
Dashed lines show average rate (and +/- 1 sigma standard deviation) for this source (derived from this plot)
[30152] AY Cet RA= 19.1513 degs; Dec= -2.50028 degs
Daily light curves: FITS version ASCII version
Orbit light curves: FITS version ASCII version
Full mission light curve
-------------------------------------------------------------------------------------------------------------------------------------------------------------------
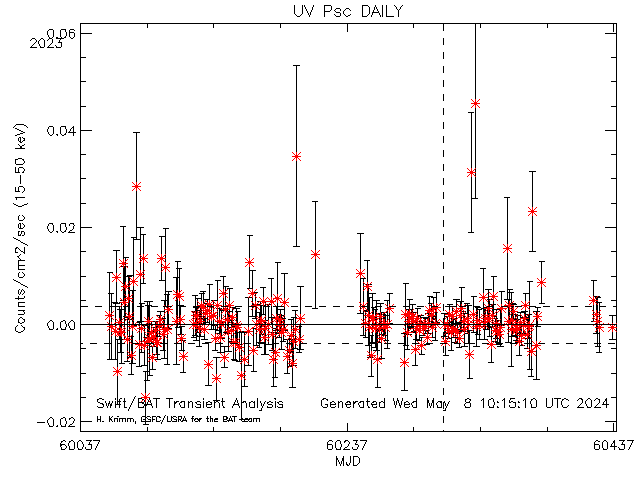
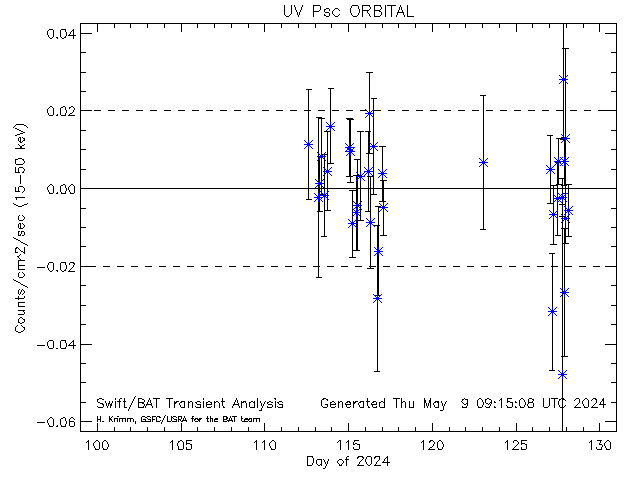
Dashed lines show average rate (and +/- 1 sigma standard deviation) for this source (derived from this plot)
[30153] UV Psc RA= 19.2296 degs; Dec= 6.81167 degs
Daily light curves: FITS version ASCII version
Orbit light curves: FITS version ASCII version
Full mission light curve
-------------------------------------------------------------------------------------------------------------------------------------------------------------------
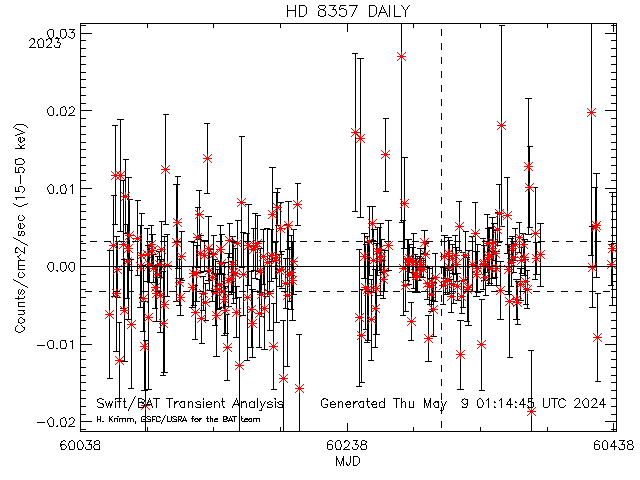
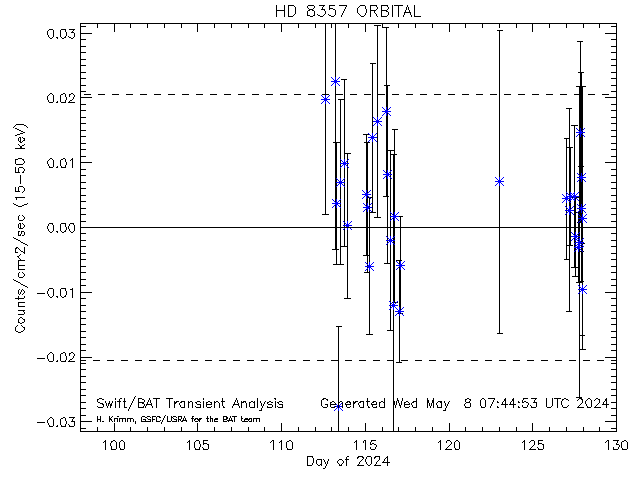
Dashed lines show average rate (and +/- 1 sigma standard deviation) for this source (derived from this plot)
[30154] HD 8357 RA= 20.7367 degs; Dec= 7.41917 degs
Daily light curves: FITS version ASCII version
Orbit light curves: FITS version ASCII version
Full mission light curve
-------------------------------------------------------------------------------------------------------------------------------------------------------------------
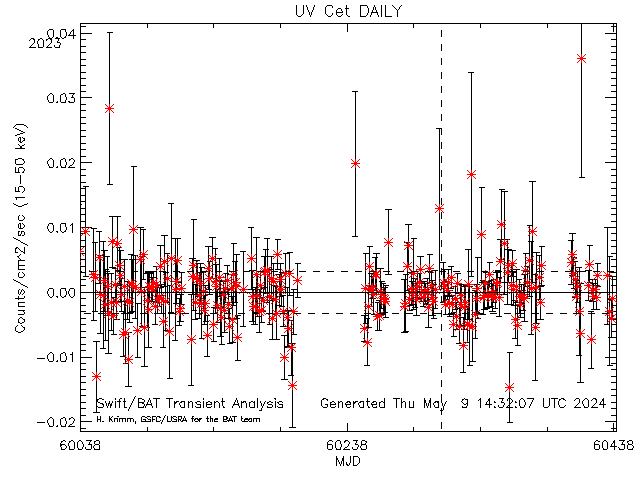
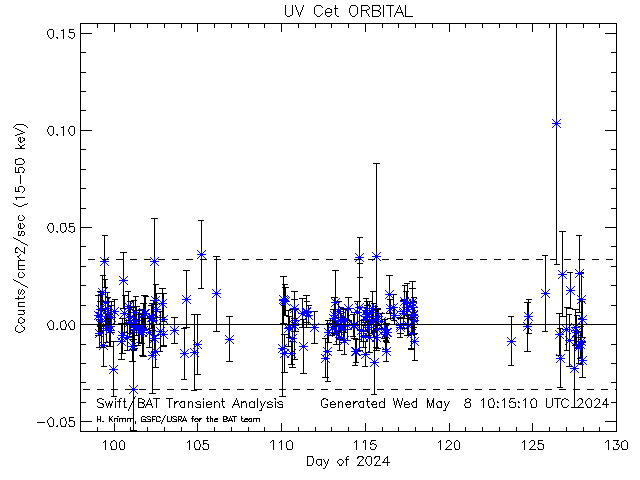
Dashed lines show average rate (and +/- 1 sigma standard deviation) for this source (derived from this plot)
[30155] UV Cet RA= 24.7563 degs; Dec= -17.9506 degs
Daily light curves: FITS version ASCII version
Orbit light curves: FITS version ASCII version
Full mission light curve
-------------------------------------------------------------------------------------------------------------------------------------------------------------------
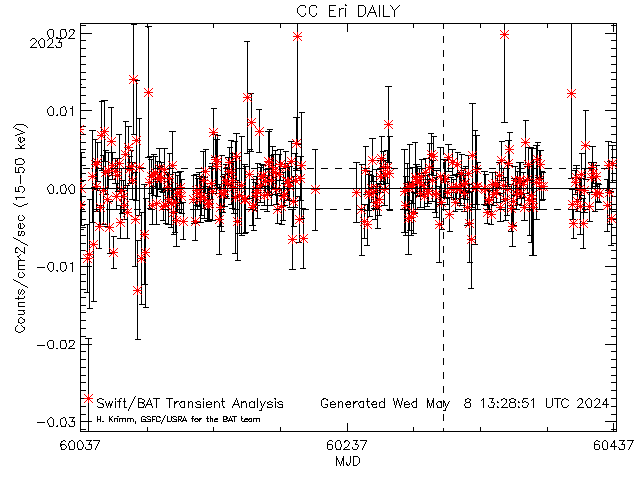
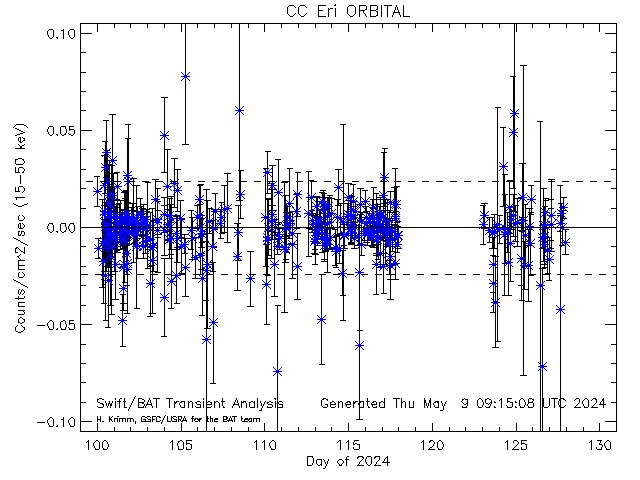
Dashed lines show average rate (and +/- 1 sigma standard deviation) for this source (derived from this plot)
[33710] CC Eri RA= 38.5940 degs; Dec= -43.7960 degs
Daily light curves: FITS version ASCII version
Orbit light curves: FITS version ASCII version
Full mission light curve
-------------------------------------------------------------------------------------------------------------------------------------------------------------------
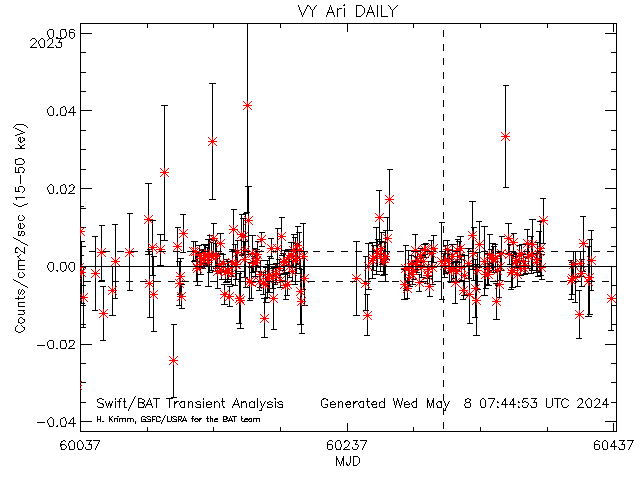
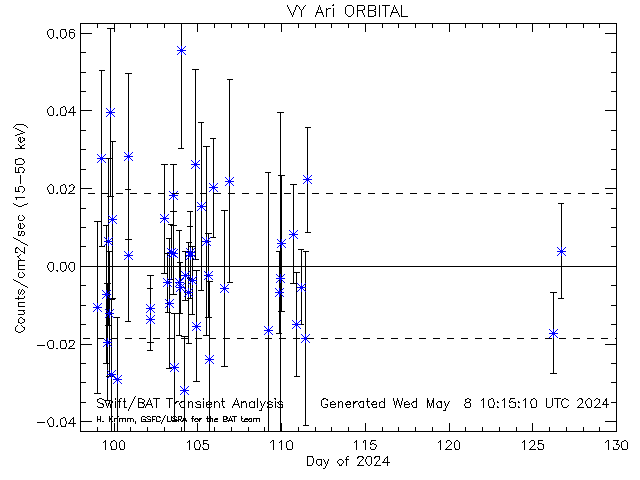
Dashed lines show average rate (and +/- 1 sigma standard deviation) for this source (derived from this plot)
[30156] VY Ari RA= 42.1821 degs; Dec= 31.1153 degs
Daily light curves: FITS version ASCII version
Orbit light curves: FITS version ASCII version
Full mission light curve
-------------------------------------------------------------------------------------------------------------------------------------------------------------------
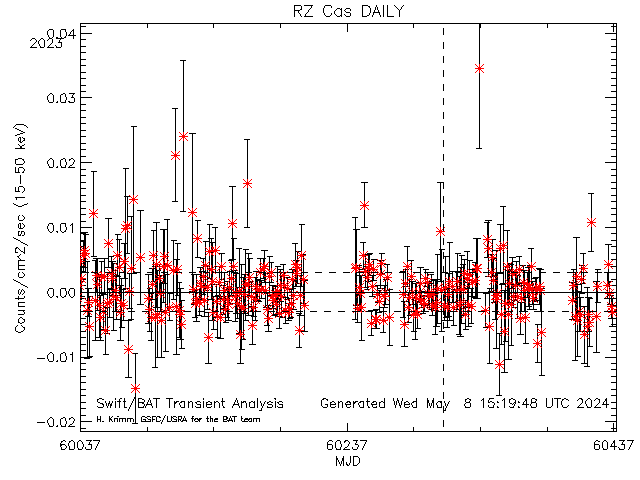
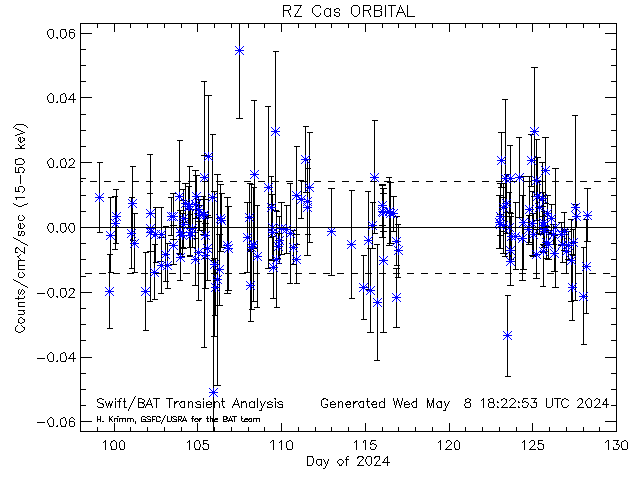
Dashed lines show average rate (and +/- 1 sigma standard deviation) for this source (derived from this plot)
[30157] RZ Cas RA= 42.2313 degs; Dec= 69.6342 degs
Daily light curves: FITS version ASCII version
Orbit light curves: FITS version ASCII version
Full mission light curve
-------------------------------------------------------------------------------------------------------------------------------------------------------------------
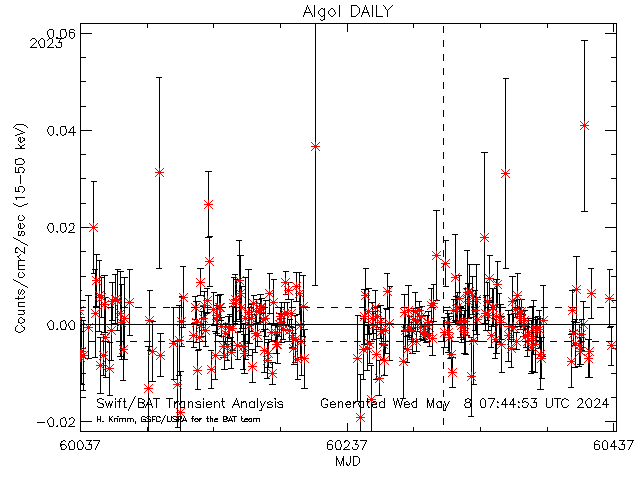
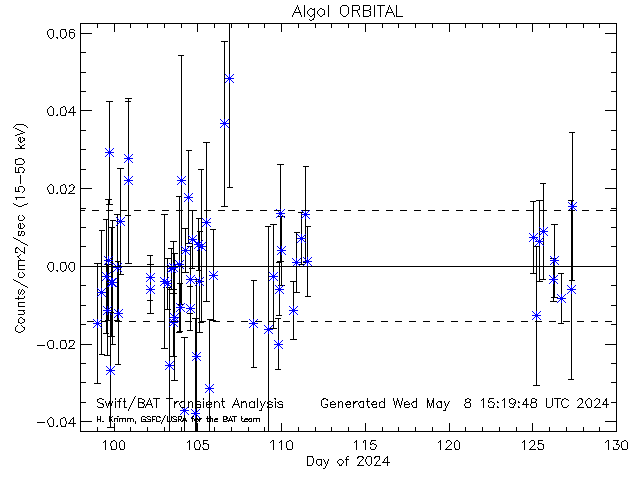
Dashed lines show average rate (and +/- 1 sigma standard deviation) for this source (derived from this plot)
[30158] Algol RA= 47.0421 degs; Dec= 40.9556 degs
Daily light curves: FITS version ASCII version
Orbit light curves: FITS version ASCII version
Full mission light curve
-------------------------------------------------------------------------------------------------------------------------------------------------------------------
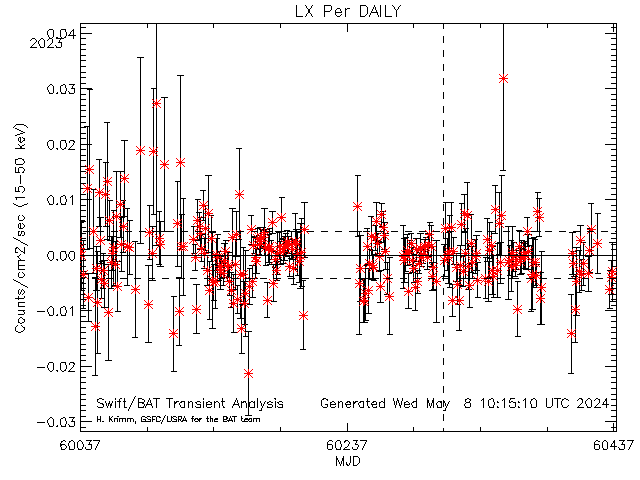
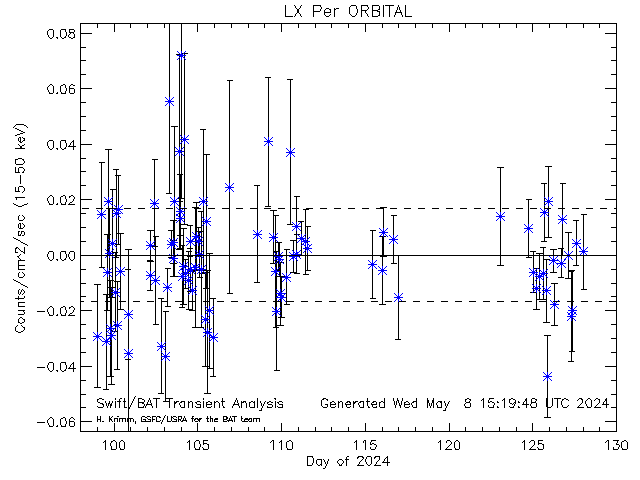
Dashed lines show average rate (and +/- 1 sigma standard deviation) for this source (derived from this plot)
[30159] LX Per RA= 48.3433 degs; Dec= 48.1086 degs
Daily light curves: FITS version ASCII version
Orbit light curves: FITS version ASCII version
Full mission light curve
-------------------------------------------------------------------------------------------------------------------------------------------------------------------
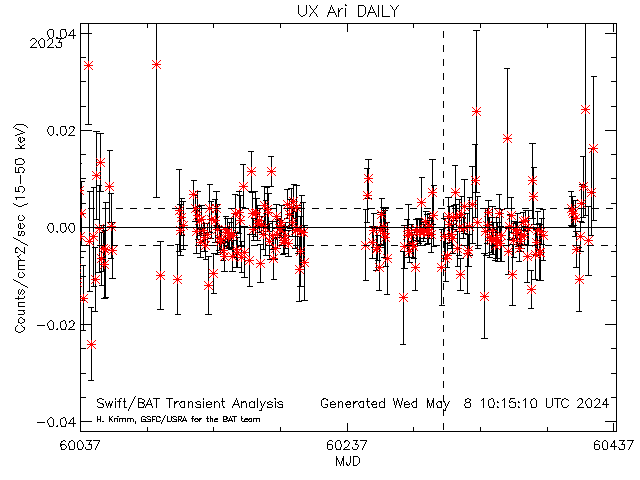
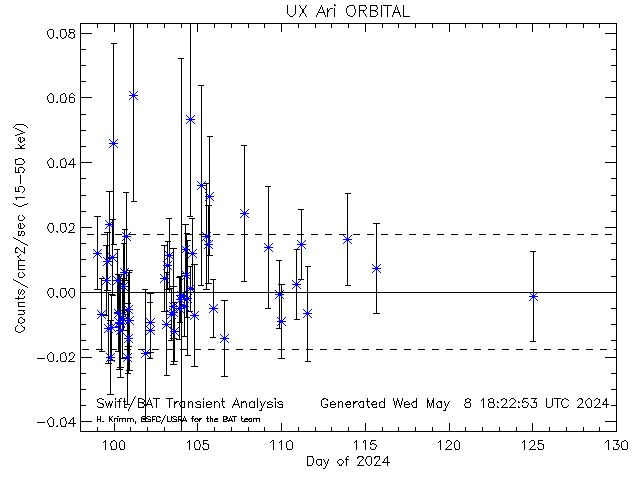
Dashed lines show average rate (and +/- 1 sigma standard deviation) for this source (derived from this plot)
[30160] UX Ari RA= 51.6475 degs; Dec= 28.7150 degs
Daily light curves: FITS version ASCII version
Orbit light curves: FITS version ASCII version
Full mission light curve
-------------------------------------------------------------------------------------------------------------------------------------------------------------------
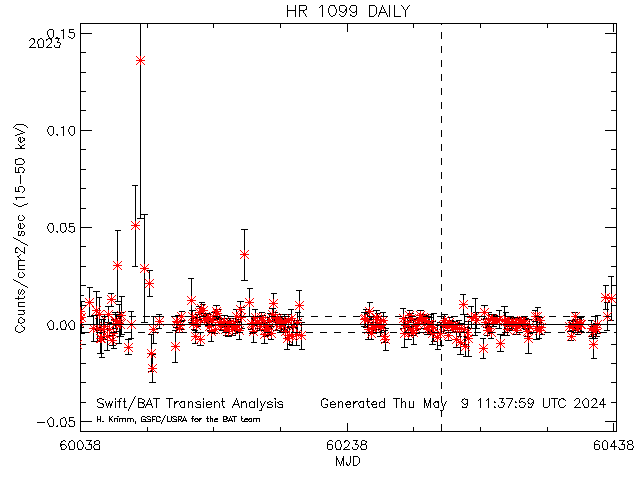
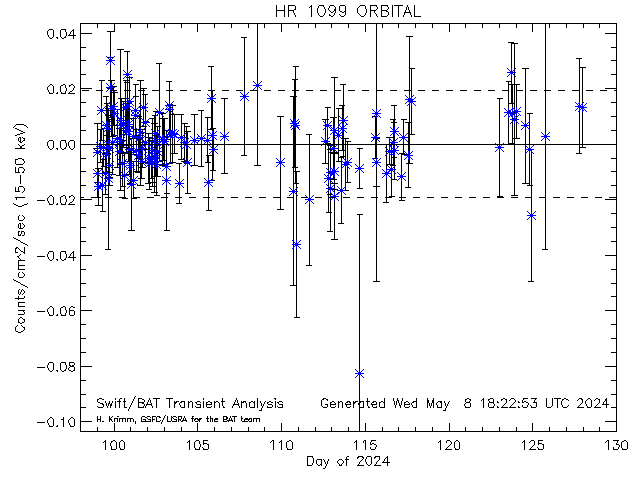
Dashed lines show average rate (and +/- 1 sigma standard deviation) for this source (derived from this plot)
[30161] HR 1099 RA= 54.1971 degs; Dec= 0.587778 degs
Daily light curves: FITS version ASCII version
Orbit light curves: FITS version ASCII version
Full mission light curve
-------------------------------------------------------------------------------------------------------------------------------------------------------------------
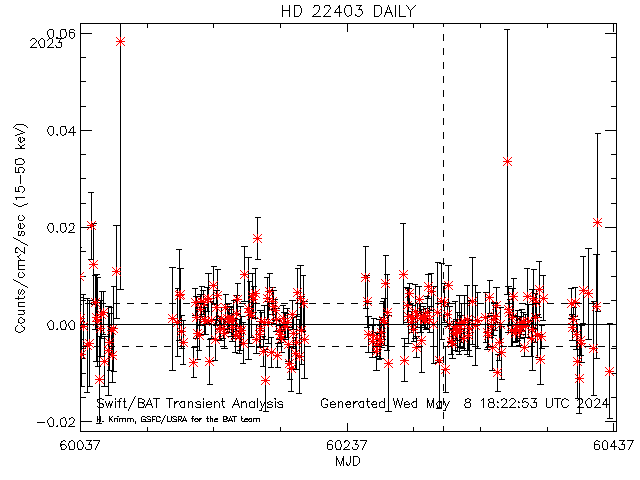
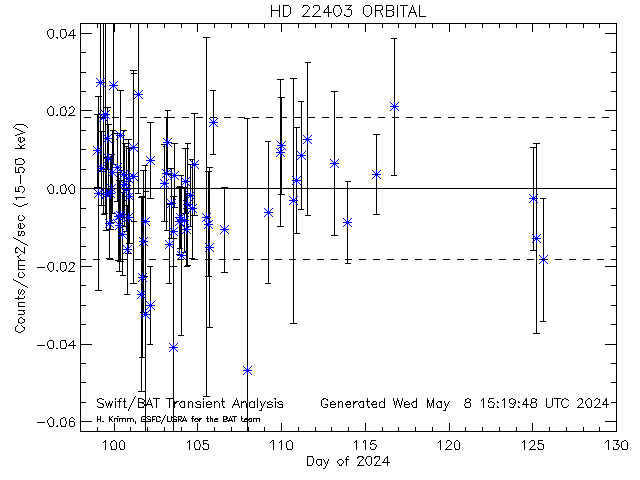
Dashed lines show average rate (and +/- 1 sigma standard deviation) for this source (derived from this plot)
[30162] HD 22403 RA= 54.2958 degs; Dec= 25.9911 degs
Daily light curves: FITS version ASCII version
Orbit light curves: FITS version ASCII version
Full mission light curve
-------------------------------------------------------------------------------------------------------------------------------------------------------------------
Dashed lines show average rate (and +/- 1 sigma standard deviation) for this source (derived from this plot)
[30163] EI Eri RA= 62.4204 degs; Dec= -7.89278 degs
Daily light curves: FITS version ASCII version
Orbit light curves: FITS version ASCII version
Full mission light curve
-------------------------------------------------------------------------------------------------------------------------------------------------------------------
Dashed lines show average rate (and +/- 1 sigma standard deviation) for this source (derived from this plot)
[30164] HD 283750 RA= 69.2008 degs; Dec= 27.1322 degs
Daily light curves: FITS version ASCII version
Orbit light curves: FITS version ASCII version
Full mission light curve
-------------------------------------------------------------------------------------------------------------------------------------------------------------------
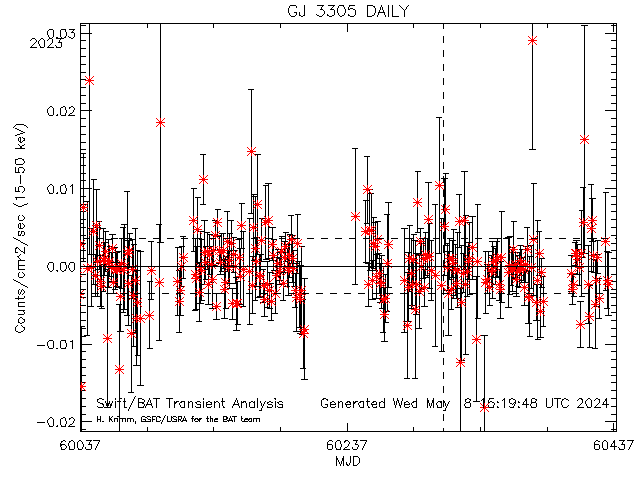
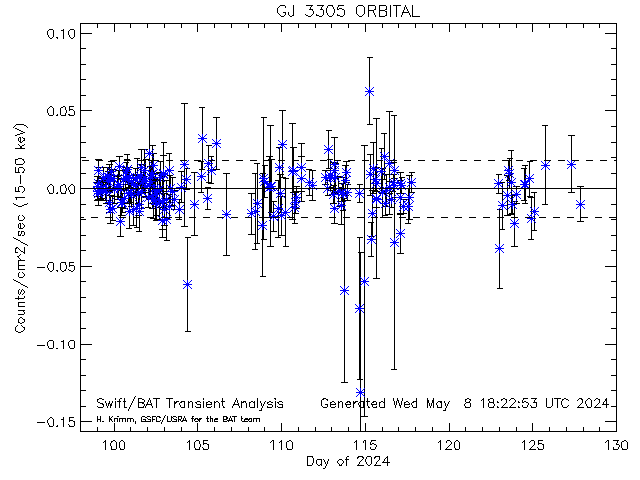
Dashed lines show average rate (and +/- 1 sigma standard deviation) for this source (derived from this plot)
[30165] GJ 3305 RA= 69.4062 degs; Dec= -2.49111 degs
Daily light curves: FITS version ASCII version
Orbit light curves: FITS version ASCII version
Full mission light curve
-------------------------------------------------------------------------------------------------------------------------------------------------------------------
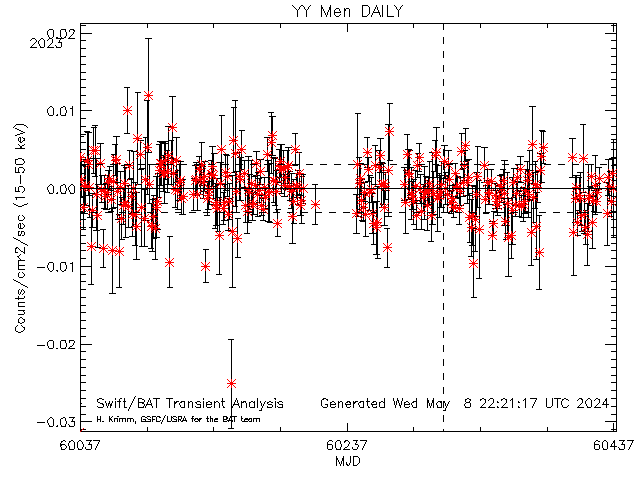
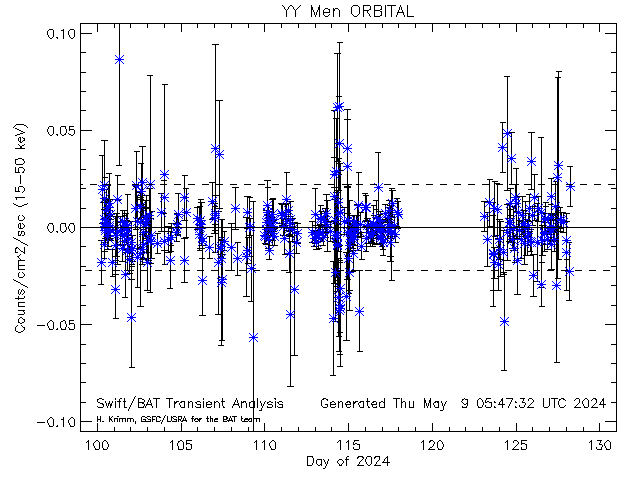
Dashed lines show average rate (and +/- 1 sigma standard deviation) for this source (derived from this plot)
[30166] YY Men RA= 74.5746 degs; Dec= -75.2772 degs
Daily light curves: FITS version ASCII version
Orbit light curves: FITS version ASCII version
Full mission light curve
-------------------------------------------------------------------------------------------------------------------------------------------------------------------
Dashed lines show average rate (and +/- 1 sigma standard deviation) for this source (derived from this plot)
[33689] SGR 0501+4516 RA= 75.2780 degs; Dec= 45.2762 degs
Daily light curves: FITS version ASCII version
Orbit light curves: FITS version ASCII version
Full mission light curve
-------------------------------------------------------------------------------------------------------------------------------------------------------------------
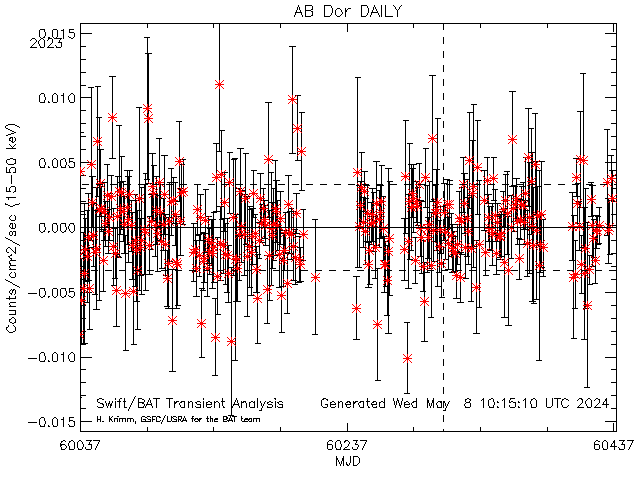
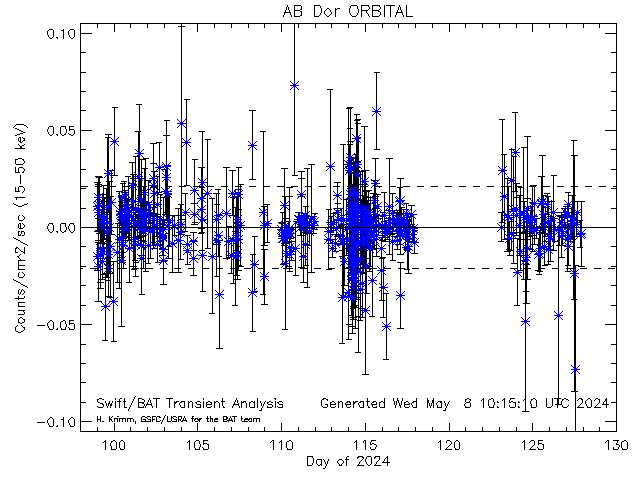
Dashed lines show average rate (and +/- 1 sigma standard deviation) for this source (derived from this plot)
[30167] AB Dor RA= 82.1867 degs; Dec= -65.4486 degs
Daily light curves: FITS version ASCII version
Orbit light curves: FITS version ASCII version
Full mission light curve
-------------------------------------------------------------------------------------------------------------------------------------------------------------------
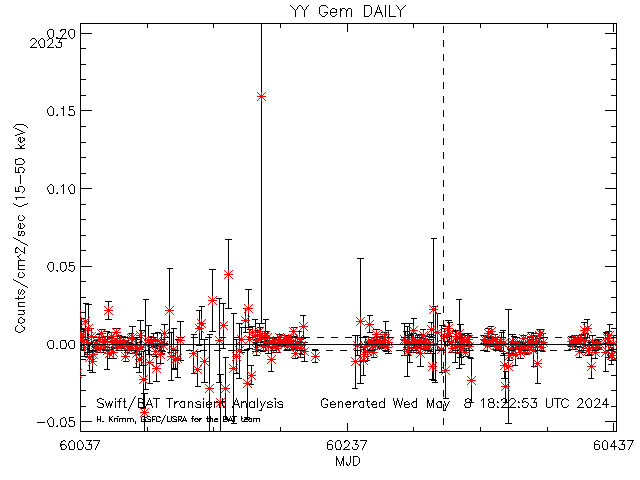
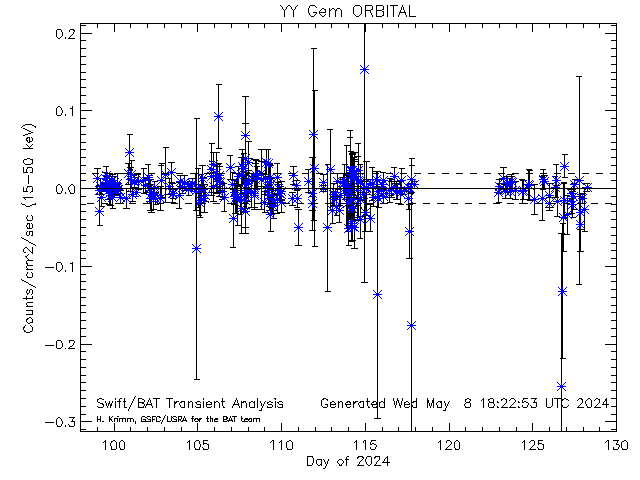
Dashed lines show average rate (and +/- 1 sigma standard deviation) for this source (derived from this plot)
[30168] YY Gem RA= 113.656 degs; Dec= 31.8694 degs
Daily light curves: FITS version ASCII version
Orbit light curves: FITS version ASCII version
Full mission light curve
-------------------------------------------------------------------------------------------------------------------------------------------------------------------
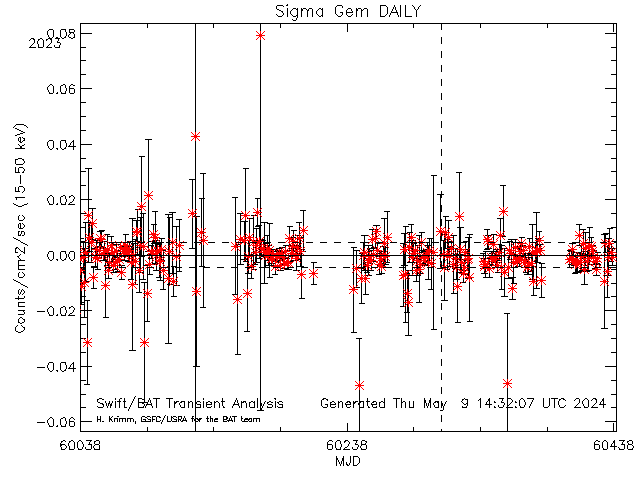
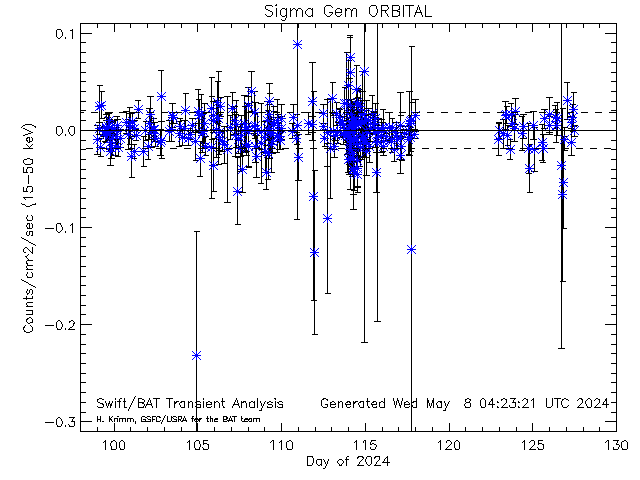
Dashed lines show average rate (and +/- 1 sigma standard deviation) for this source (derived from this plot)
[30169] Sigma Gem RA= 115.828 degs; Dec= 28.8836 degs
Daily light curves: FITS version ASCII version
Orbit light curves: FITS version ASCII version
Full mission light curve
-------------------------------------------------------------------------------------------------------------------------------------------------------------------
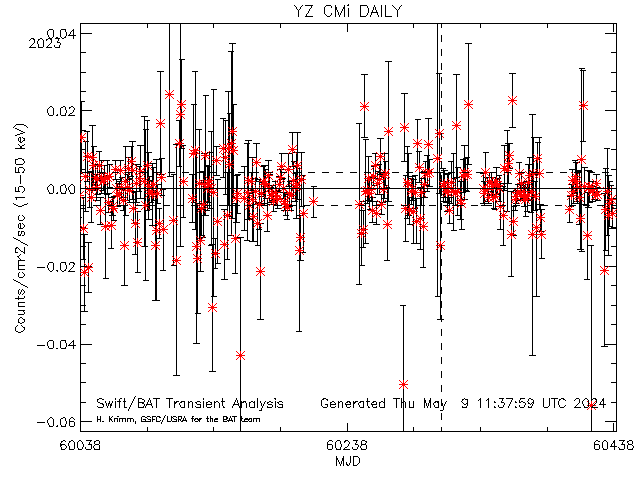
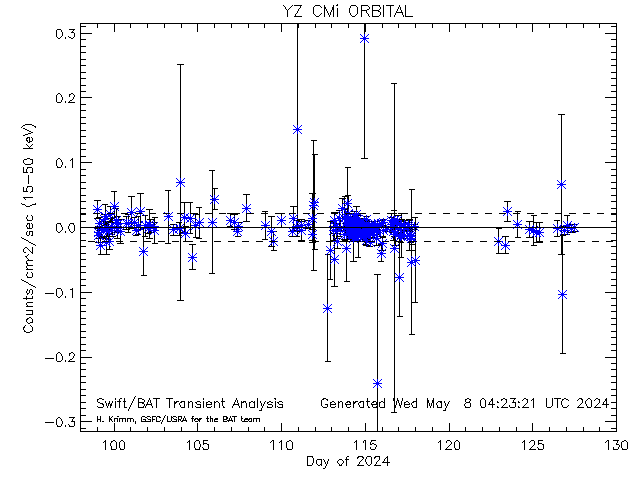
Dashed lines show average rate (and +/- 1 sigma standard deviation) for this source (derived from this plot)
[33721] YZ CMi RA= 116.167 degs; Dec= 3.55200 degs
Daily light curves: FITS version ASCII version
Orbit light curves: FITS version ASCII version
Full mission light curve
-------------------------------------------------------------------------------------------------------------------------------------------------------------------
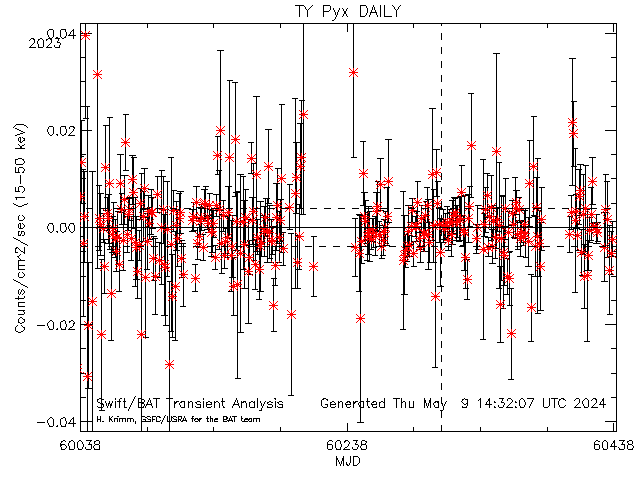
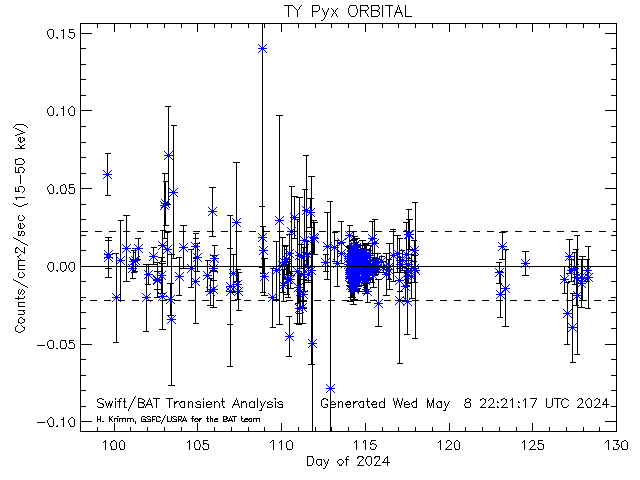
Dashed lines show average rate (and +/- 1 sigma standard deviation) for this source (derived from this plot)
[30170] TY Pyx RA= 134.928 degs; Dec= -27.8164 degs
Daily light curves: FITS version ASCII version
Orbit light curves: FITS version ASCII version
Full mission light curve
-------------------------------------------------------------------------------------------------------------------------------------------------------------------
Dashed lines show average rate (and +/- 1 sigma standard deviation) for this source (derived from this plot)
[33711] Fermi_J0910-5041 RA= 137.690 degs; Dec= -50.7400 degs
Daily light curves: FITS version ASCII version
Orbit light curves: FITS version ASCII version
Full mission light curve
-------------------------------------------------------------------------------------------------------------------------------------------------------------------
Dashed lines show average rate (and +/- 1 sigma standard deviation) for this source (derived from this plot)
[30171] BF Lyn RA= 140.608 degs; Dec= 40.2011 degs
Daily light curves: FITS version ASCII version
Orbit light curves: FITS version ASCII version
Full mission light curve
-------------------------------------------------------------------------------------------------------------------------------------------------------------------
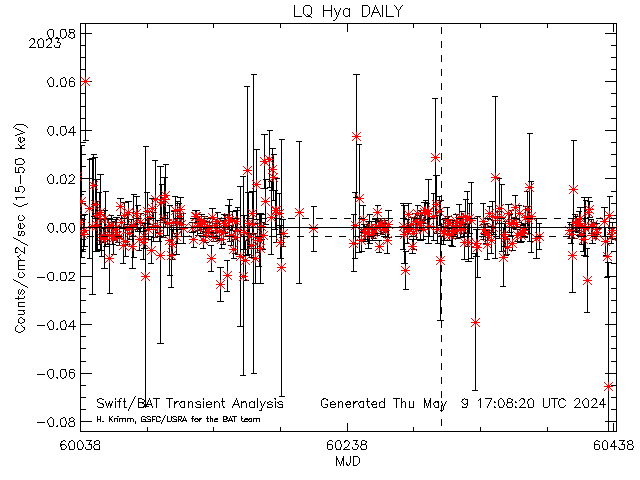
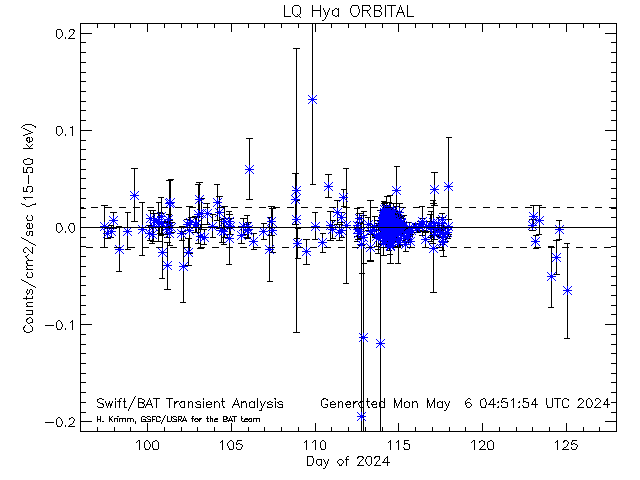
Dashed lines show average rate (and +/- 1 sigma standard deviation) for this source (derived from this plot)
[30172] LQ Hya RA= 143.107 degs; Dec= -11.1847 degs
Daily light curves: FITS version ASCII version
Orbit light curves: FITS version ASCII version
Full mission light curve
-------------------------------------------------------------------------------------------------------------------------------------------------------------------
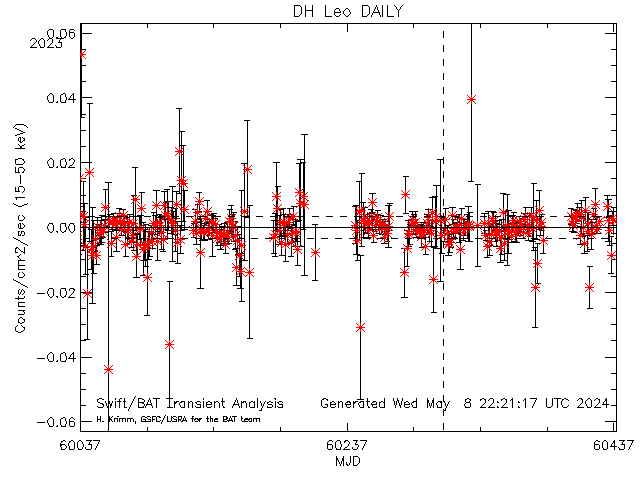
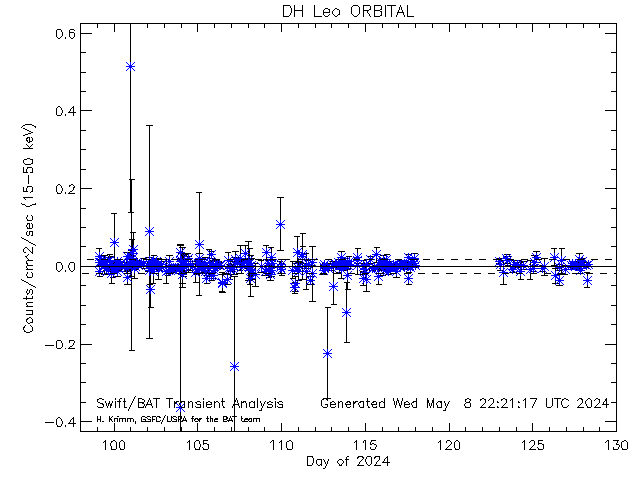
Dashed lines show average rate (and +/- 1 sigma standard deviation) for this source (derived from this plot)
[30173] DH Leo RA= 150.007 degs; Dec= 24.5528 degs
Daily light curves: FITS version ASCII version
Orbit light curves: FITS version ASCII version
Full mission light curve
-------------------------------------------------------------------------------------------------------------------------------------------------------------------
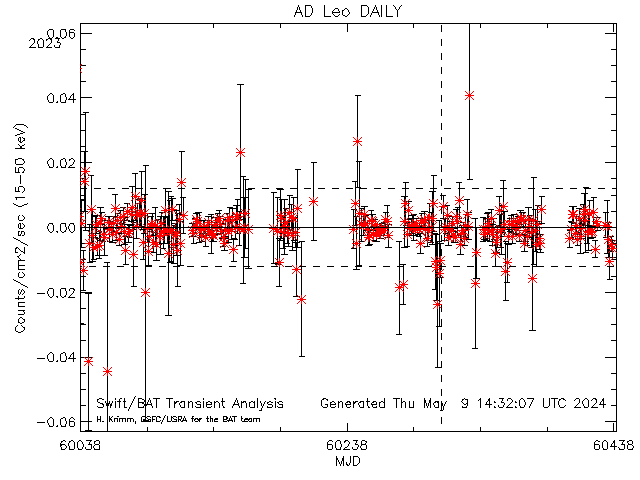
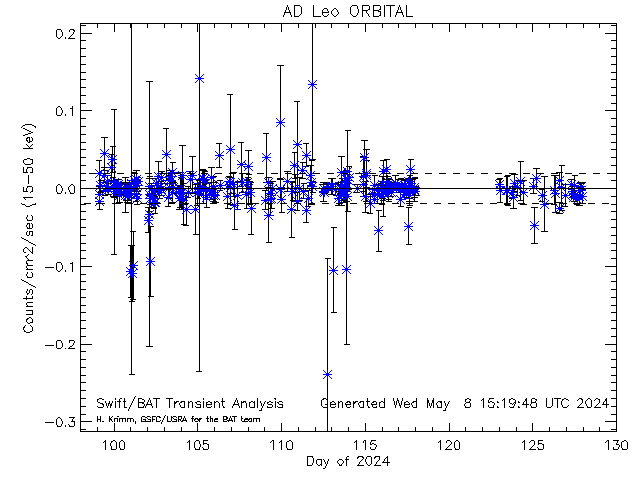
Dashed lines show average rate (and +/- 1 sigma standard deviation) for this source (derived from this plot)
[30174] AD Leo RA= 154.901 degs; Dec= 19.8700 degs
Daily light curves: FITS version ASCII version
Orbit light curves: FITS version ASCII version
Full mission light curve
-------------------------------------------------------------------------------------------------------------------------------------------------------------------
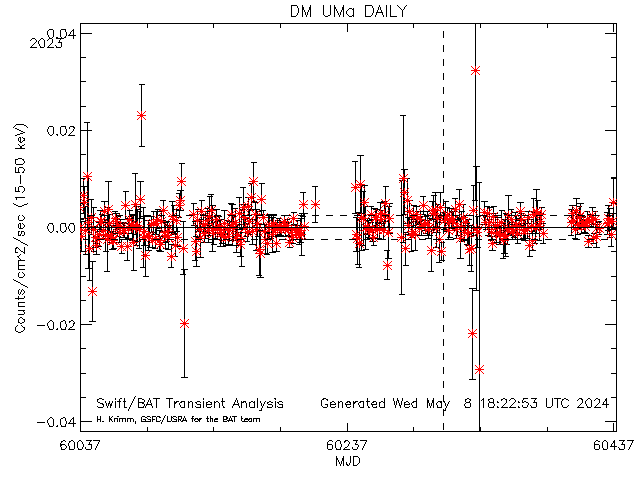
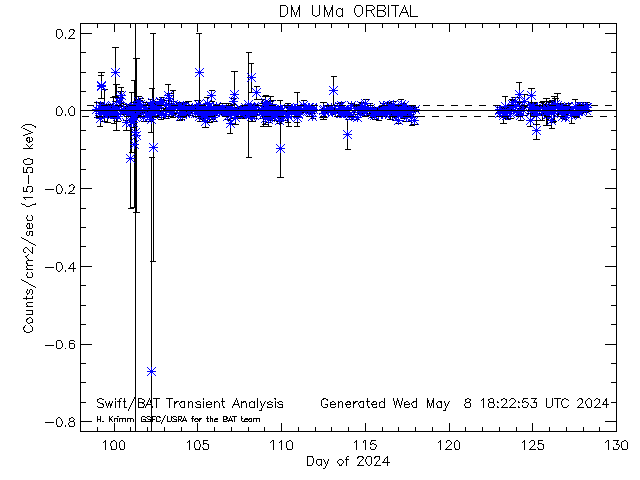
Dashed lines show average rate (and +/- 1 sigma standard deviation) for this source (derived from this plot)
[30175] DM UMa RA= 163.931 degs; Dec= 60.4694 degs
Daily light curves: FITS version ASCII version
Orbit light curves: FITS version ASCII version
Full mission light curve
-------------------------------------------------------------------------------------------------------------------------------------------------------------------
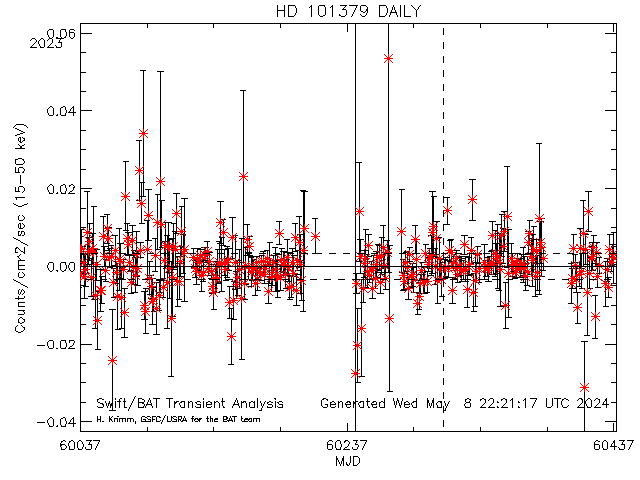
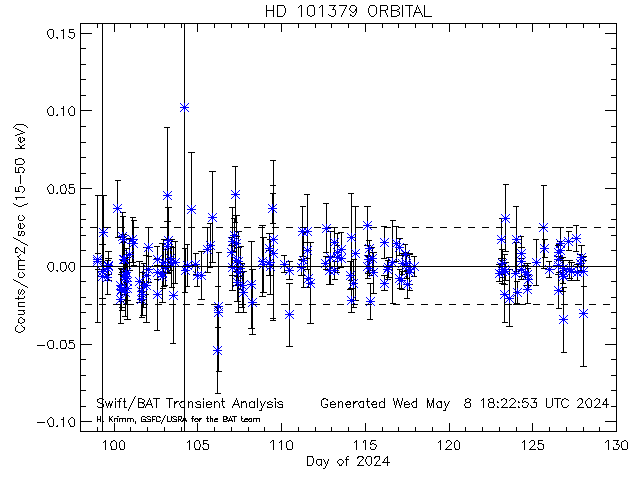
Dashed lines show average rate (and +/- 1 sigma standard deviation) for this source (derived from this plot)
[30176] HD 101379 RA= 174.875 degs; Dec= -65.3978 degs
Daily light curves: FITS version ASCII version
Orbit light curves: FITS version ASCII version
Full mission light curve
-------------------------------------------------------------------------------------------------------------------------------------------------------------------
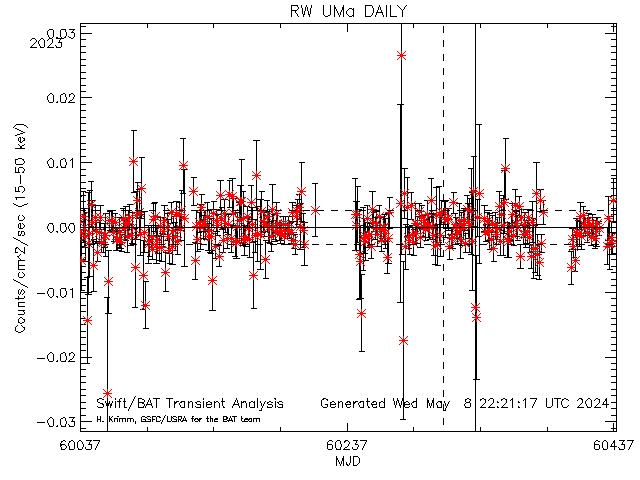
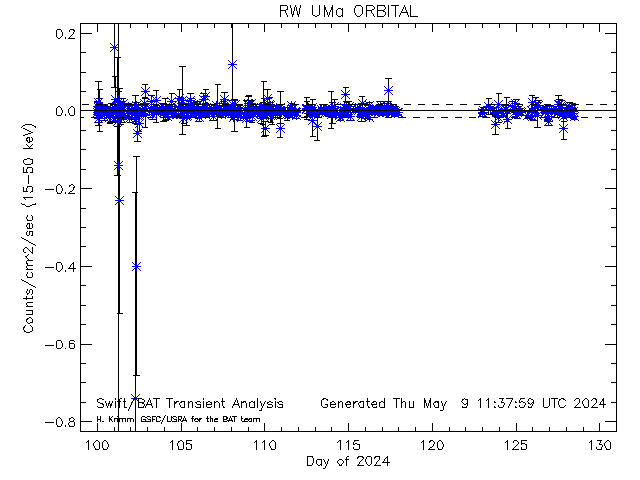
Dashed lines show average rate (and +/- 1 sigma standard deviation) for this source (derived from this plot)
[30177] RW UMa RA= 175.193 degs; Dec= 51.9981 degs
Daily light curves: FITS version ASCII version
Orbit light curves: FITS version ASCII version
Full mission light curve
-------------------------------------------------------------------------------------------------------------------------------------------------------------------
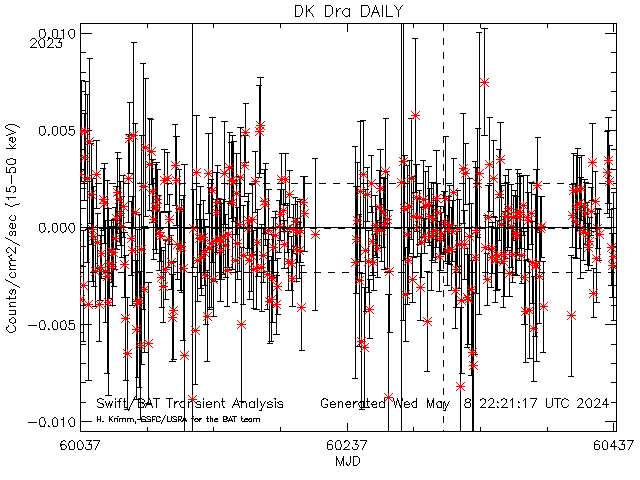
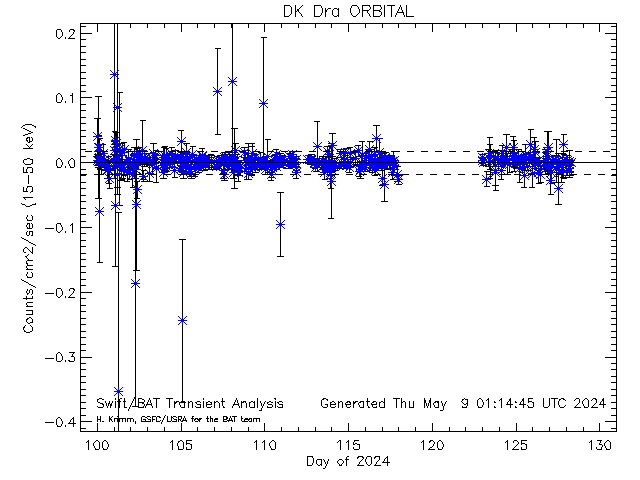
Dashed lines show average rate (and +/- 1 sigma standard deviation) for this source (derived from this plot)
[30178] DK Dra RA= 183.923 degs; Dec= 72.5511 degs
Daily light curves: FITS version ASCII version
Orbit light curves: FITS version ASCII version
Full mission light curve
-------------------------------------------------------------------------------------------------------------------------------------------------------------------
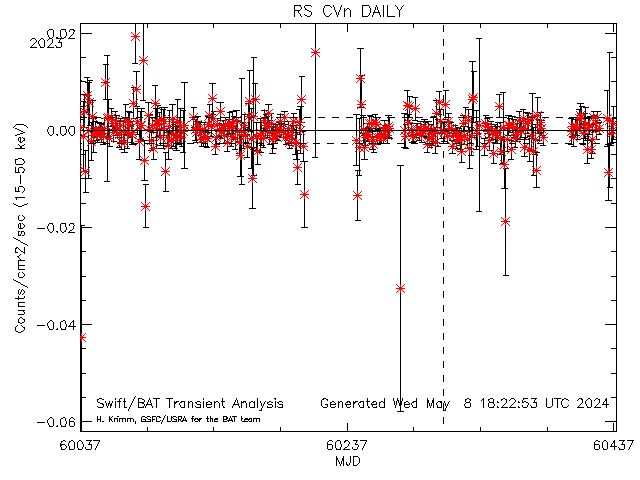
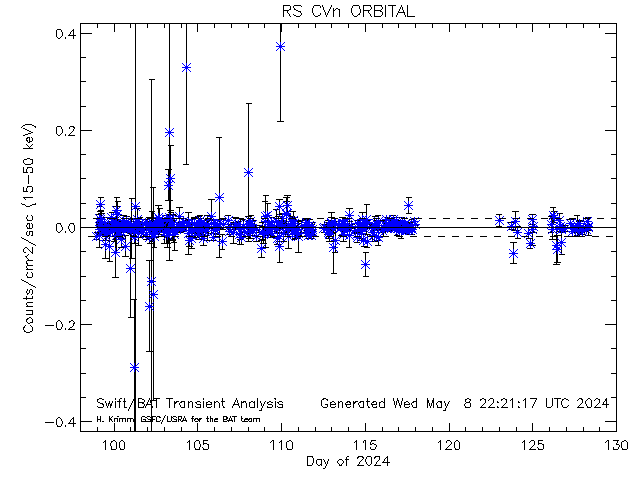
Dashed lines show average rate (and +/- 1 sigma standard deviation) for this source (derived from this plot)
[30179] RS CVn RA= 197.654 degs; Dec= 35.9350 degs
Daily light curves: FITS version ASCII version
Orbit light curves: FITS version ASCII version
Full mission light curve
-------------------------------------------------------------------------------------------------------------------------------------------------------------------
Dashed lines show average rate (and +/- 1 sigma standard deviation) for this source (derived from this plot)
[30180] FK Com RA= 202.695 degs; Dec= 24.2328 degs
Daily light curves: FITS version ASCII version
Orbit light curves: FITS version ASCII version
Full mission light curve
-------------------------------------------------------------------------------------------------------------------------------------------------------------------
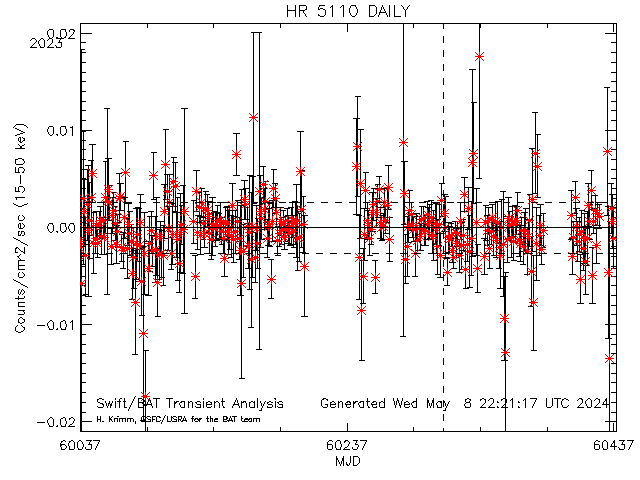

Dashed lines show average rate (and +/- 1 sigma standard deviation) for this source (derived from this plot)
[30181] HR 5110 RA= 203.699 degs; Dec= 37.1825 degs
Daily light curves: FITS version ASCII version
Orbit light curves: FITS version ASCII version
Full mission light curve
-------------------------------------------------------------------------------------------------------------------------------------------------------------------
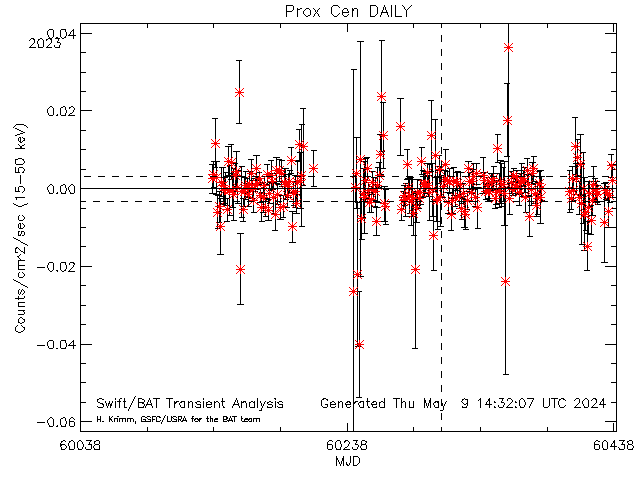
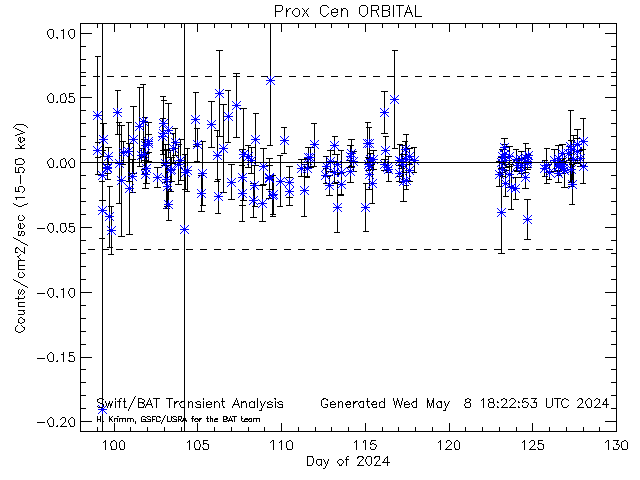
Dashed lines show average rate (and +/- 1 sigma standard deviation) for this source (derived from this plot)
[30182] Prox Cen RA= 217.429 degs; Dec= -62.6794 degs
Daily light curves: FITS version ASCII version
Orbit light curves: FITS version ASCII version
Full mission light curve
-------------------------------------------------------------------------------------------------------------------------------------------------------------------
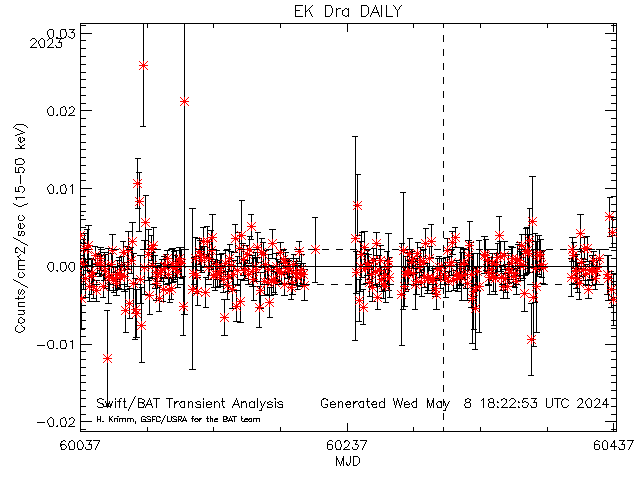
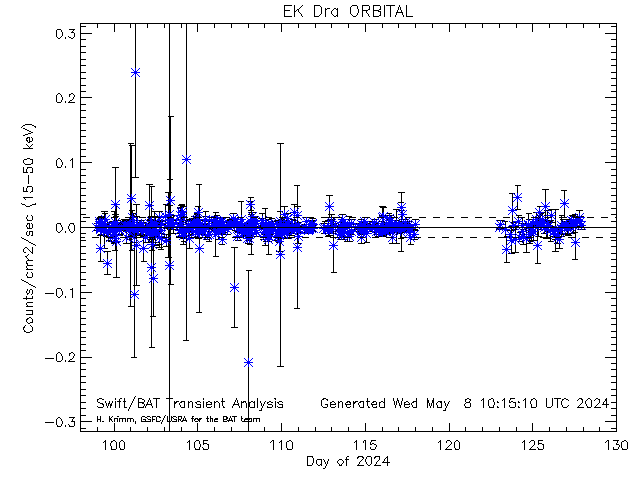
Dashed lines show average rate (and +/- 1 sigma standard deviation) for this source (derived from this plot)
[30183] EK Dra RA= 219.751 degs; Dec= 64.2917 degs
Daily light curves: FITS version ASCII version
Orbit light curves: FITS version ASCII version
Full mission light curve
-------------------------------------------------------------------------------------------------------------------------------------------------------------------
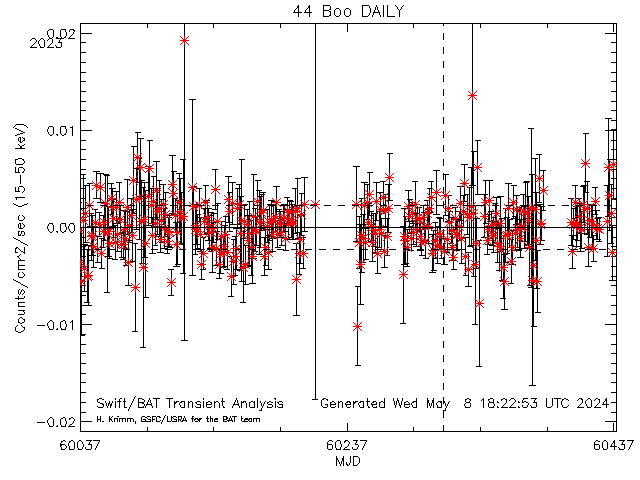
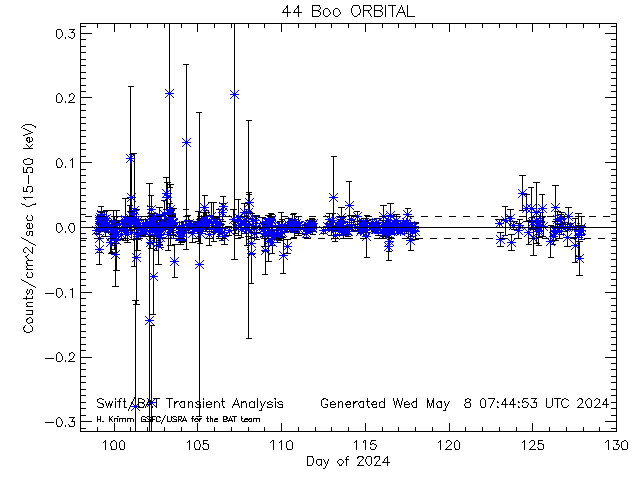
Dashed lines show average rate (and +/- 1 sigma standard deviation) for this source (derived from this plot)
[30184] 44 Boo RA= 225.947 degs; Dec= 47.6542 degs
Daily light curves: FITS version ASCII version
Orbit light curves: FITS version ASCII version
Full mission light curve
-------------------------------------------------------------------------------------------------------------------------------------------------------------------
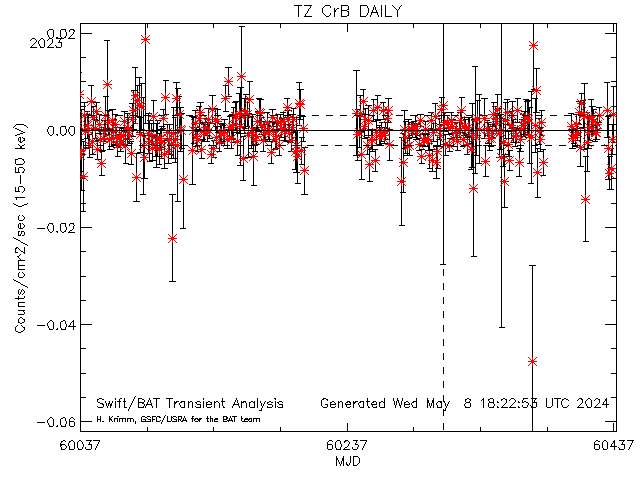
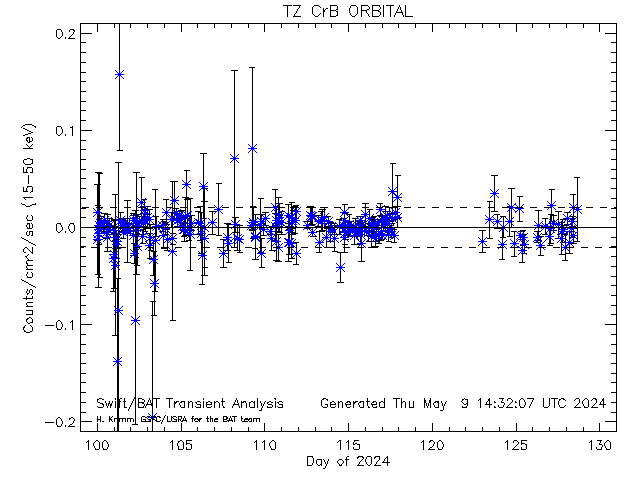
Dashed lines show average rate (and +/- 1 sigma standard deviation) for this source (derived from this plot)
[30185] TZ CrB RA= 243.670 degs; Dec= 33.8586 degs
Daily light curves: FITS version ASCII version
Orbit light curves: FITS version ASCII version
Full mission light curve
-------------------------------------------------------------------------------------------------------------------------------------------------------------------
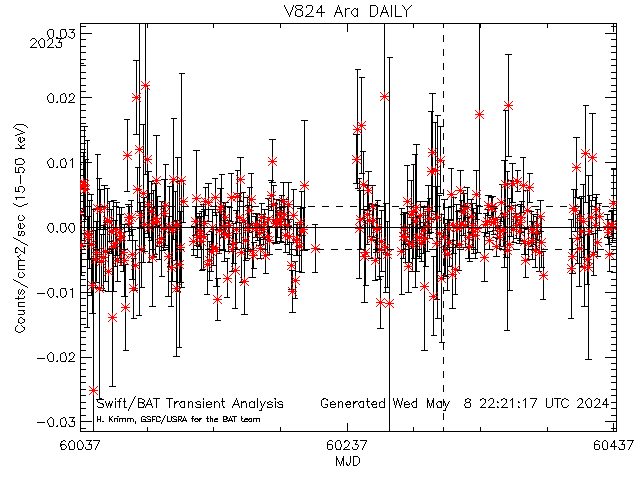
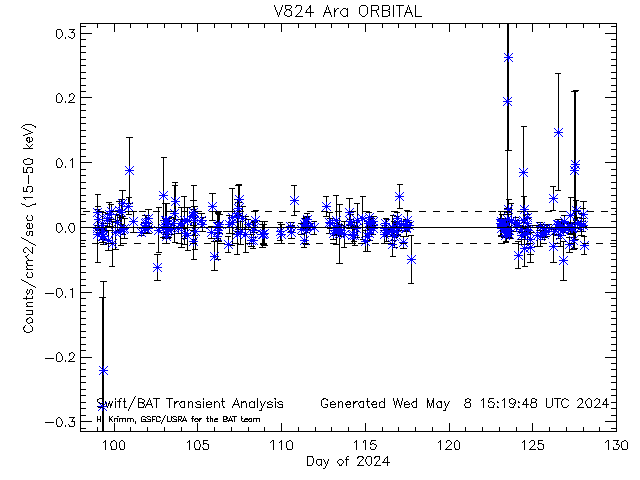
Dashed lines show average rate (and +/- 1 sigma standard deviation) for this source (derived from this plot)
[30186] V824 Ara RA= 259.356 degs; Dec= -66.9511 degs
Daily light curves: FITS version ASCII version
Orbit light curves: FITS version ASCII version
Full mission light curve
-------------------------------------------------------------------------------------------------------------------------------------------------------------------
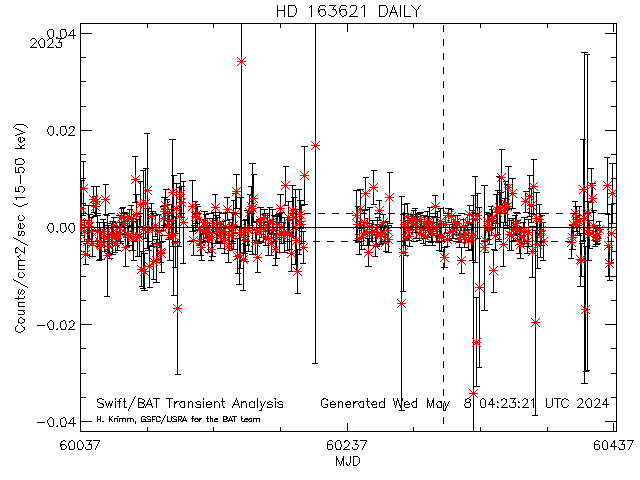
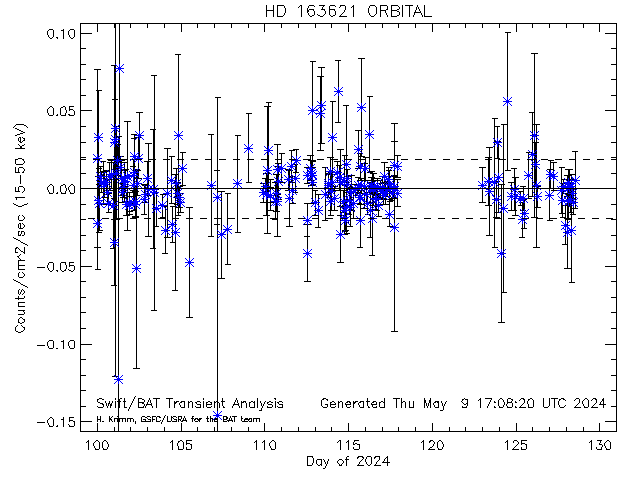
Dashed lines show average rate (and +/- 1 sigma standard deviation) for this source (derived from this plot)
[30187] HD 163621 RA= 268.853 degs; Dec= 36.1889 degs
Daily light curves: FITS version ASCII version
Orbit light curves: FITS version ASCII version
Full mission light curve
-------------------------------------------------------------------------------------------------------------------------------------------------------------------
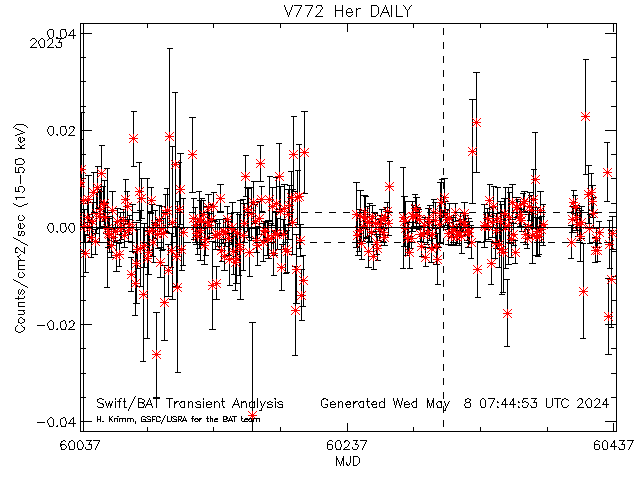
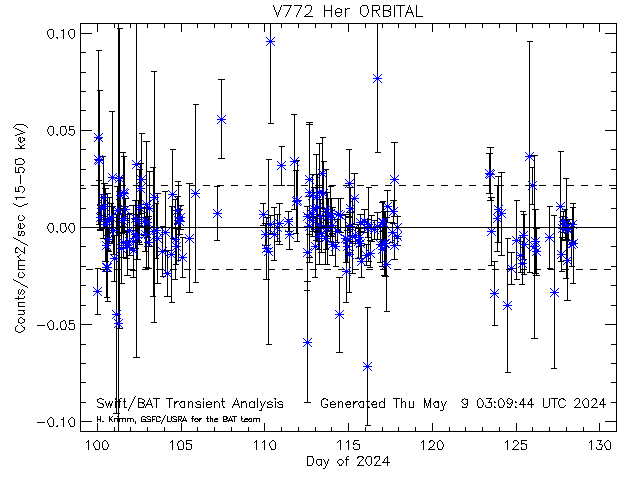
Dashed lines show average rate (and +/- 1 sigma standard deviation) for this source (derived from this plot)
[30188] V772 Her RA= 271.457 degs; Dec= 21.4458 degs
Daily light curves: FITS version ASCII version
Orbit light curves: FITS version ASCII version
Full mission light curve
-------------------------------------------------------------------------------------------------------------------------------------------------------------------
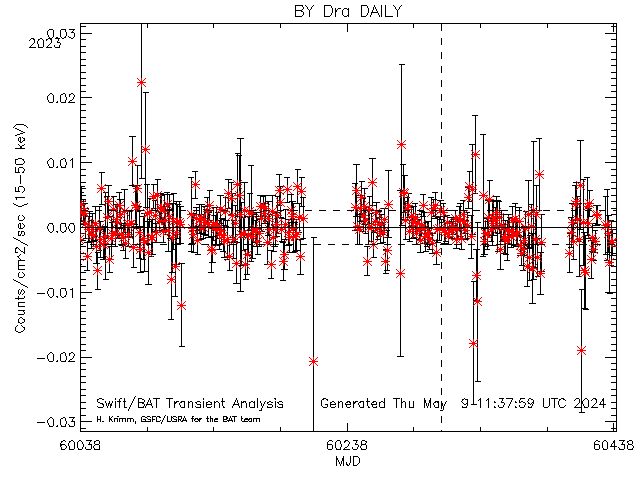
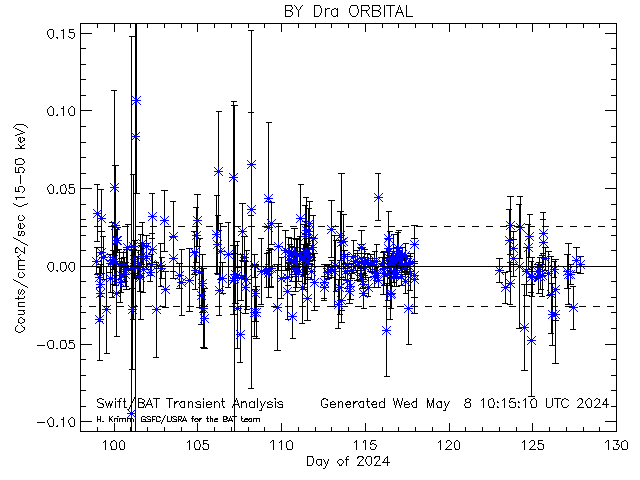
Dashed lines show average rate (and +/- 1 sigma standard deviation) for this source (derived from this plot)
[30189] BY Dra RA= 278.483 degs; Dec= 51.7192 degs
Daily light curves: FITS version ASCII version
Orbit light curves: FITS version ASCII version
Full mission light curve
-------------------------------------------------------------------------------------------------------------------------------------------------------------------
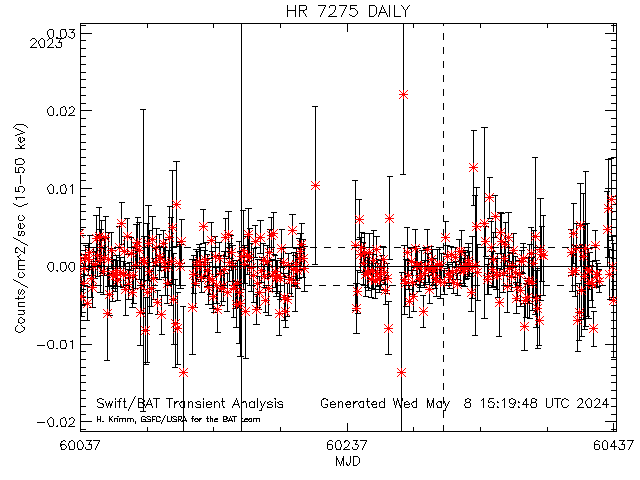
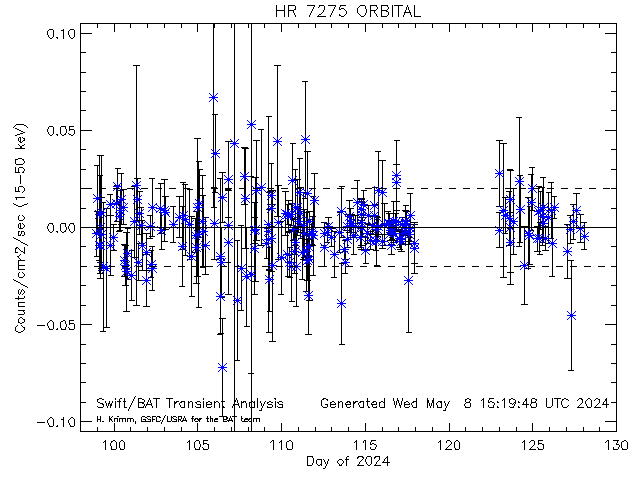
Dashed lines show average rate (and +/- 1 sigma standard deviation) for this source (derived from this plot)
[30190] HR 7275 RA= 287.108 degs; Dec= 52.4258 degs
Daily light curves: FITS version ASCII version
Orbit light curves: FITS version ASCII version
Full mission light curve
-------------------------------------------------------------------------------------------------------------------------------------------------------------------
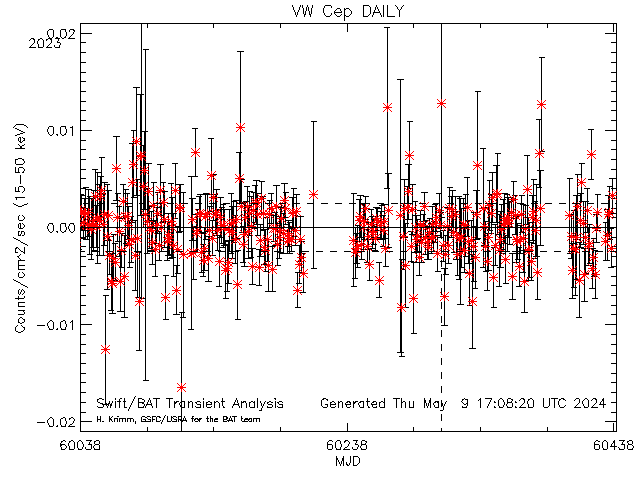
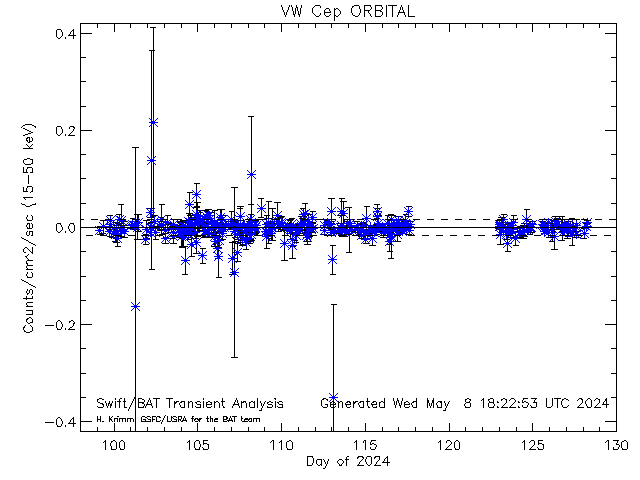
Dashed lines show average rate (and +/- 1 sigma standard deviation) for this source (derived from this plot)
[30191] VW Cep RA= 309.340 degs; Dec= 75.6003 degs
Daily light curves: FITS version ASCII version
Orbit light curves: FITS version ASCII version
Full mission light curve
-------------------------------------------------------------------------------------------------------------------------------------------------------------------
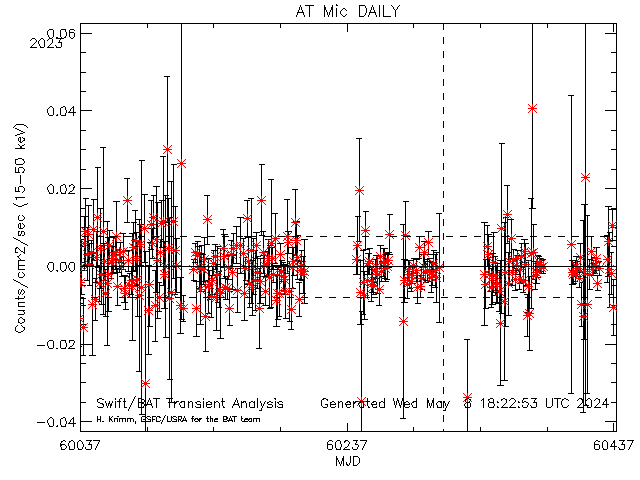
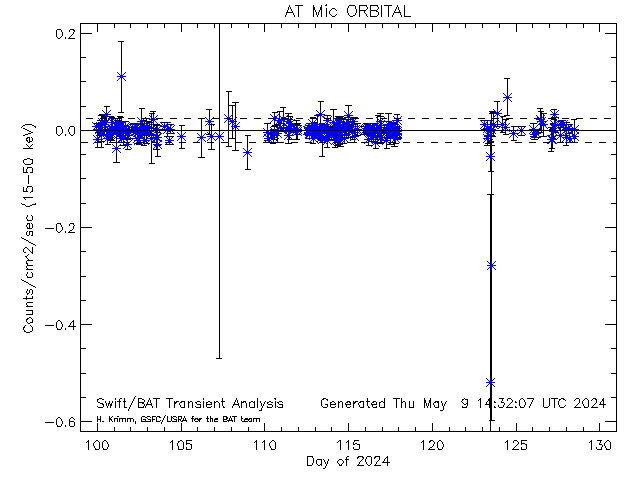
Dashed lines show average rate (and +/- 1 sigma standard deviation) for this source (derived from this plot)
[30192] AT Mic RA= 310.463 degs; Dec= -32.4353 degs
Daily light curves: FITS version ASCII version
Orbit light curves: FITS version ASCII version
Full mission light curve
-------------------------------------------------------------------------------------------------------------------------------------------------------------------
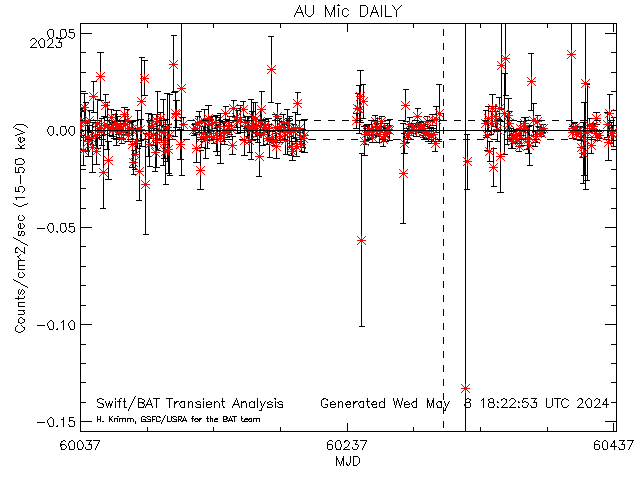
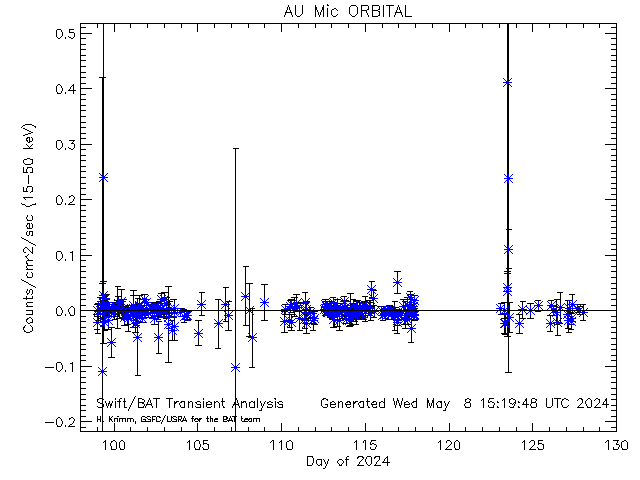
Dashed lines show average rate (and +/- 1 sigma standard deviation) for this source (derived from this plot)
[30193] AU Mic RA= 311.290 degs; Dec= -31.3408 degs
Daily light curves: FITS version ASCII version
Orbit light curves: FITS version ASCII version
Full mission light curve
-------------------------------------------------------------------------------------------------------------------------------------------------------------------
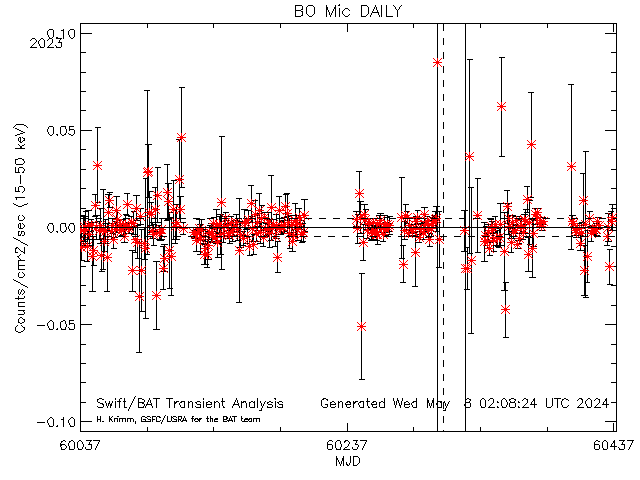
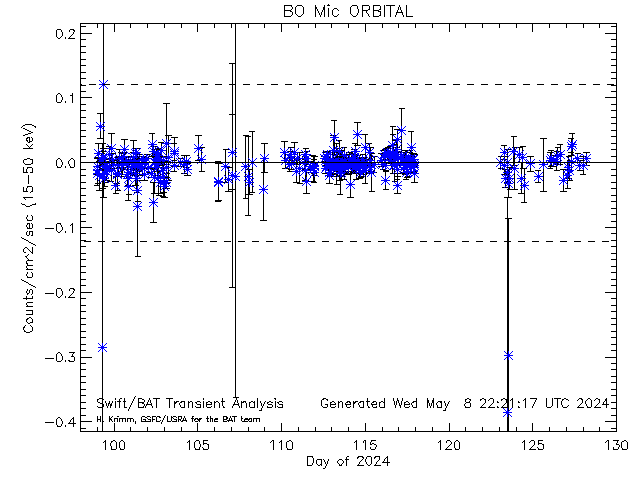
Dashed lines show average rate (and +/- 1 sigma standard deviation) for this source (derived from this plot)
[30194] BO Mic RA= 311.937 degs; Dec= -36.5942 degs
Daily light curves: FITS version ASCII version
Orbit light curves: FITS version ASCII version
Full mission light curve
-------------------------------------------------------------------------------------------------------------------------------------------------------------------
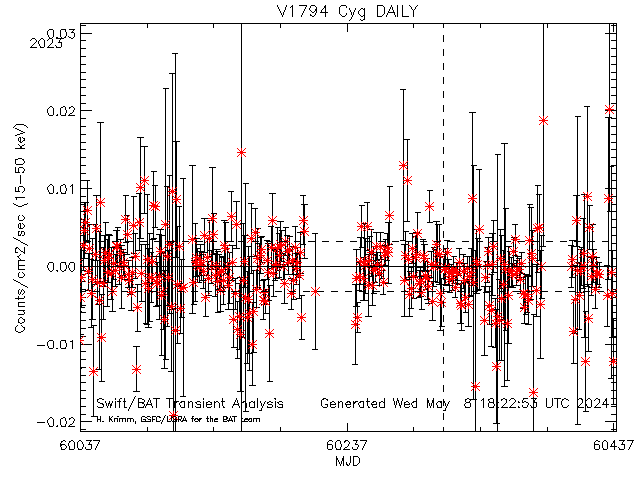
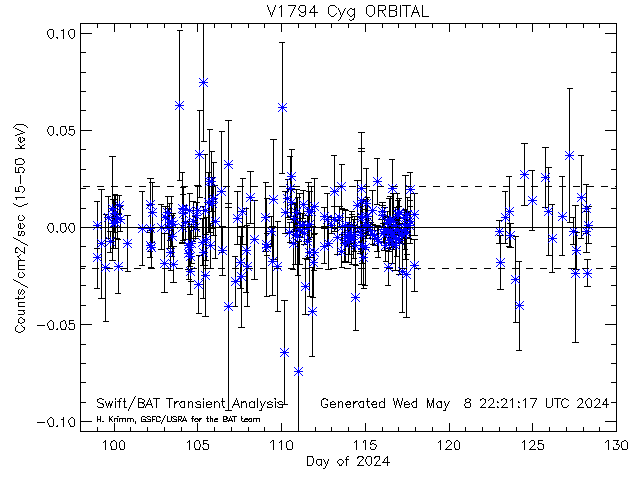
Dashed lines show average rate (and +/- 1 sigma standard deviation) for this source (derived from this plot)
[30195] V1794 Cyg RA= 313.473 degs; Dec= 44.3864 degs
Daily light curves: FITS version ASCII version
Orbit light curves: FITS version ASCII version
Full mission light curve
-------------------------------------------------------------------------------------------------------------------------------------------------------------------
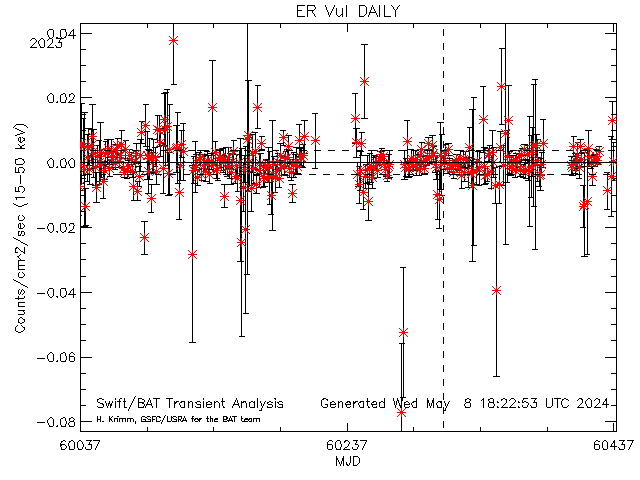
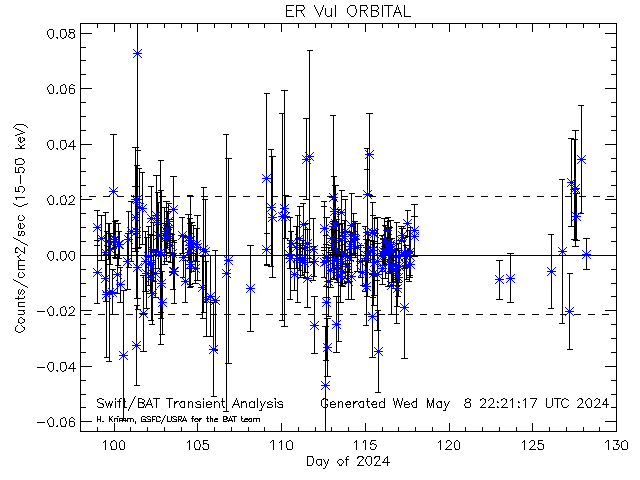
Dashed lines show average rate (and +/- 1 sigma standard deviation) for this source (derived from this plot)
[30196] ER Vul RA= 315.608 degs; Dec= 27.8075 degs
Daily light curves: FITS version ASCII version
Orbit light curves: FITS version ASCII version
Full mission light curve
-------------------------------------------------------------------------------------------------------------------------------------------------------------------
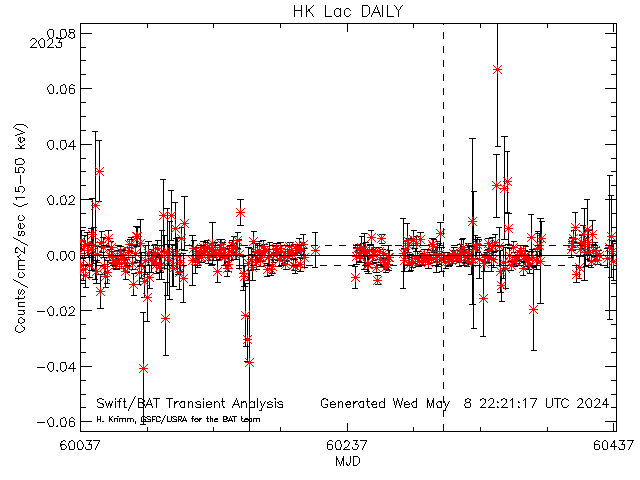
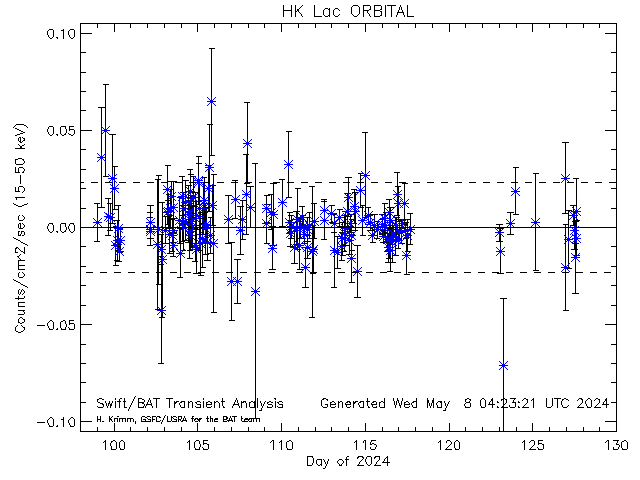
Dashed lines show average rate (and +/- 1 sigma standard deviation) for this source (derived from this plot)
[30197] HK Lac RA= 331.236 degs; Dec= 47.2344 degs
Daily light curves: FITS version ASCII version
Orbit light curves: FITS version ASCII version
Full mission light curve
-------------------------------------------------------------------------------------------------------------------------------------------------------------------
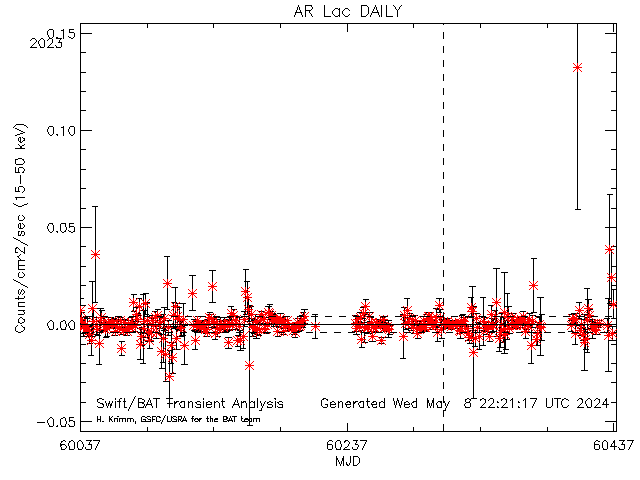
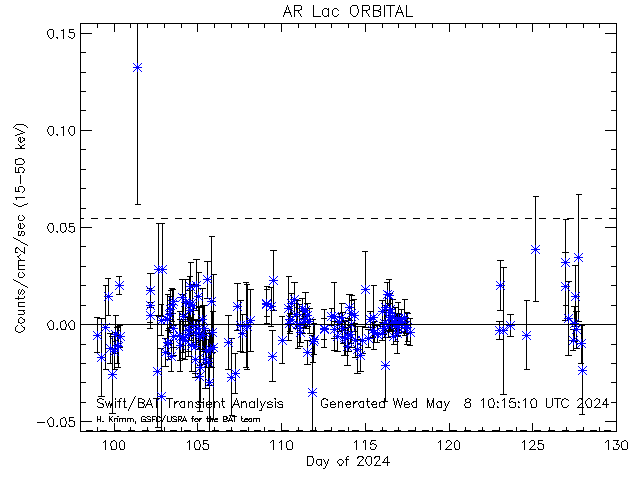
Dashed lines show average rate (and +/- 1 sigma standard deviation) for this source (derived from this plot)
[30198] AR Lac RA= 332.170 degs; Dec= 45.7422 degs
Daily light curves: FITS version ASCII version
Orbit light curves: FITS version ASCII version
Full mission light curve
-------------------------------------------------------------------------------------------------------------------------------------------------------------------
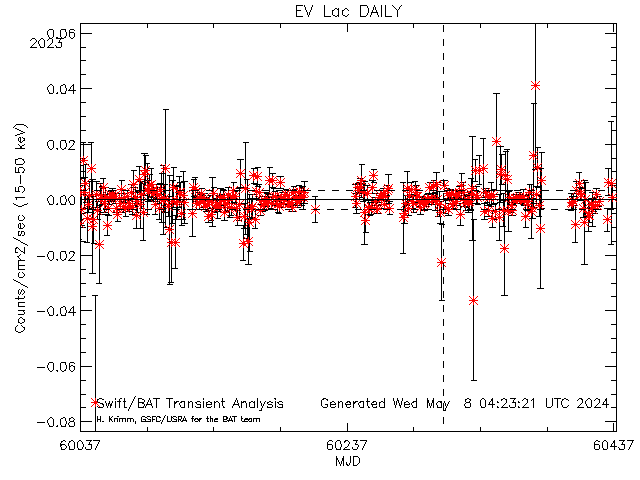
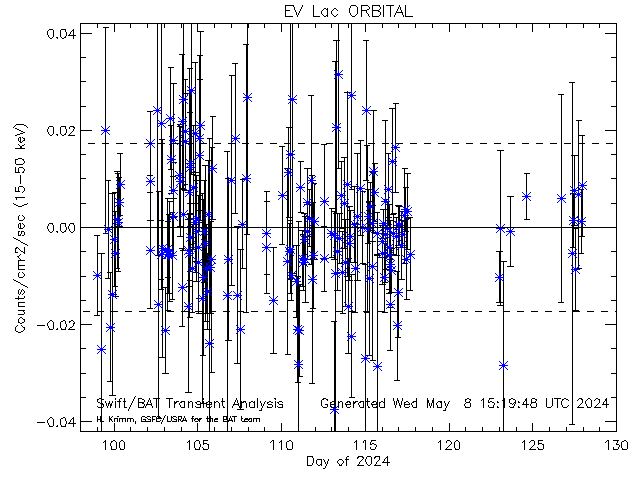
Dashed lines show average rate (and +/- 1 sigma standard deviation) for this source (derived from this plot)
[30199] EV Lac RA= 341.707 degs; Dec= 44.3339 degs
Daily light curves: FITS version ASCII version
Orbit light curves: FITS version ASCII version
Full mission light curve
-------------------------------------------------------------------------------------------------------------------------------------------------------------------
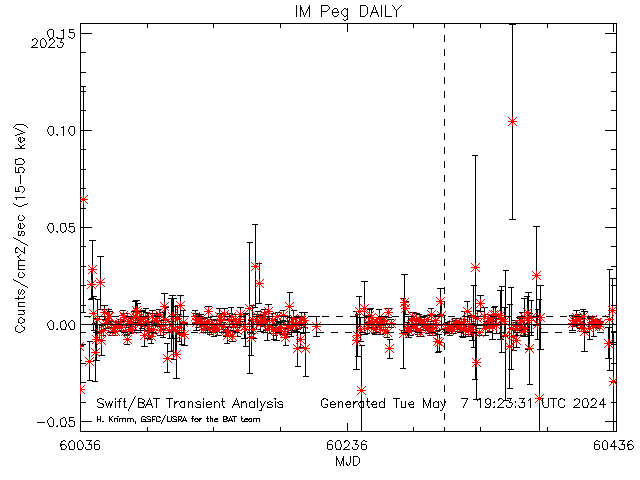
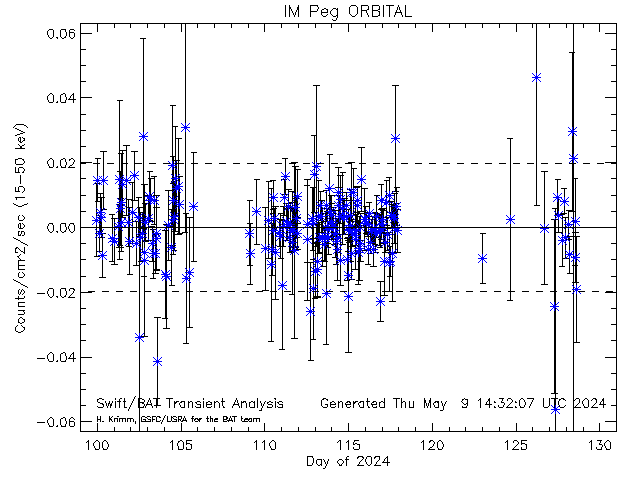
Dashed lines show average rate (and +/- 1 sigma standard deviation) for this source (derived from this plot)
[30200] IM Peg RA= 343.260 degs; Dec= 16.8411 degs
Daily light curves: FITS version ASCII version
Orbit light curves: FITS version ASCII version
Full mission light curve
-------------------------------------------------------------------------------------------------------------------------------------------------------------------
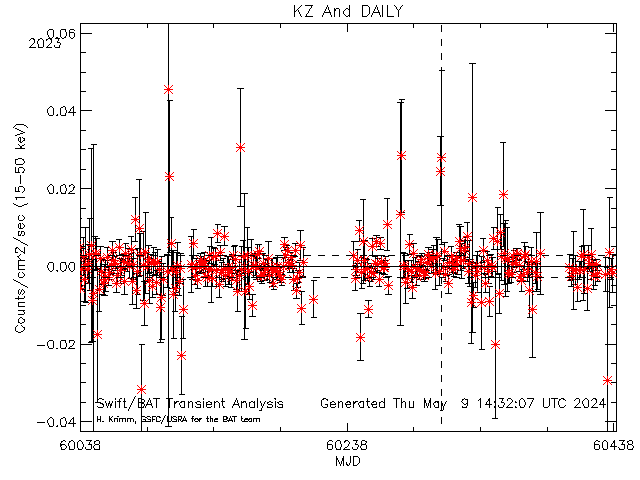
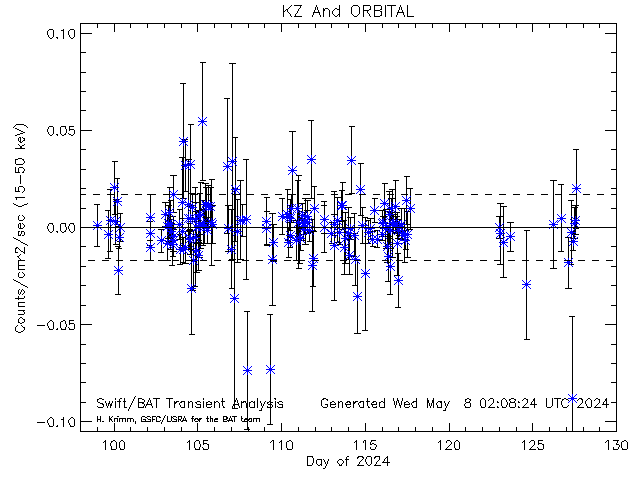
Dashed lines show average rate (and +/- 1 sigma standard deviation) for this source (derived from this plot)
[30201] KZ And RA= 347.489 degs; Dec= 47.9583 degs
Daily light curves: FITS version ASCII version
Orbit light curves: FITS version ASCII version
Full mission light curve
-------------------------------------------------------------------------------------------------------------------------------------------------------------------
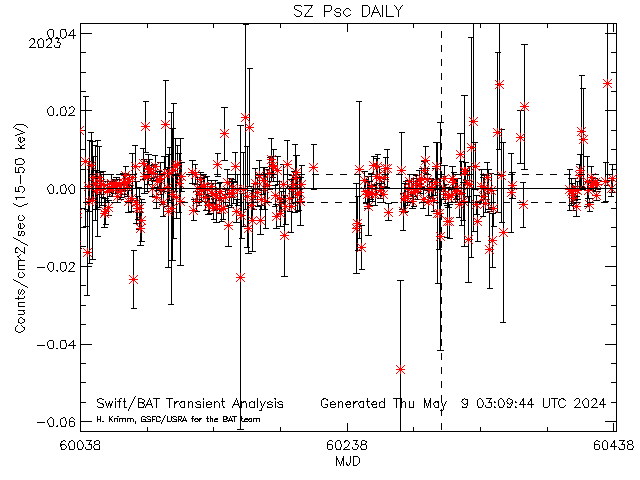
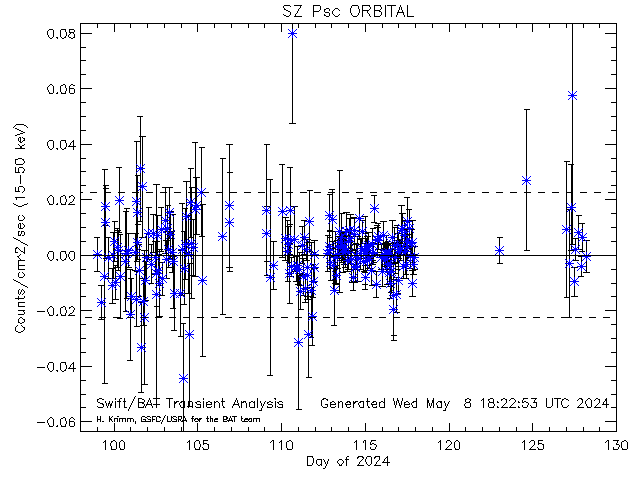
Dashed lines show average rate (and +/- 1 sigma standard deviation) for this source (derived from this plot)
[30202] SZ Psc RA= 348.349 degs; Dec= 2.67556 degs
Daily light curves: FITS version ASCII version
Orbit light curves: FITS version ASCII version
Full mission light curve
-------------------------------------------------------------------------------------------------------------------------------------------------------------------
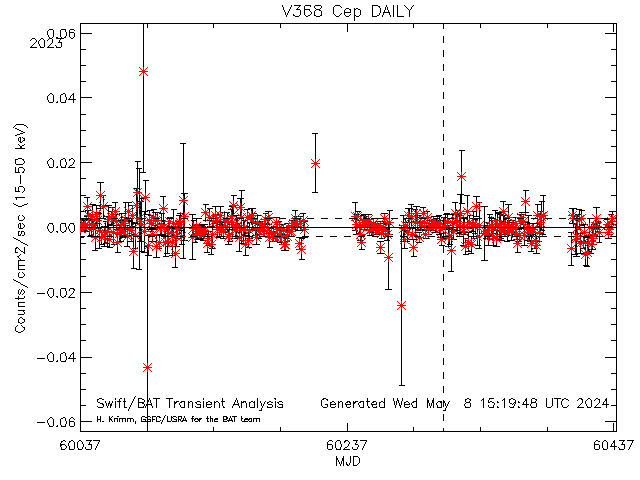
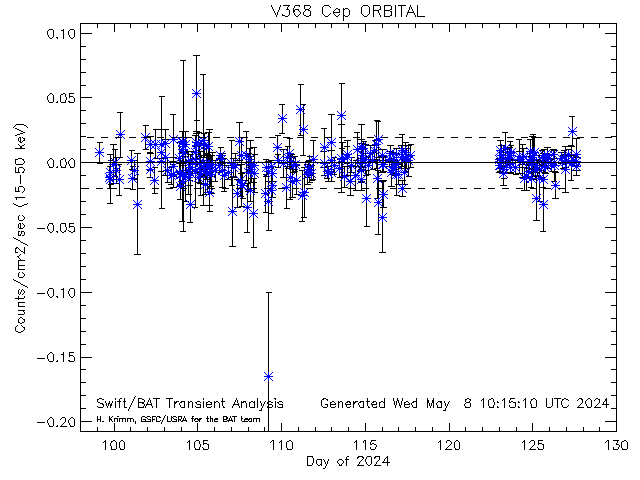
Dashed lines show average rate (and +/- 1 sigma standard deviation) for this source (derived from this plot)
[30203] V368 Cep RA= 349.861 degs; Dec= 79.0036 degs
Daily light curves: FITS version ASCII version
Orbit light curves: FITS version ASCII version
Full mission light curve
-------------------------------------------------------------------------------------------------------------------------------------------------------------------
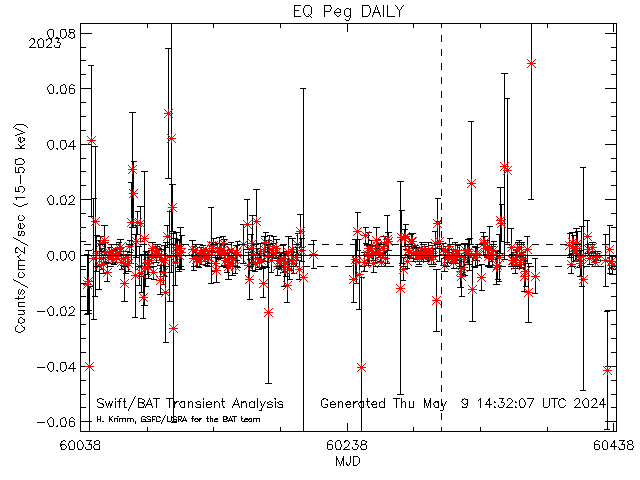
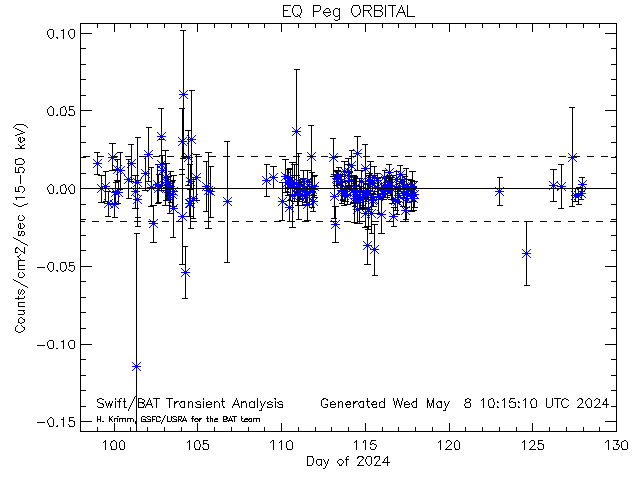
Dashed lines show average rate (and +/- 1 sigma standard deviation) for this source (derived from this plot)
[33990] EQ Peg RA= 352.967 degs; Dec= 19.9370 degs
Daily light curves: FITS version ASCII version
Orbit light curves: FITS version ASCII version
Full mission light curve
-------------------------------------------------------------------------------------------------------------------------------------------------------------------
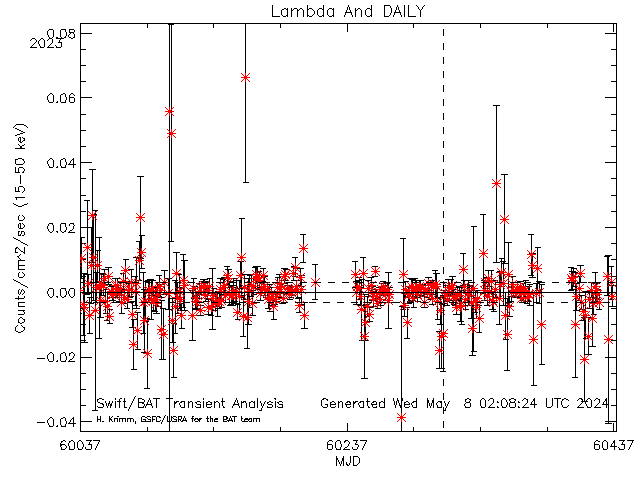
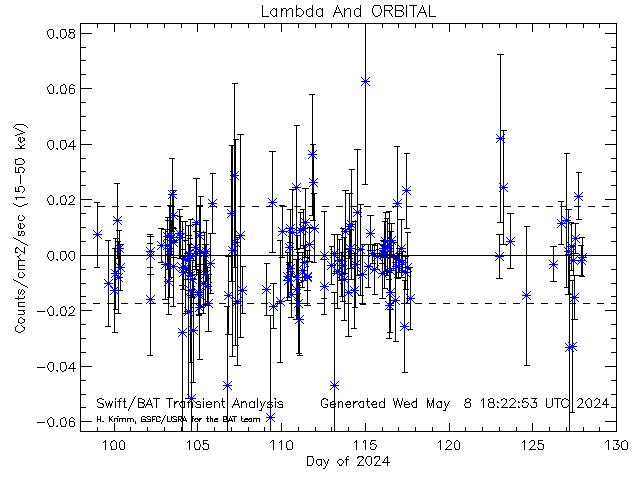
Dashed lines show average rate (and +/- 1 sigma standard deviation) for this source (derived from this plot)
[30204] Lambda And RA= 354.391 degs; Dec= 46.4581 degs
Daily light curves: FITS version ASCII version
Orbit light curves: FITS version ASCII version
Full mission light curve
-------------------------------------------------------------------------------------------------------------------------------------------------------------------
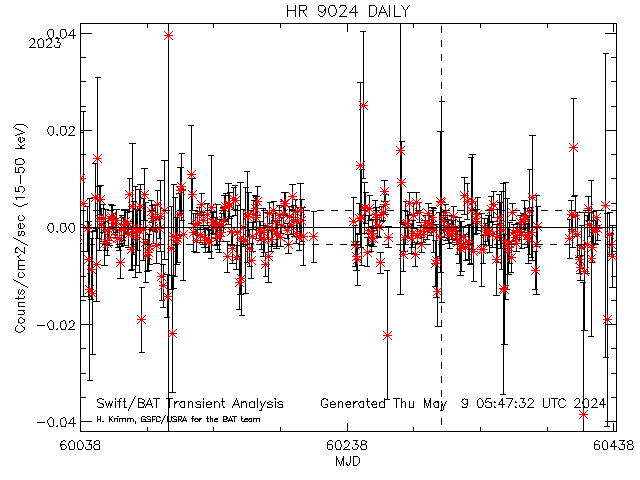
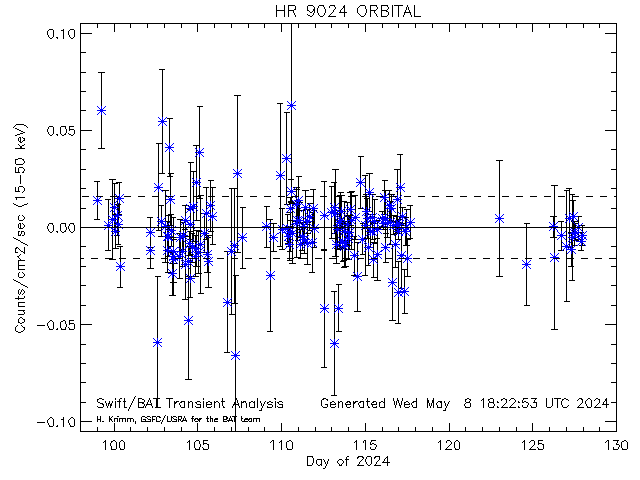
Dashed lines show average rate (and +/- 1 sigma standard deviation) for this source (derived from this plot)
[30205] HR 9024 RA= 357.421 degs; Dec= 36.4253 degs
Daily light curves: FITS version ASCII version
Orbit light curves: FITS version ASCII version
Full mission light curve
-------------------------------------------------------------------------------------------------------------------------------------------------------------------
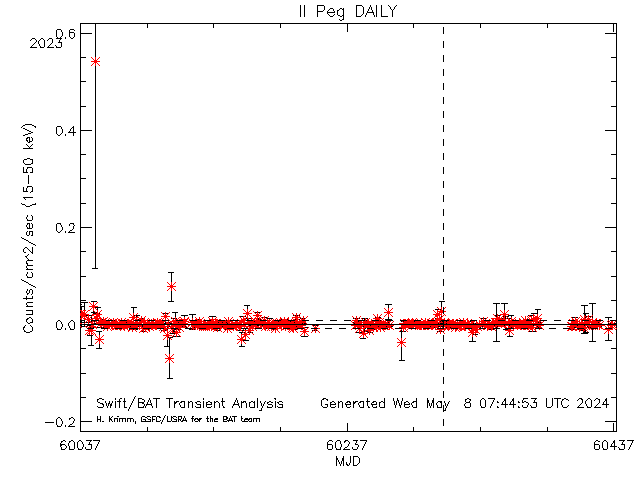
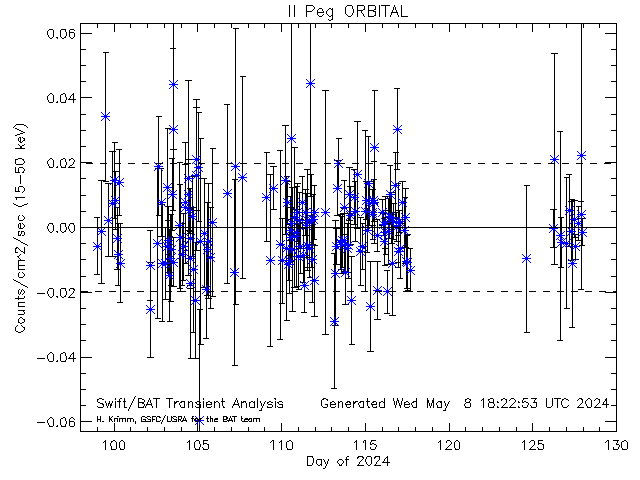
Dashed lines show average rate (and +/- 1 sigma standard deviation) for this source (derived from this plot)
[30206] II Peg RA= 358.767 degs; Dec= 28.6336 degs
Daily light curves: FITS version ASCII version
Orbit light curves: FITS version ASCII version
Full mission light curve
* Explanation of last four table headings:
This page was last modified on Fri Apr 26 19:32:17 UTC 2024
The BAT Transient Monitor contacts are:
Tyler Parsotan,
tyler.parsotan@nasa.gov,
Amy Lien,
amy.y.lien@nasa.gov,
301.286.3624
Hans Krimm,
hans.krimm@nasa.gov,
301-286-6955

- Curator: J.D. Myers
- NASA Official & Swift PI: Brad Cenko
- PAO Contact: Francis Reddy
- Questions/Comments/Feedback
- › Privacy Policy and Important Notices
- › Accessibility
- › Contact NASA
- › Page Last Updated: Fri, Apr 26, 2024