
Swift/BAT Hard X-ray Transient Monitor
Please Read Before Using These Results:README
Main pageData current through 21:33 UT, March 12 (DOY 71), 2026
Sources are considered detected and added to this page under the following circumstances
Swift/BAT Transient Sources (Currently Detected)
| Source Name | RA J2000 Degs | Dec J2000 Degs | Alternate Name | Source Type | Today# | Yesterday# | Tenday# | Mean* | Peak* | Days* | Last Day* | |
|---|---|---|---|---|---|---|---|---|---|---|---|---|
| 1 | Sco X-1 | 244.979 | -15.6400 | V818 Sco | LMXB/NS | 2272 (27.7) | 986 (20.9) | 1280 (76.1) | 996 | 5134 | 754 | 60018 ( 163) |
| 2 | Crab | 83.6330 | 22.0150 | M1 | PSR/PWN | 931 (22.4) | 956 (27.0) | 1016 (82.3) | 1000 | 5754 | 5632 | 60033 ( 148) |
| 3 | Cyg X-1 | 299.591 | 35.2020 | V1357 Cyg | HMXB/BH | 675 (11.4) | 800 (26.0) | 864 (82.4) | 203 | 1918 | 6272 | 60161 ( 20) |
| 4 | 4U 1700-377 | 255.987 | -37.8440 | V884 Sco | HMXB/NS | 578 (14.2) | 815 (17.5) | 218 (29.7) | 136 | 2079 | 562 | 60057 ( 124) |
| 5 | AX J1700.2-4220 | 255.105 | -42.3170 | 2MASS J17002524-4219003 | HMXB | 370 ( 2.7) | - | - | 1 | 0 | 1 | 1 ( 0) |
| 6 | Swift J0243.6+6124 | 40.9186 | 61.4323 | NULL | NULL | 343 (16.9) | 380 (21.7) | 458 (77.7) | 18 | 8470 | 416 | 58064 ( 2117) |
| 7 | SWIFT J1713.4-4219 | 258.361 | -42.3270 | NULL | Transient | 326 ( 2.1) | - | - | 0 | 0 | 1 | 1 ( 0) |
| 8 | IGR J18325-0756 | 278.125 | -7.93300 | CXOU J183228.3-075641 | X-ray source | 275 ( 2.0) | - | - | 0 | 0 | 4 | 1 ( 0) |
| 9 | Vela X-1 | 135.529 | -40.5550 | GP Vel | HMXB/NS | 241 (15.1) | 306 (15.7) | 220 (41.7) | 128 | 2655 | 5165 | 56544 ( 3637) |
| 10 | 4U 1812-12 | 273.776 | -12.0960 | LMXB/NS | - | - | 29 ( 3.9) | 24 | 94 | 1460 | 53787 ( 6394) | |
| 11 | 4U 1630-472 | 248.504 | -47.3930 | Nor X-1 | LMXB/BHC | 185 ( 2.4) | 111 ( 4.6) | 91 (15.3) | 29 | 830 | 103 | 60033 ( 148) |
| 12 | H1705-440 | 257.225 | -44.1020 | 4U 1705-440 | LMXB/NS | - | - | 15 ( 2.3) | 25 | 133 | 1618 | 59146 ( 1035) |
| 13 | QSO J2246-1206 | 341.576 | -12.1142 | Quasar | 160 ( 3.4) | - | - | 0 | - | - | - | |
| 14 | SNR 021.5-00.9 | 278.390 | -10.5690 | SNR | - | - | 15 ( 2.0) | 3 | 0 | 4 | 1 ( 0) | |
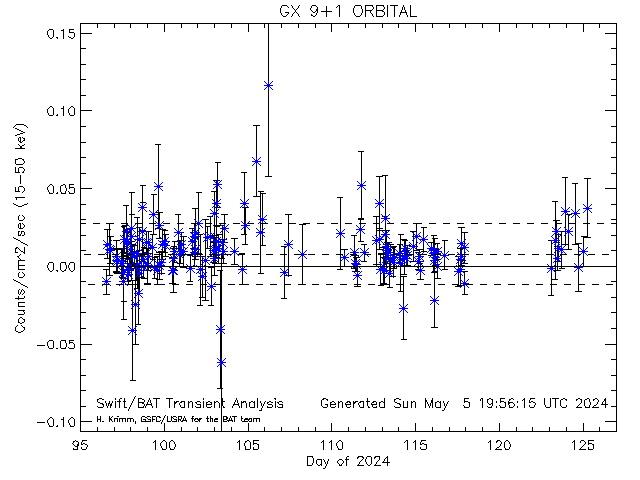
| 15 | GX 9+1 | 270.385 | -20.5290 | Sgr X-3 | LMXB/NS | - | 58 ( 2.4) | 48 ( 6.6) | 36 | 84 | 2998 | 58563 ( 1618) |
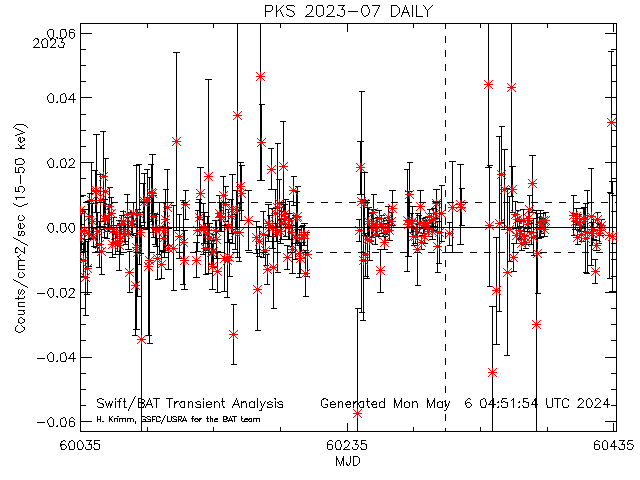
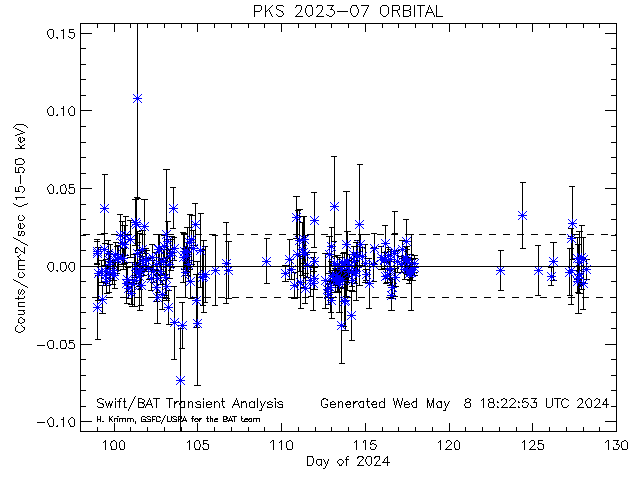
| 16 | PKS 2023-07 | 306.419 | -7.59800 | QSO B2022-077 | BL Lac | 148 ( 2.9) | - | - | 0 | 0 | 1 | 1 ( 0) |
| 17 | GX 17+2 | 274.006 | -14.0360 | NP Ser | LMXB/NS | 124 ( 3.3) | 91 ( 3.8) | 89 (13.0) | 86 | 251 | 5173 | 53536 ( 6645) |
| 18 | SN 1993J | 148.850 | 69.0170 | SN | 120 ( 2.2) | - | - | 0 | 0 | 1 | 1 ( 0) | |
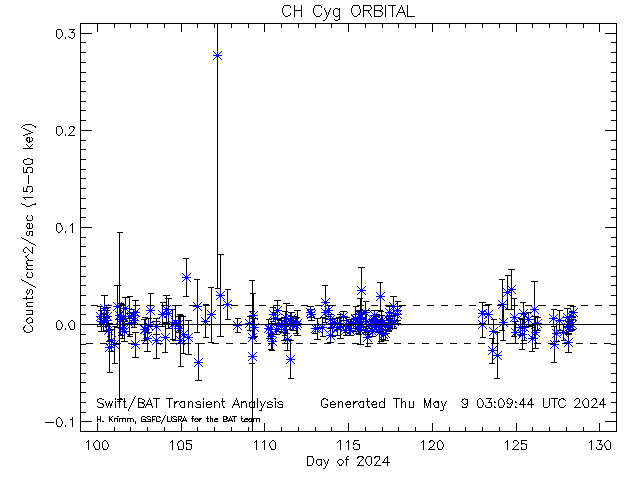
| 19 | CH Cyg | 291.138 | 50.2414 | HD 182917 | Symb/WD | 119 ( 2.4) | - | 10 ( 3.2) | 1 | 141 | 4 | 59947 ( 234) |
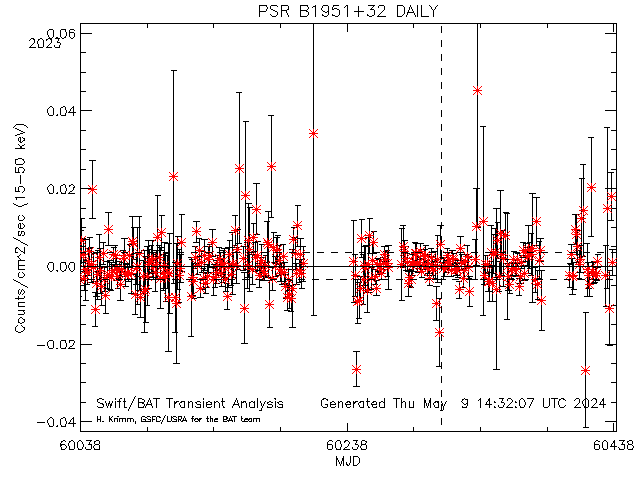
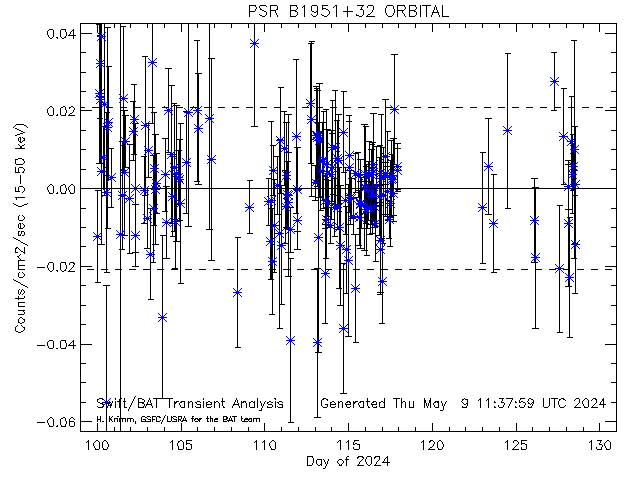
| 20 | PSR B1951+32 | 298.250 | 32.8830 | Pulsar | 118 ( 2.4) | - | - | 0 | 0 | 3 | 1 ( 0) | |
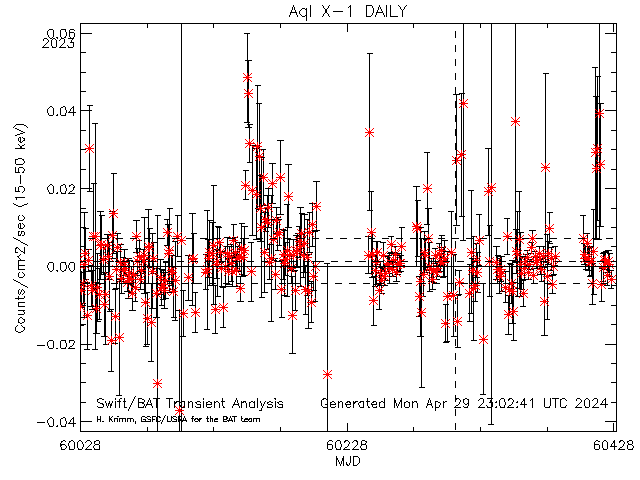
| 21 | Aql X-1 | 287.817 | 0.585000 | V1333 Aql | LMXB/NS | - | 41 ( 2.6) | 39 ( 6.0) | 6 | 212 | 454 | 56457 ( 3724) |
| 22 | V500 Aql | 298.116 | 8.48000 | NOVA Aql 1943 | Nova | 113 ( 2.6) | - | - | 0 | 0 | 1 | 1 ( 0) |
| 23 | NGC 7469 | 345.816 | 8.87386 | Sy2/LINER | 105 ( 3.0) | - | - | 2 | - | - | - | |
| 24 | GX 340+0 | 251.449 | -45.6111 | 4U 1642-45 | LMXB/NS | 102 ( 2.0) | - | 65 (13.7) | 48 | 133 | 2318 | 57707 ( 2474) |
| 25 | PSR J2021+3651 | 305.269 | 36.8570 | 0FGL J2020.8+3649 | Pulsar | 97 ( 2.1) | - | - | 0 | 0 | 3 | 1 ( 0) |
| 26 | 1E 1740.7-2942 | 265.978 | -29.7450 | GREAT ANNIHILATOR | LMXB/BHC | - | - | 19 ( 2.6) | 44 | 124 | 165 | 59855 ( 326) |
| 27 | Swift J164449.3+573451 | 251.205 | 57.5810 | NULL | TDF | 88 ( 2.6) | - | - | 0 | 42 | 6 | 53785 ( 6396) |
| 28 | 3C 371 | 271.711 | 69.8240 | 7C 180717.90+694858.00 | BL Lac | 86 ( 2.4) | - | 6 ( 2.3) | 0 | - | - | - |
| 29 | GX 354-0 | 262.988 | -33.8340 | Slow burster | LMXB/NS | 81 ( 2.1) | 85 ( 2.5) | 30 ( 4.7) | 48 | 209 | 3216 | 54172 ( 6009) |
| 30 | H 1538-522 | 235.597 | -52.3860 | QV Nor | HMXB/NS | - | - | 32 ( 7.9) | 20 | 97 | 969 | 54403 ( 5778) |
| 31 | LMC X-4 | 83.2060 | -66.3700 | HMXB/NS | 79 ( 2.7) | 68 ( 5.6) | 16 ( 6.6) | 18 | 98 | 1572 | 57991 ( 2190) | |
| 32 | GRO J1655-40 | 253.501 | -39.8333 | V1033 Sco | LMXB/BH | 78 ( 2.2) | - | - | 1 | 795 | 62 | 53509 ( 6672) |
| 33 | QSO B2134+0028 | 324.161 | 0.698393 | Quasar | 76 ( 2.1) | - | - | 0 | 0 | 2 | 1 ( 0) | |
| 34 | Rapid Burster | 263.353 | -33.3880 | MXB 1730-335 | LMXB/NS | - | - | 16 ( 2.4) | 2 | 61 | 79 | 54264 ( 5917) |
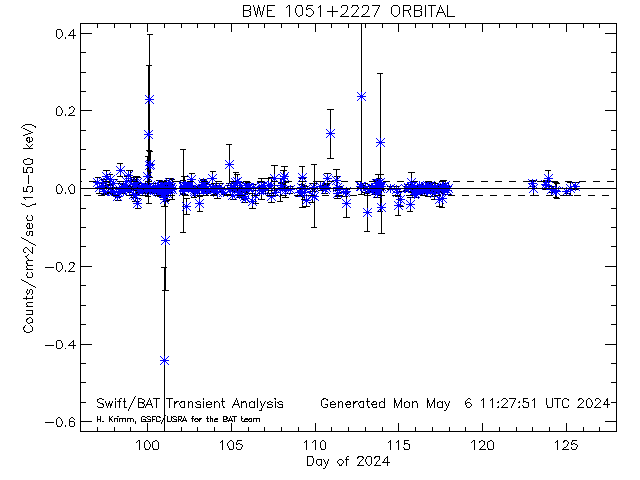
| 35 | BWE 1051+2227 | 163.627 | 22.1820 | 0FGL J1054.5+2212 | Gamma-ray source | - | - | 34 ( 2.3) | 0 | 47 | 3 | 53786 ( 6395) |
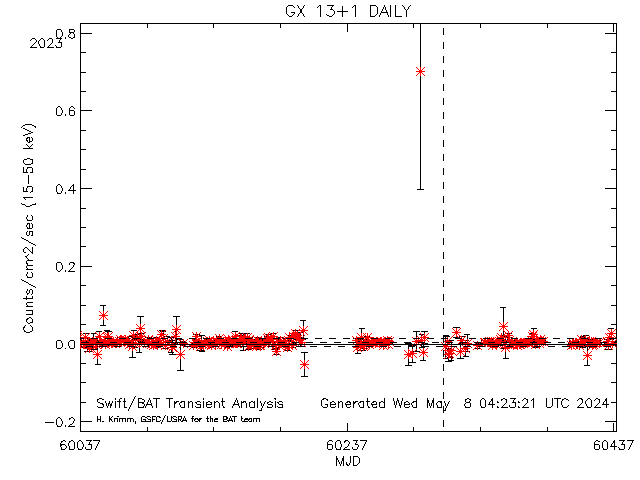
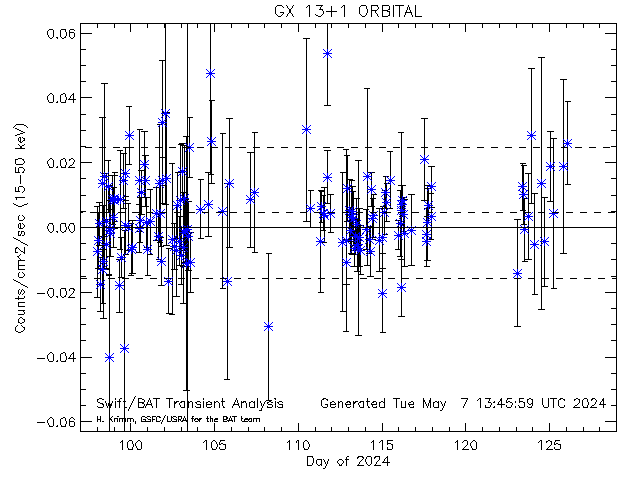
| 36 | GX 13+1 | 273.630 | -17.1570 | V5512 Sgr | LMXB/NS | - | 63 ( 2.7) | - | 20 | 61 | 990 | 57215 ( 2966) |
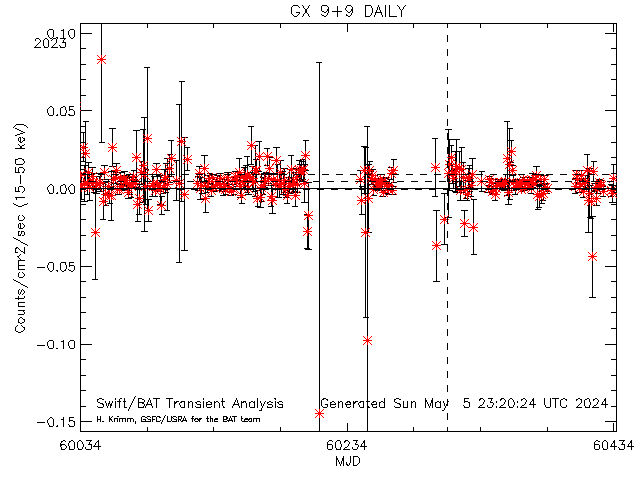
| 37 | GX 9+9 | 262.934 | -16.9620 | V2216 Oph | LMXB/NS | - | - | 28 ( 3.5) | 20 | 75 | 745 | 53788 ( 6393) |
| 38 | XTE J1855-026 | 283.877 | -2.60500 | 2MASS J18553040-0236167 | HMXB/NS | - | 41 ( 2.4) | 18 ( 2.6) | 10 | 88 | 205 | 58300 ( 1881) |
| 39 | EXO 1657-419 | 255.200 | -41.6731 | OAO 1657-415 | HMXB/NS | - | - | 24 ( 3.8) | 45 | 499 | 2957 | 56429 ( 3752) |
| 40 | Pictor A | 79.9570 | -45.7790 | NULL | Sy1/LINER | 68 ( 2.2) | - | 15 ( 4.9) | 1 | 0 | 1 | 1 ( 0) |
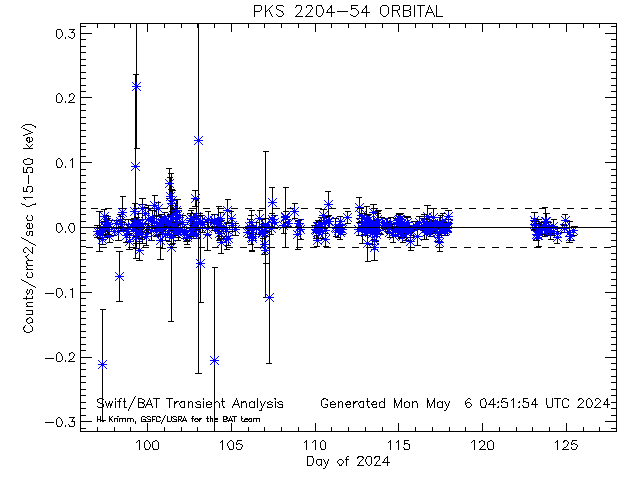
| 41 | PKS 2204-54 | 331.932 | -53.7760 | 0FGL J2207.0-5347 | Quasar | 67 ( 2.2) | - | - | 0 | 0 | 1 | 1 ( 0) |
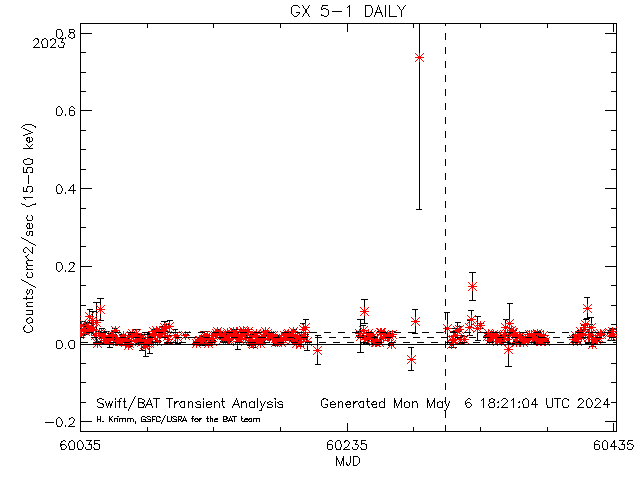
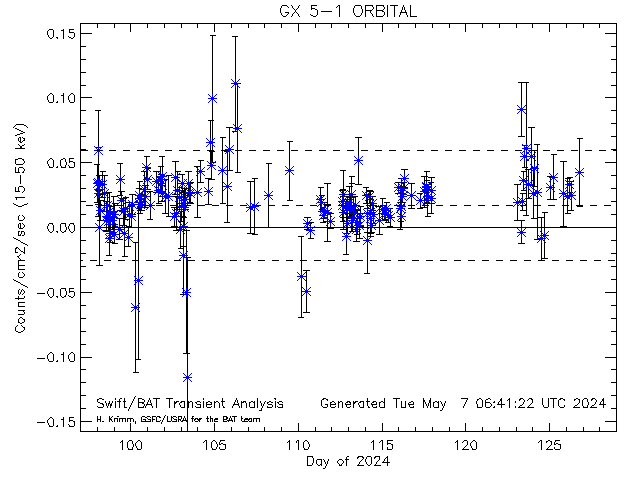
| 42 | GX 5-1 | 270.284 | -25.0780 | 4U 1758-25 | LMXB/NS | - | 95 ( 3.6) | 83 (12.7) | 70 | 279 | 430 | 60032 ( 149) |
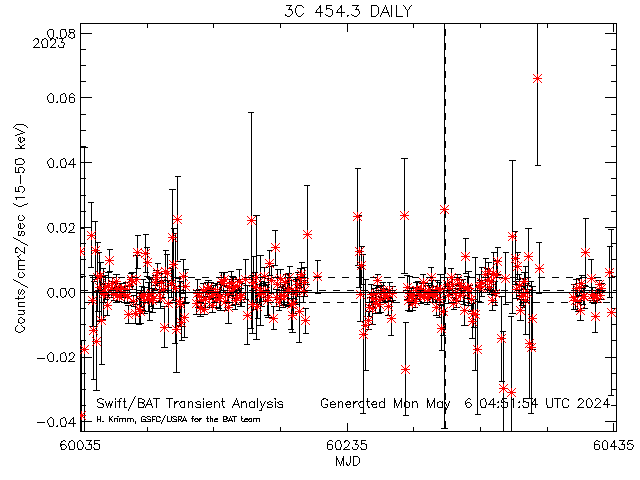
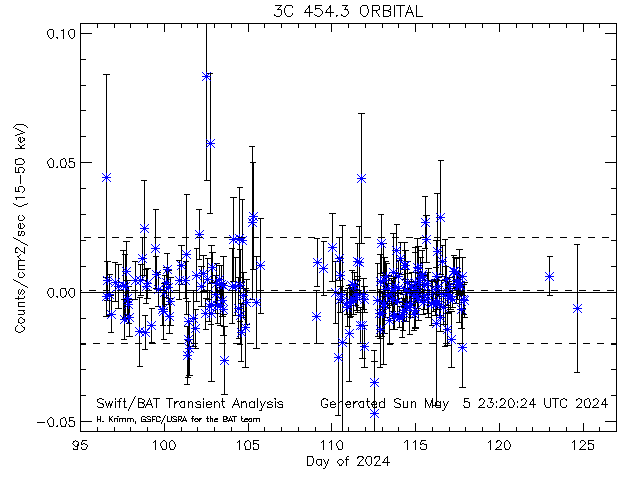
| 43 | 3C 454.3 | 343.490 | 16.1480 | Blazar | - | 42 ( 2.3) | - | 3 | 38 | 14 | 53501 ( 6680) | |
| 44 | 4U 1735-44 | 264.743 | -44.4500 | V926 Sco | LMXB/NS | - | 83 ( 3.1) | 42 ( 7.4) | 30 | 84 | 2256 | 53784 ( 6397) |
| 45 | Swift J045106.8-694803 | 72.7780 | -69.8010 | Swift J0451.5-6949 | LMC source | 59 ( 2.5) | - | - | 0 | - | - | - |
| 46 | 0FGL J1855.9+0126 | 284.038 | 1.37500 | SNR G034.6-00.5 | SNR | - | - | 18 ( 2.6) | 0 | 0 | 5 | 1 ( 0) |
| 47 | QSO B1406-074 | 212.235 | -7.87400 | NULL | Quasar | 53 ( 2.4) | - | - | 0 | 0 | 3 | 1 ( 0) |
| 48 | SMC X-1 | 19.2710 | -73.4430 | 4U 0115-73 | HMXB/NS | 53 ( 2.6) | 82 ( 9.1) | 54 (25.2) | 26 | 93 | 2429 | 56027 ( 4154) |
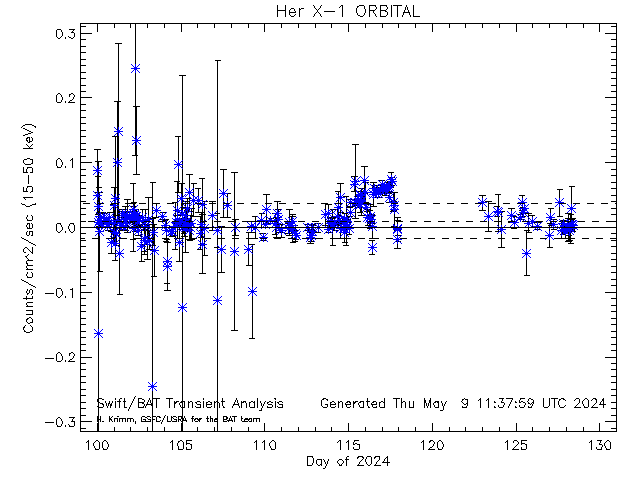
| 49 | Her X-1 | 254.457 | 35.3420 | HZ Her | LMXB/NS | - | - | 22 ( 7.5) | 35 | 388 | 2556 | 54309 ( 5872) |
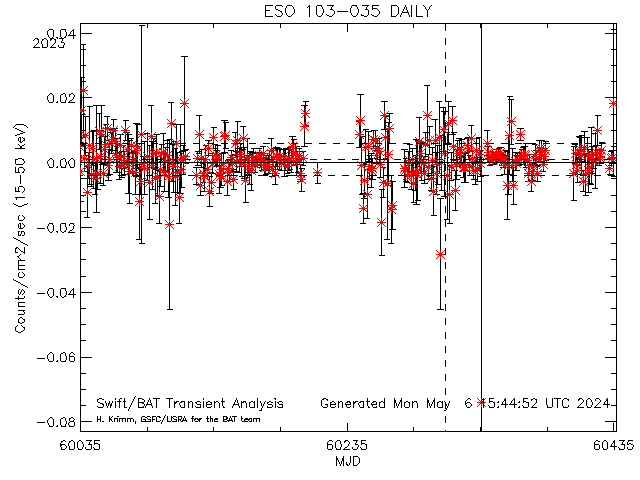
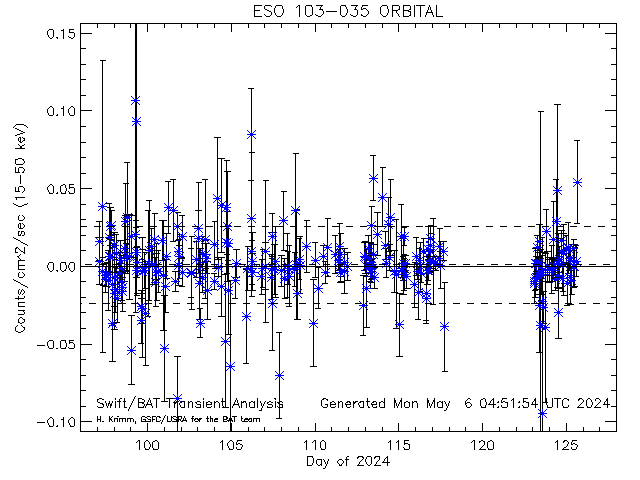
| 50 | ESO 103-035 | 279.585 | -65.4281 | Sy2 | 51 ( 2.2) | - | - | 4 | 0 | 3 | 1 ( 0) | |
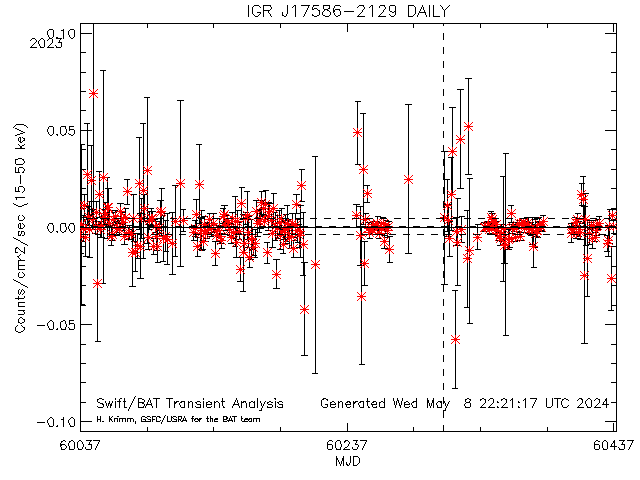
| 51 | IGR J17586-2129 | 269.644 | -21.3890 | CXOU J175834.5-212321 | HMXB | - | - | 17 ( 2.4) | 2 | 51 | 51 | 55150 ( 5031) |
| 52 | Swift J1834.9-0846 | 278.717 | -8.76600 | 0FGL J1834.4-0841 | SGR | - | - | 15 ( 2.1) | 0 | 0 | 1 | 1 ( 0) |
| 53 | LQ Hya | 143.107 | -11.1847 | NULL | BY Dra variable | - | 127 ( 2.5) | - | 0 | 0 | 1 | 1 ( 0) |
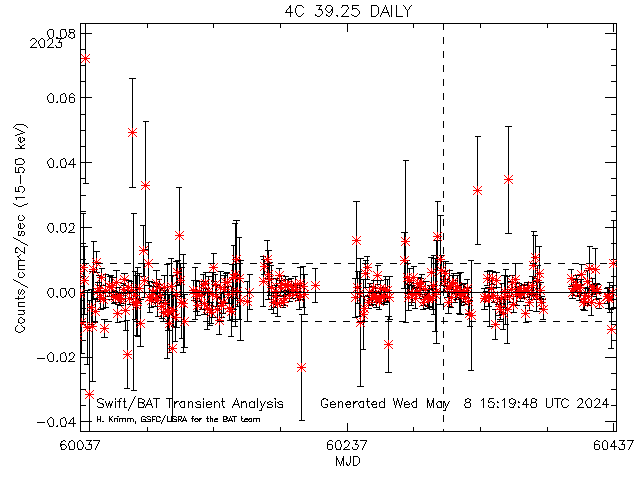
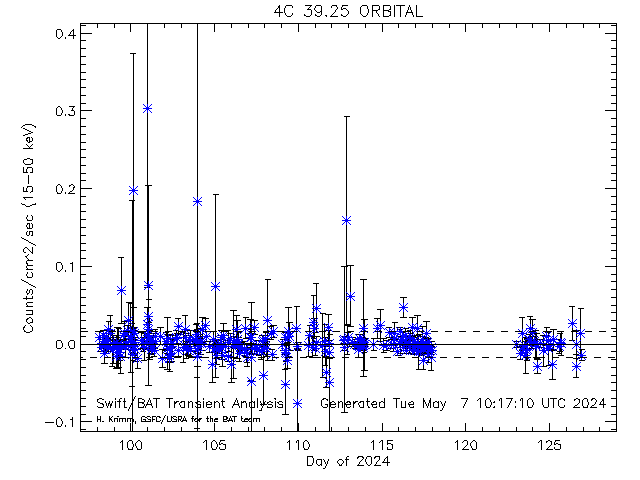
| 54 | 4C 39.25 | 141.763 | 39.0391 | ICRF J092703.0+390220 | Sy1 | - | 36 ( 3.5) | 24 ( 3.2) | 0 | - | - | - |
| 55 | NGC 4151 | 182.633 | 39.4060 | Sy1.5 | 44 ( 2.4) | 40 ( 3.2) | 34 ( 7.1) | 23 | 70 | 2490 | 57373 ( 2808) | |
| 56 | MCG +8-11-11 | 88.7230 | 46.4390 | UGC 3374 | Sy1.5 | - | - | 19 ( 4.2) | 5 | 35 | 21 | 54269 ( 5912) |
| 57 | QSO B0808+019 | 122.861 | 1.78117 | BL Lac | - | - | 22 ( 2.9) | 0 | - | - | - | |
| 58 | V826 Cas | 8.76146 | 61.3173 | Variable star | 41 ( 2.5) | - | 7 ( 2.4) | 0 | 0 | 1 | 1 ( 0) | |
| 59 | QSO J1130-1449 | 172.529 | -14.8243 | PKS 1127-14 | Blazar | - | - | 17 ( 2.9) | 0 | 0 | 1 | 1 ( 0) |
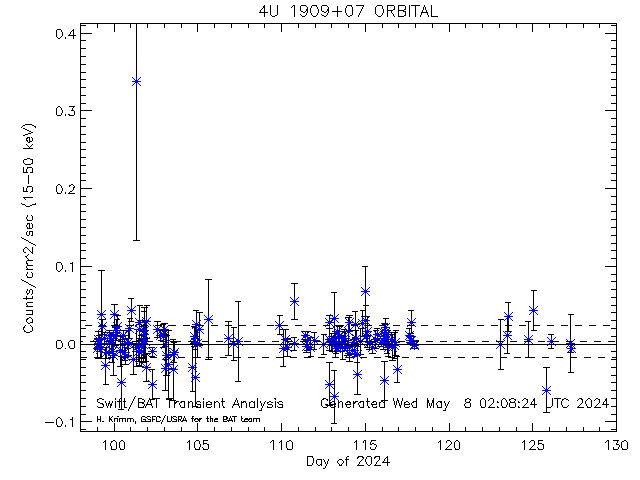
| 60 | 4U 1909+07 | 287.701 | 7.59800 | 4U 1908+075 | HMXB/NS | - | - | 16 ( 2.5) | 14 | 75 | 284 | 55151 ( 5030) |
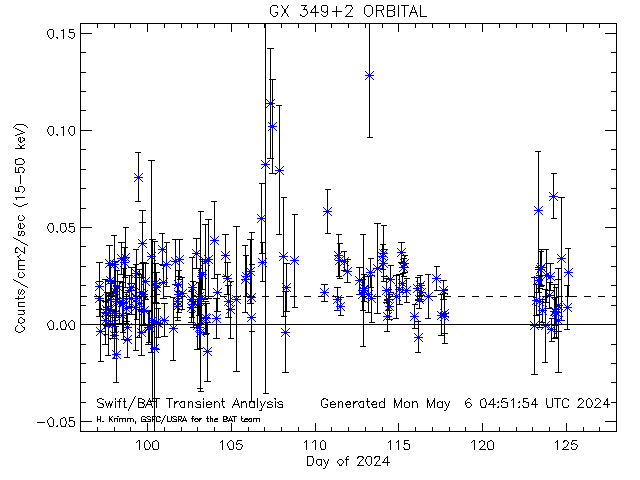
| 61 | GX 349+2 | 256.435 | -36.4230 | V1101 Sco | LMXB/NS | - | - | 80 (11.9) | 74 | 201 | 4839 | 53623 ( 6558) |
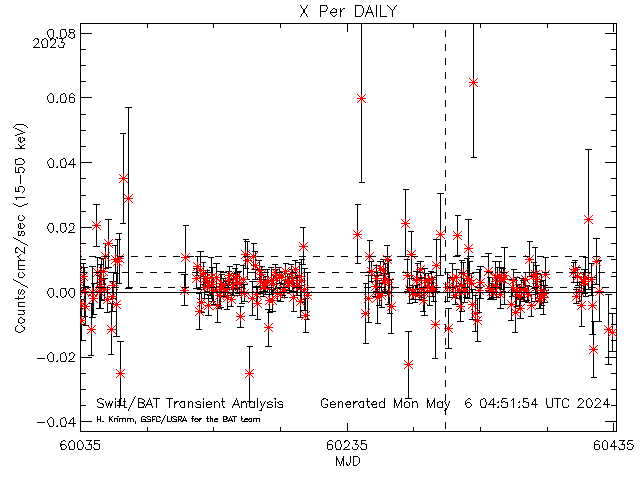
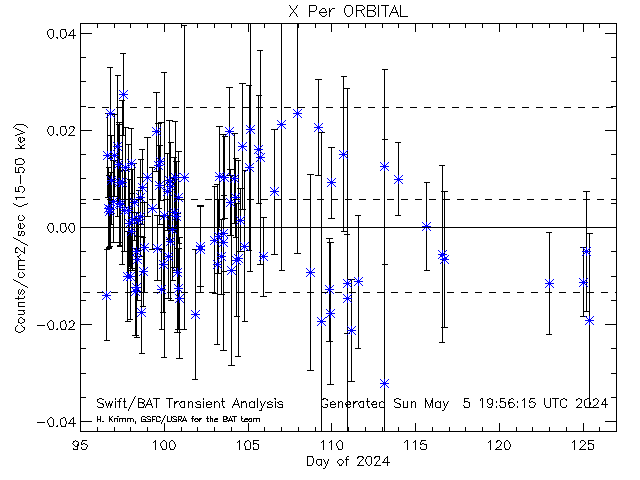
| 62 | X Per | 58.8460 | 31.0460 | 4U 0352+309 | HMXB/NS | - | - | 12 ( 2.7) | 28 | 90 | 1686 | 55194 ( 4987) |
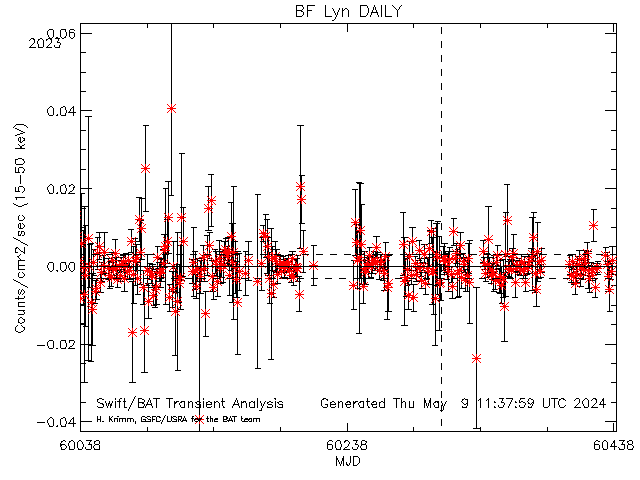
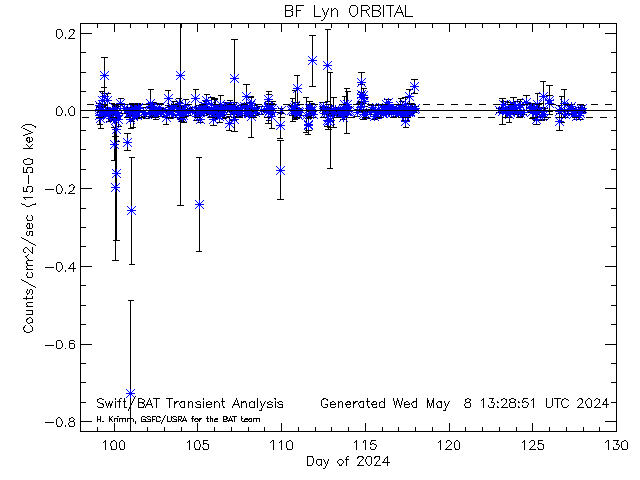
| 63 | BF Lyn | 140.608 | 40.2011 | NULL | BY Dra variable | - | 39 ( 4.0) | 18 ( 2.7) | 0 | 0 | 2 | 1 ( 0) |
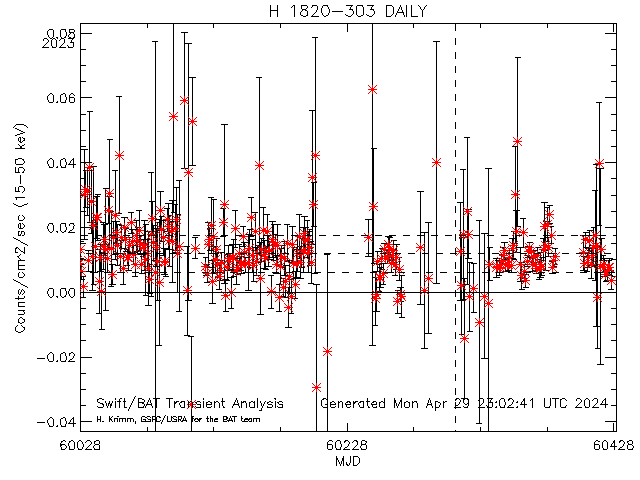
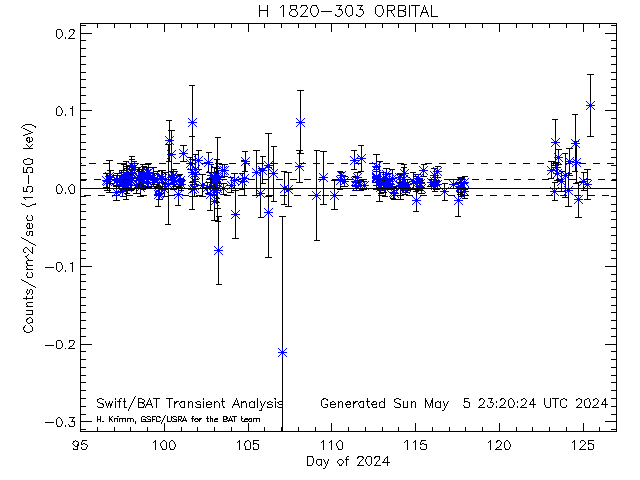
| 64 | H 1820-303 | 275.919 | -30.3610 | 4U 1820-30 | LMXB/NS | - | - | 49 ( 8.4) | 55 | 168 | 4156 | 54986 ( 5195) |
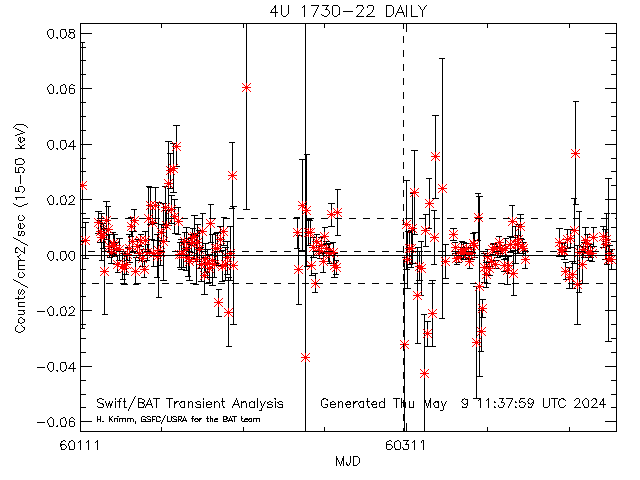
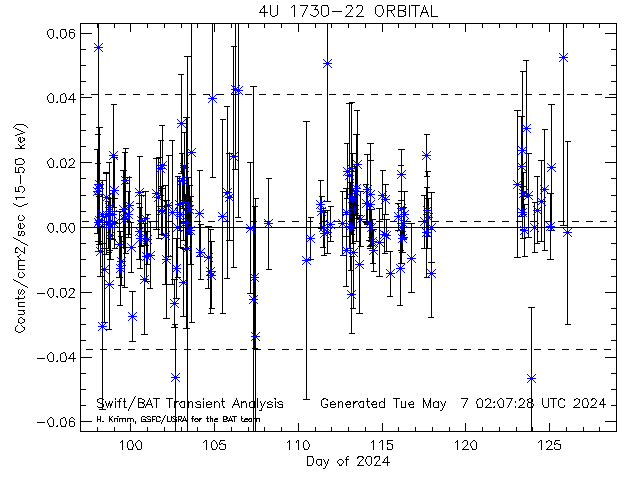
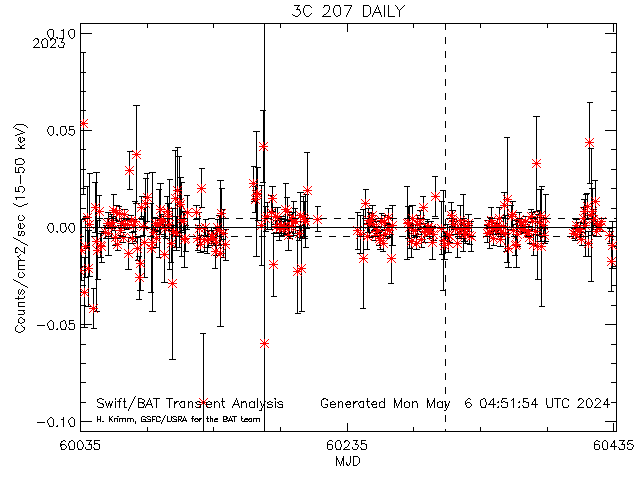
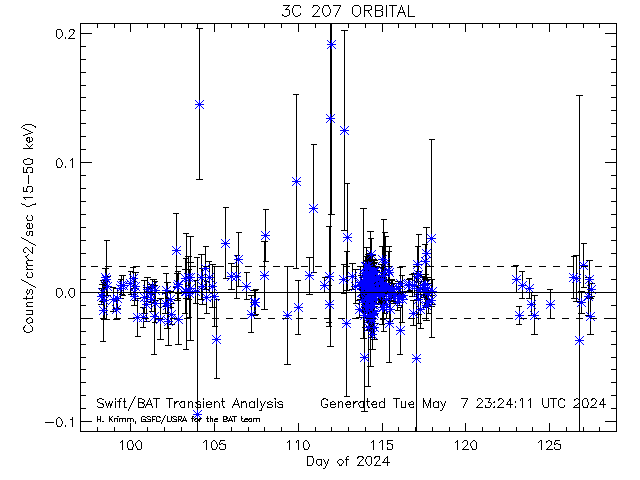
| 65 | 4U 1730-22 | 263.487 | -22.0353 | NULL | NULL | - | - | 32 ( 4.2) | 19 | 0 | 1 | 1 ( 0) |
| 66 | 1RXS J175113.3-201214 | 267.806 | -20.2040 | X-ray source | - | - | 16 ( 2.2) | 0 | 0 | 1 | 1 ( 0) | |
| 67 | QSO B2136+1410 | 324.755 | 14.3933 | OX 161 | Quasar | - | - | 15 ( 2.4) | 0 | 0 | 2 | 1 ( 0) |
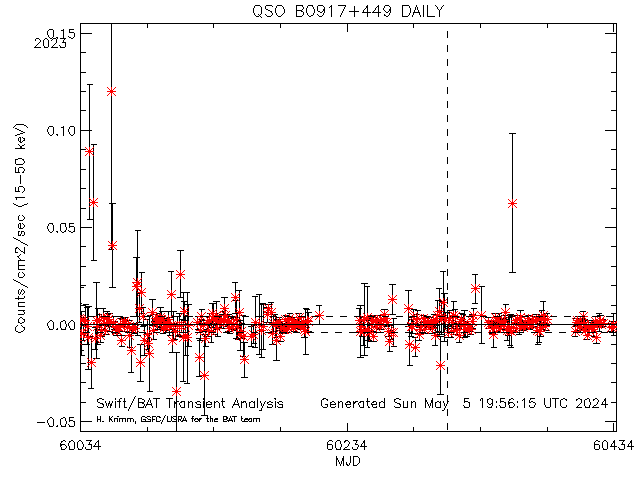
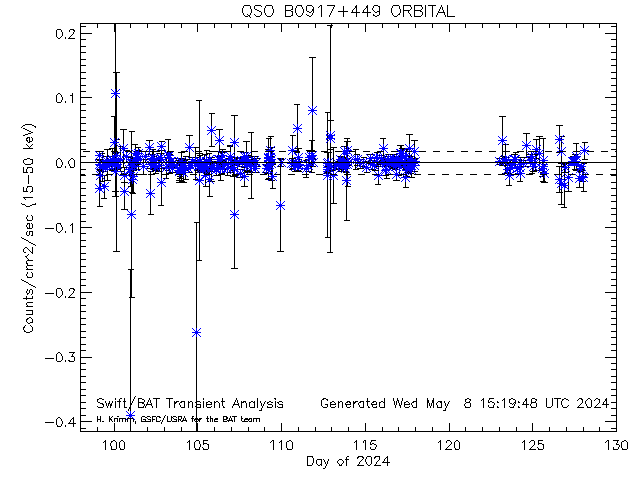
| 68 | QSO B0917+449 | 140.243 | 44.6980 | NULL | Quasar | - | 39 ( 4.1) | 18 ( 2.7) | 0 | 0 | 1 | 1 ( 0) |
| 69 | NGC 262 | 12.1964 | 31.9570 | Mrk 348 | Sy2 | - | - | 14 ( 3.4) | 5 | 0 | 14 | 1 ( 0) |
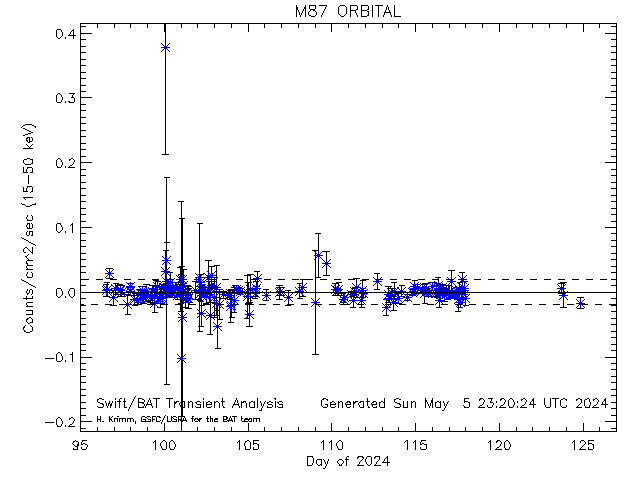
| 70 | M87 | 187.706 | 12.3911 | M87 | AGN | - | - | 12 ( 2.2) | 0 | - | - | - |
| 71 | 3C 207 | 130.198 | 13.2060 | 2MASS J08404758+1312238 | Sy1 | - | - | 36 ( 2.7) | 0 | 0 | 1 | 1 ( 0) |
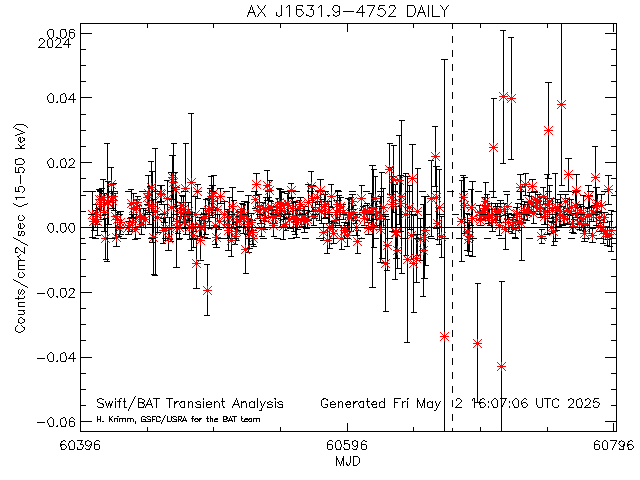
| 72 | AX J1631.9-4752 | 248.008 | -47.8740 | HESS J1632-478 | HMXB/NS | - | - | 20 ( 3.8) | 18 | 517 | 788 | 58508 ( 1673) |
| 73 | PKS 2144+092 | 326.792 | 9.49600 | 0FGL J2147.1+0931 | Quasar | - | - | 22 ( 3.3) | 0 | 0 | 1 | 1 ( 0) |
| 74 | GX 301-2 | 186.657 | -62.7700 | BP Cru | HMXB/NS | - | 112 (11.9) | 98 (31.3) | 106 | 1637 | 5438 | 54568 ( 5613) |
| 75 | XB 1732-304 | 263.950 | -30.4830 | 1RXS J173546.9-302859 | LMXB | - | - | 14 ( 2.1) | 0 | 0 | 2 | 1 ( 0) |
| 76 | Cyg X-3 | 308.107 | 40.9580 | V1521 Cyg | HMXB | - | 132 (11.0) | 116 (33.1) | 118 | 393 | 5449 | 60104 ( 77) |
| 77 | Cyg X-2 | 326.172 | 38.3220 | V1341 Cyg | LMXB/NS | - | 57 ( 4.8) | 41 (11.6) | 38 | 86 | 3571 | 59144 ( 1037) |
| 78 | 4U 1822-371 | 276.445 | -37.1053 | V691 CrA | LMXB/NS | - | - | 41 ( 7.4) | 33 | 56 | 59 | 59632 ( 549) |
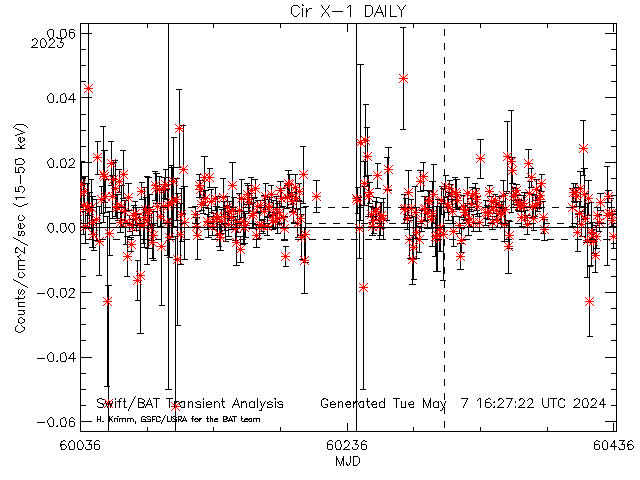
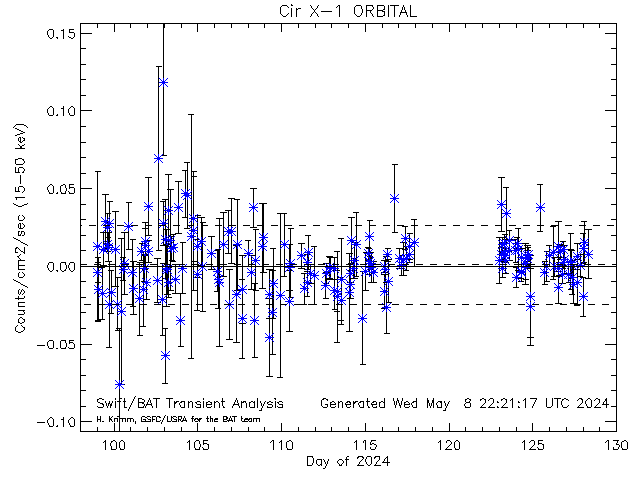
| 79 | Cir X-1 | 230.170 | -57.1670 | BR Cir | HMXB/NS | - | 29 ( 2.4) | 16 ( 4.5) | 22 | 51 | 24 | 59492 ( 689) |
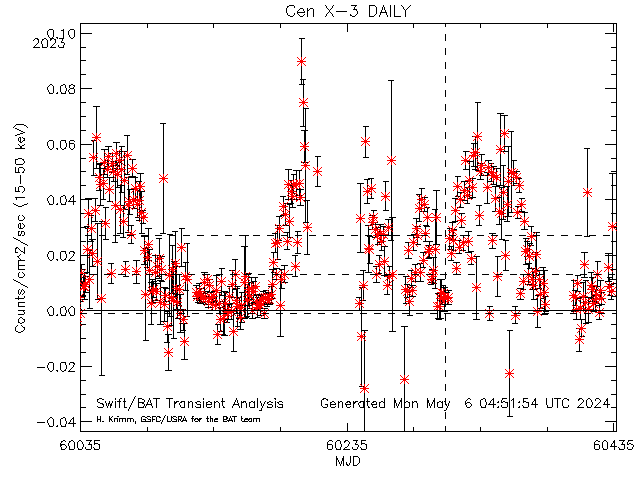
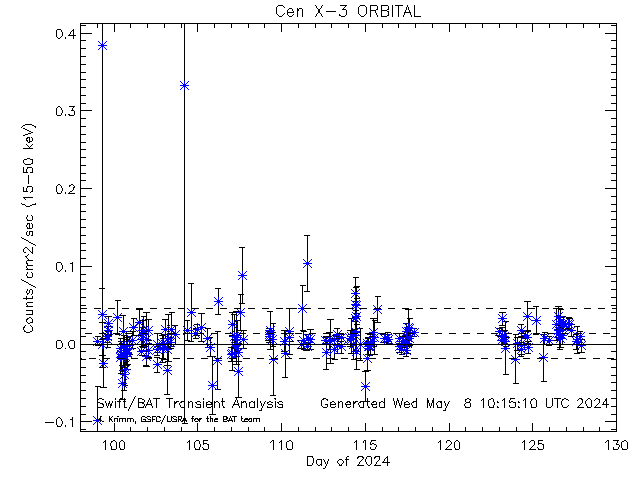
| 80 | Cen X-3 | 170.313 | -60.6230 | V779 Cen | HMXB/NS | 19 ( 2.1) | 21 ( 2.3) | 14 ( 5.0) | 60 | 362 | 4036 | 58444 ( 1737) |
| 81 | EXO 2030+375 | 308.064 | 37.6370 | V2246 Cyg | HMXB/NS | - | - | 21 ( 6.2) | 22 | 1225 | 1717 | 53957 ( 6224) |
| 82 | Fermi_J0910-5041 | 137.690 | -50.7400 | NULL | Gamma-ray source | - | - | 14 ( 3.9) | 0 | - | - | - |
| 83 | IGR J16318-4848 | 247.949 | -48.8190 | MSX6C G335.6164-00.4479 | HMXB/NS | - | - | 18 ( 3.7) | 23 | 185 | 61 | 59763 ( 418) |
| 84 | ESO 97- 13 | 213.291 | -65.3390 | Circ galaxy | Sy2 | - | - | 13 ( 4.1) | 12 | 33 | 88 | 53597 ( 6584) |
| 85 | 1E 1145.1-6141 | 176.869 | -61.9540 | Swift J1147.2-6156B | HMXB/NS | - | 44 ( 4.7) | 19 ( 6.2) | 18 | 176 | 772 | 54546 ( 5635) |
| 86 | MCG -5-23-16 | 146.917 | -30.9490 | ESO 434-40 | Sy2 | - | - | 19 ( 3.5) | 9 | 38 | 61 | 55075 ( 5106) |
| 87 | GX 1+4 | 263.009 | -24.7460 | V2116 Oph | LMXB/NS | - | - | 30 ( 4.6) | 46 | 369 | 3275 | 60046 ( 135) |
| 88 | NGC 4945 | 196.363 | -49.4680 | Sy2 | - | - | 17 ( 5.7) | 7 | 0 | 23 | 1 ( 0) | |
| 89 | IGR J01363+6610 | 24.0750 | 66.1750 | [KRL2007b] 14 | HMXB | - | - | 12 ( 4.1) | 0 | 0 | 4 | 1 ( 0) |
| 90 | AT2019wey | 68.8370 | 55.3740 | NULL | NULL | - | 36 ( 2.8) | 17 ( 5.3) | 41 | 141 | 348 | 60015 ( 166) |
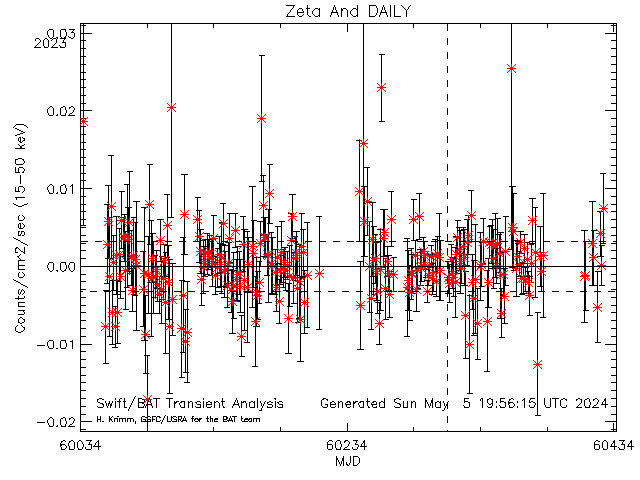
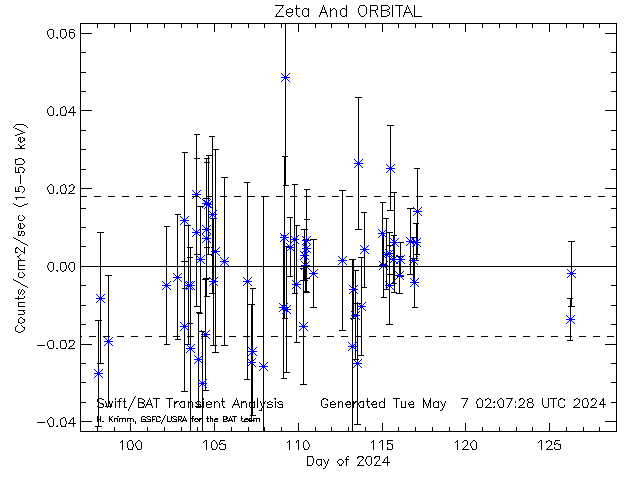
| 91 | Zeta And | 11.8346 | 24.2672 | NULL | Beta Lyra binary | - | - | 14 ( 3.1) | 0 | 43 | 3 | 53785 ( 6396) |
| 92 | 4U 1636-536 | 250.231 | -53.7510 | V801 Ara | LMXB/NS | - | 73 ( 4.0) | 48 (11.0) | 32 | 180 | 2379 | 60114 ( 67) |
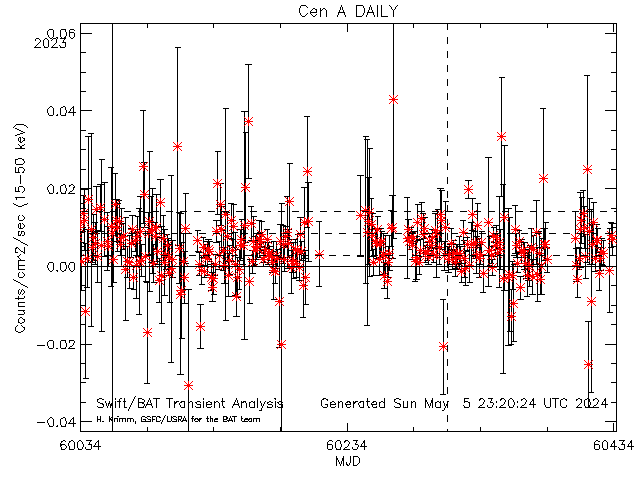
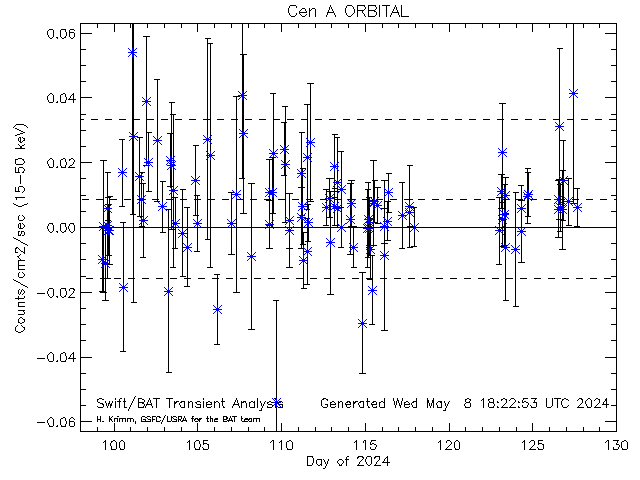
| 93 | Cen A | 201.365 | -43.0191 | Sy2 | - | - | 18 ( 6.0) | 39 | 151 | 2316 | 55088 ( 5093) | |
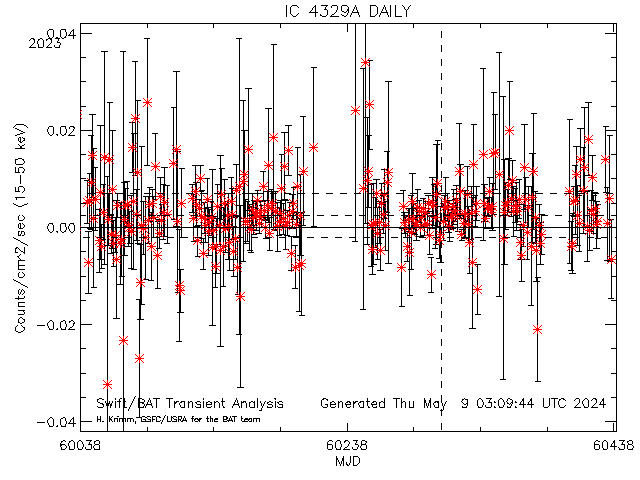
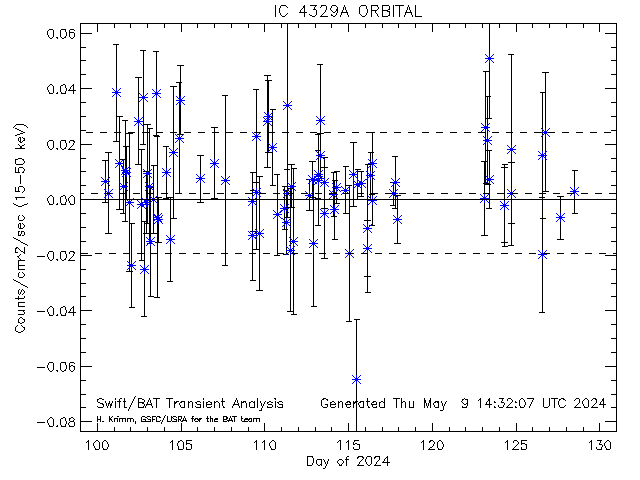
| 94 | IC 4329A | 207.330 | -30.3090 | ESO 445-50 | Sy1.2 | - | - | 14 ( 4.2) | 11 | 0 | 57 | 1 ( 0) |
| 95 | XTE J1856+053 | 284.163 | 5.33000 | INTREF 948 | LMXB/BHC | - | - | 15 ( 2.2) | 0 | 69 | 17 | 54253 ( 5928) |
| 96 | PKS 0347-211 | 57.4910 | -21.0470 | 0FGL J0349.8-2102 | Quasar | - | - | 12 ( 3.4) | 0 | 0 | 1 | 1 ( 0) |
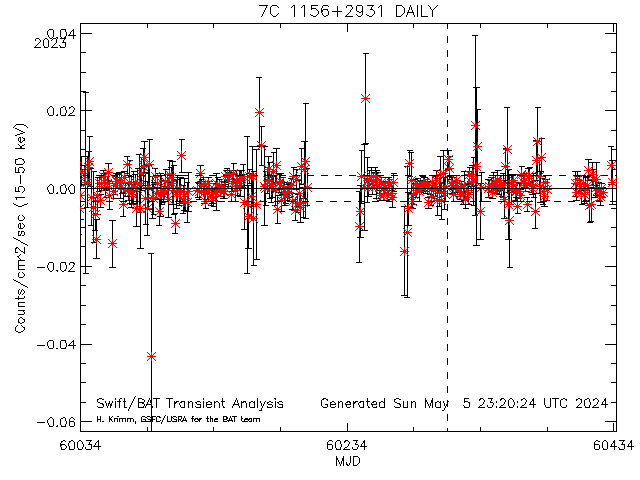
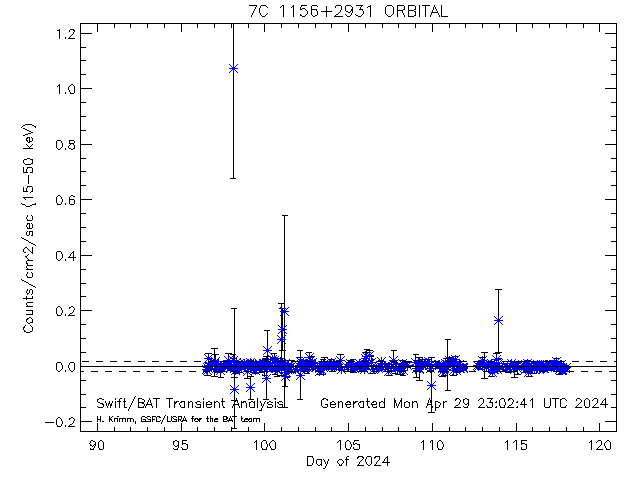
| 97 | 7C 1156+2931 | 179.883 | 29.2455 | 4C 29.45 | Quasar | - | - | 14 ( 2.1) | 0 | 0 | 2 | 1 ( 0) |
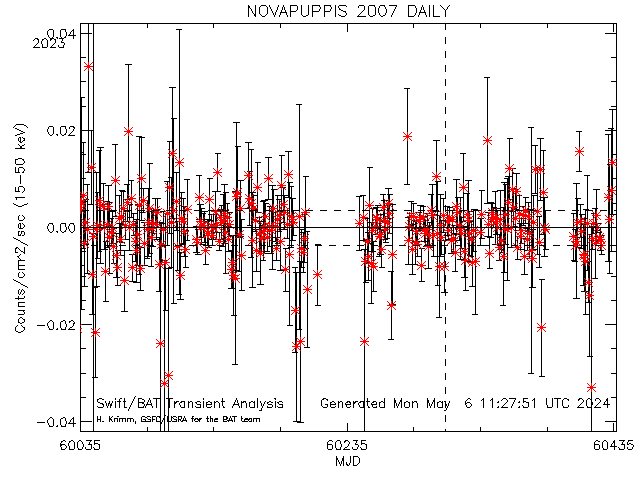
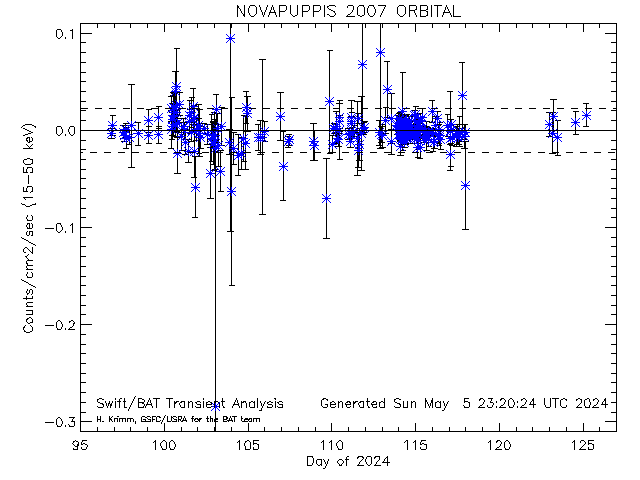
| 98 | NOVAPUPPIS 2007 | 124.075 | -34.2570 | NULL | Nova | - | 47 ( 2.4) | - | 0 | - | - | - |
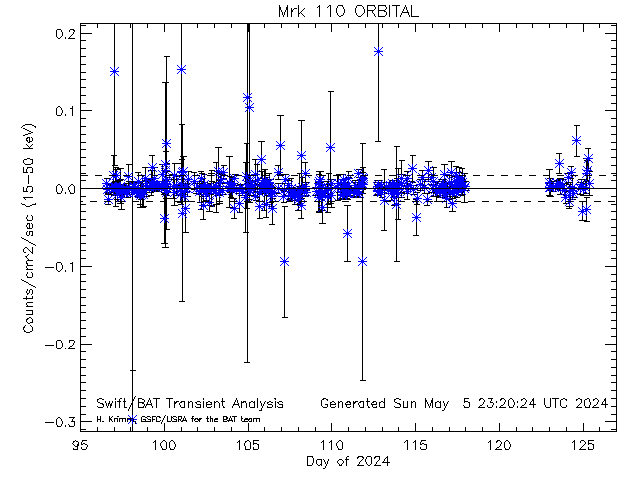
| 99 | Mrk 110 | 141.304 | 52.2863 | Sy1 | - | - | 14 ( 2.9) | 2 | 0 | 1 | 1 ( 0) | |
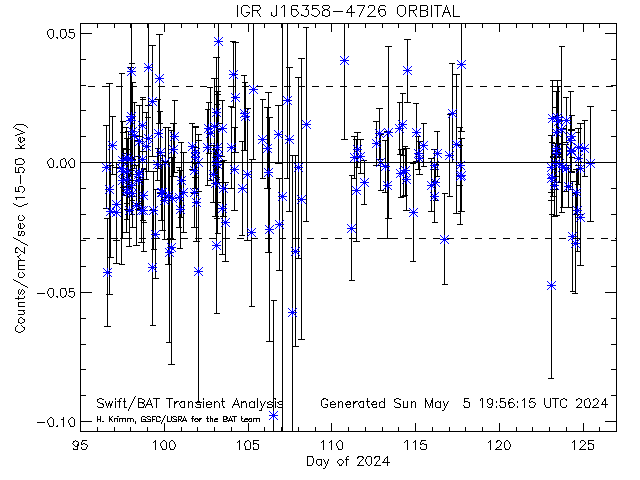
| 100 | IGR J16358-4726 | 248.974 | -47.4280 | IGR16358-4726 | X-ray source | - | - | 18 ( 2.6) | 0 | - | - | - |
| 101 | RX J1117.1+2014 | 169.276 | 20.2353 | 2MASS J11170625+2014073 | BL Lac | - | - | 33 ( 2.7) | 0 | 70 | 3 | 53786 ( 6395) |
| 102 | Ginga 1826-238 | 277.368 | -23.7970 | V4634 Sgr | LMXB/NS | - | - | 16 ( 2.6) | 9 | - | - | - |
| 103 | NGC 3281 | 157.967 | -34.8537 | Sy2 | - | - | 13 ( 2.9) | 3 | 0 | 3 | 1 ( 0) | |
| 104 | 4U 0614+09 | 94.2800 | 9.13700 | V1055 Ori | LMXB/NS | - | 23 ( 2.1) | 25 ( 5.6) | 20 | 57 | 724 | 55366 ( 4815) |
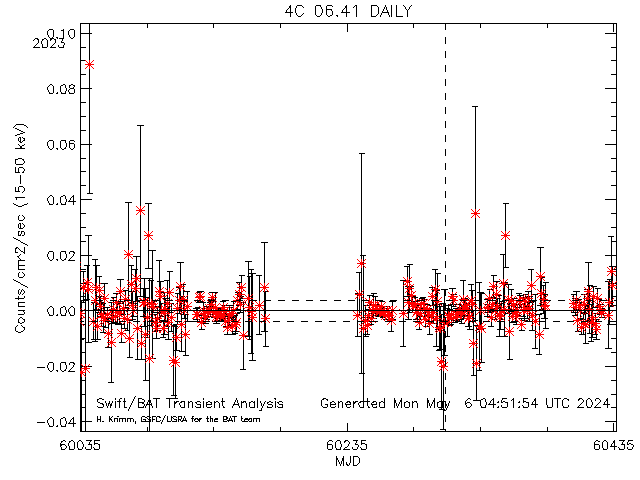
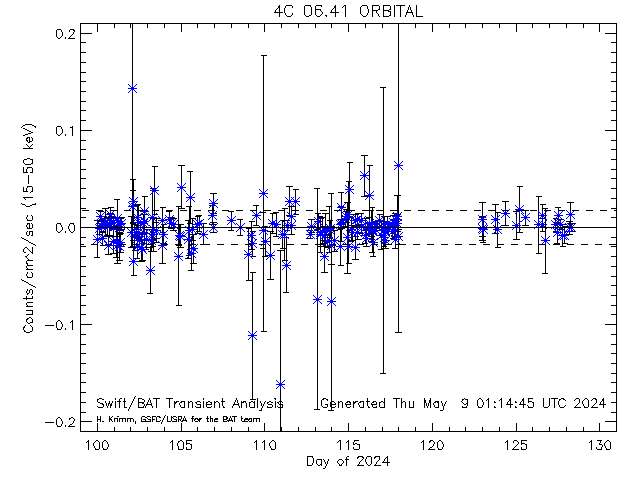
| 105 | 4C 06.41 | 160.322 | 6.17137 | Quasar | - | - | 17 ( 2.1) | 0 | 0 | 1 | 1 ( 0) | |
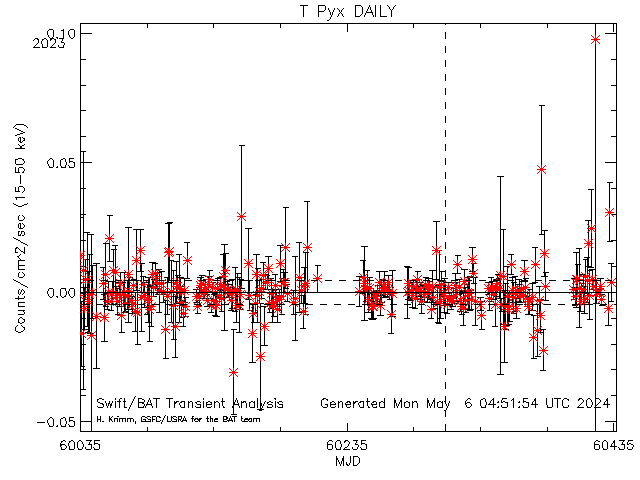
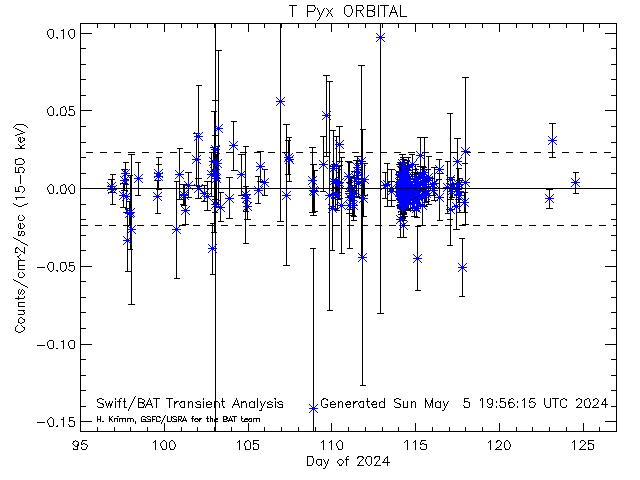
| 106 | T Pyx | 136.173 | -32.3800 | NULL | NULL | - | 43 ( 2.1) | - | 0 | - | - | - |
| 107 | SWIFT J0746.6-2725 | 116.654 | -27.4240 | NULL | NULL | - | - | 13 ( 2.5) | 0 | - | - | - |
| 108 | 4U 1957+115 | 299.851 | 11.7090 | V1408 Aql | LMXB | - | 40 ( 2.9) | - | 1 | 32 | 6 | 55636 ( 4545) |
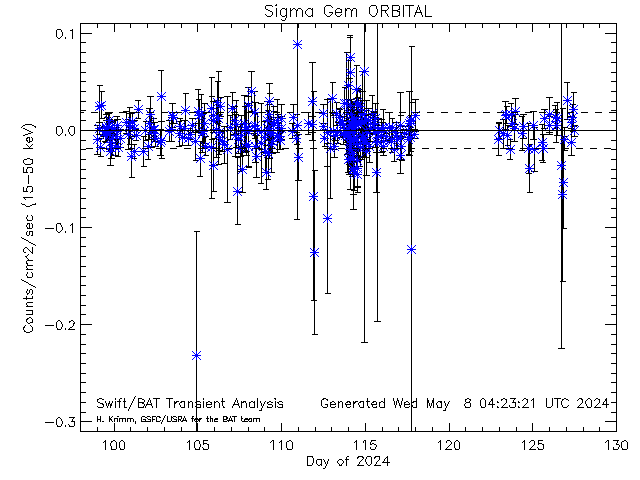
| 109 | Sigma Gem | 115.828 | 28.8836 | NULL | RS CVn variable | - | - | 15 ( 2.2) | 0 | - | - | - |
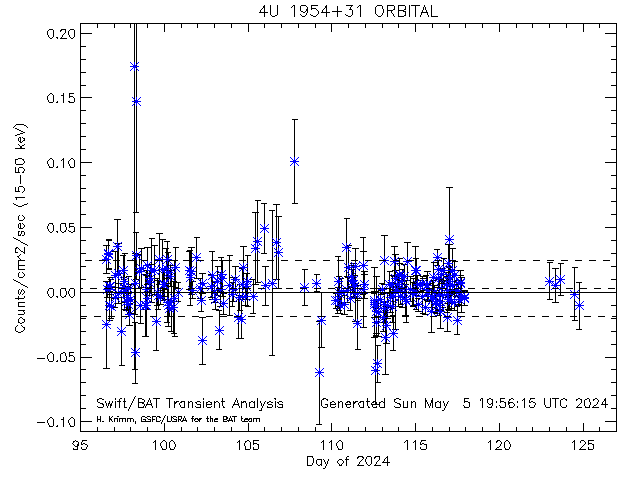
| 110 | 4U 1954+31 | 298.926 | 32.0970 | HMXB/NS | - | 24 ( 2.1) | 16 ( 4.3) | 13 | 198 | 629 | 54779 ( 5402) | |
| 111 | RS Oph | 267.555 | -6.70800 | NOVA Oph 1898 | Nova | - | - | 13 ( 2.0) | 0 | 0 | 4 | 1 ( 0) |
| 112 | NGC 4593 | 189.914 | -5.34425 | Sy1 | - | - | 14 ( 3.0) | 2 | 0 | 4 | 1 ( 0) | |
| 113 | SWIFT J1943.4+0228 | 295.892 | 2.46500 | NULL | NULL | - | - | 17 ( 2.4) | 0 | - | - | - |
| 114 | V5856 Sgr | 275.218 | -28.3700 | NULL | NULL | - | 50 ( 2.5) | - | 0 | - | - | - |
| 115 | IGR J19140+0951 | 288.518 | 9.88300 | [KRL2007b] 359 | HMXB/NS | - | - | 16 ( 2.9) | 7 | 80 | 214 | 54696 ( 5485) |
| 116 | QSO B1011+496 | 153.767 | 49.4335 | 1ES 1011+496 | BL Lac | - | - | 12 ( 2.4) | 0 | 0 | 1 | 1 ( 0) |
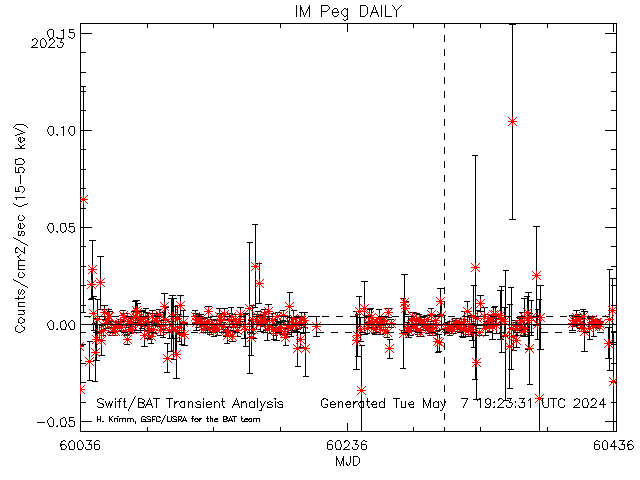
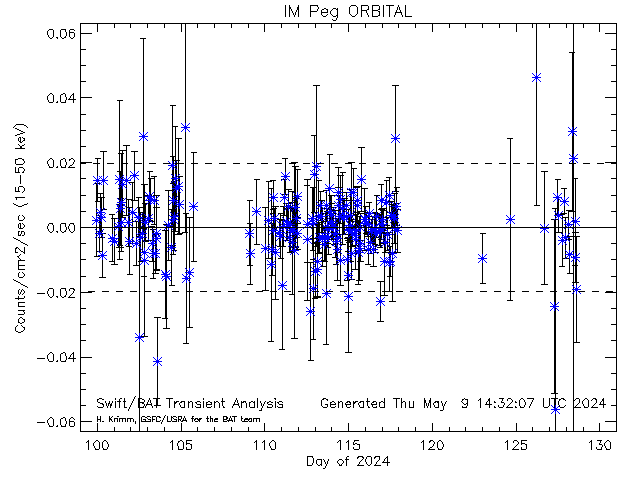
| 117 | IM Peg | 343.260 | 16.8411 | NULL | RS CVn variable | - | - | 12 ( 2.5) | 0 | - | - | - |
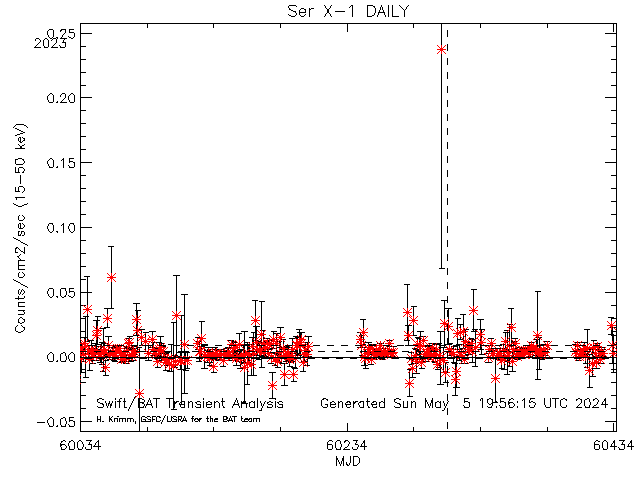
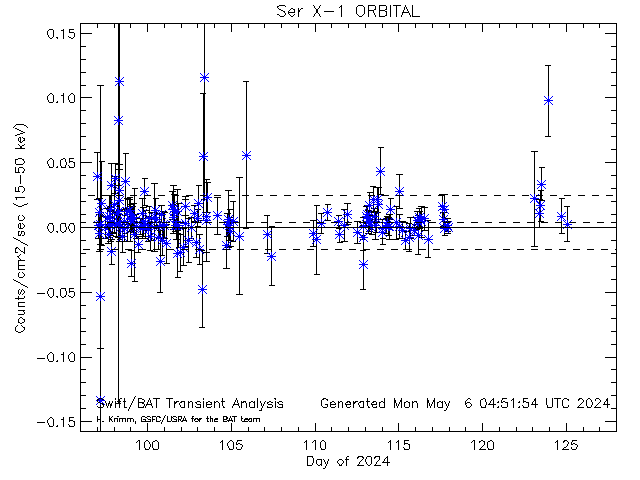
| 118 | Ser X-1 | 279.990 | 5.03600 | MM Ser | LMXB/NS | - | - | 26 ( 4.0) | 18 | 46 | 464 | 56773 ( 3408) |
| 119 | SAX J1750.8-2900 | 267.602 | -29.0380 | SAX1750.8-2900 | LMXB/NS | - | 58 ( 2.2) | 15 ( 2.3) | 1 | 90 | 90 | 54583 ( 5598) |
| 120 | SLX 1746-331 | 267.452 | -33.2051 | RX J1749.8-3312 | LMXB | - | - | 20 ( 3.0) | 0 | 0 | 1 | 1 ( 0) |
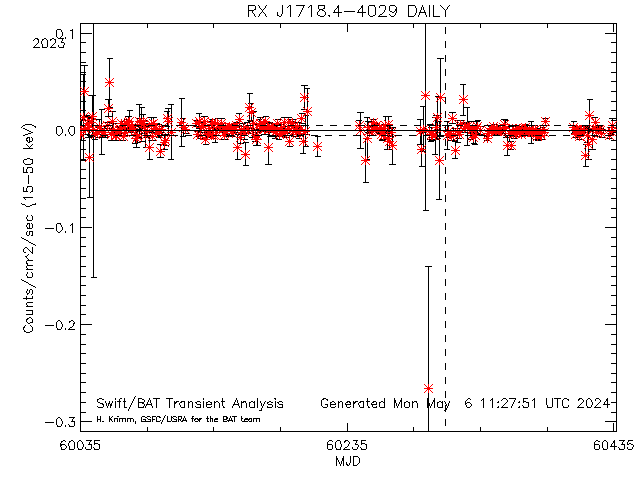
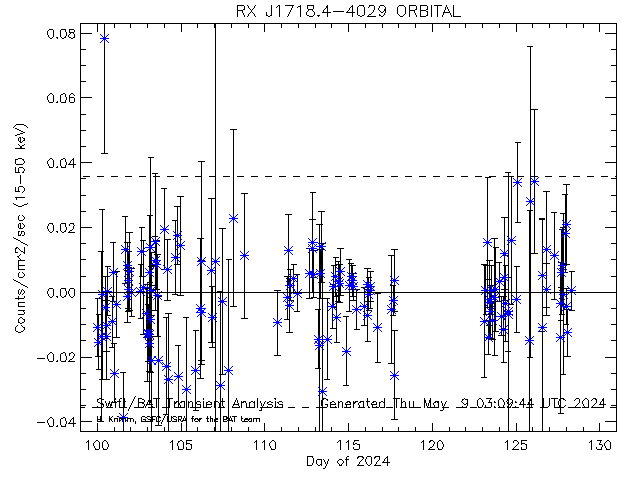
| 121 | RX J1718.4-4029 | 259.601 | -40.4930 | 1RXS J171824.2-402934 | LMXB | - | - | 17 ( 2.5) | 0 | 0 | 1 | 1 ( 0) |
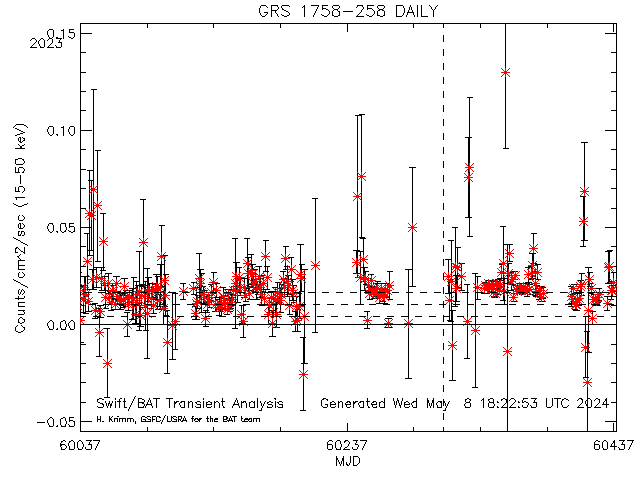
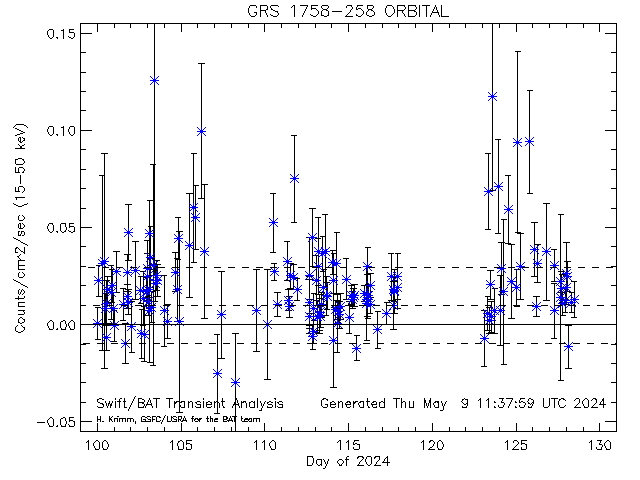
| 122 | GRS 1758-258 | 270.302 | -25.7430 | 1RXS J180112.6-254435 | LMXB/BHC | - | 112 ( 4.2) | 83 (13.0) | 60 | 150 | 331 | 60018 ( 163) |
| 123 | IGR J20188+3647 | 304.700 | 36.7920 | NULL | X-ray source | - | - | 12 ( 3.2) | 0 | 0 | 2 | 1 ( 0) |
| 124 | GRS 1724-308 | 261.889 | -30.8020 | 4U 1722-30 | LMXB/NS | - | - | 18 ( 2.6) | 17 | 67 | 593 | 54515 ( 5666) |
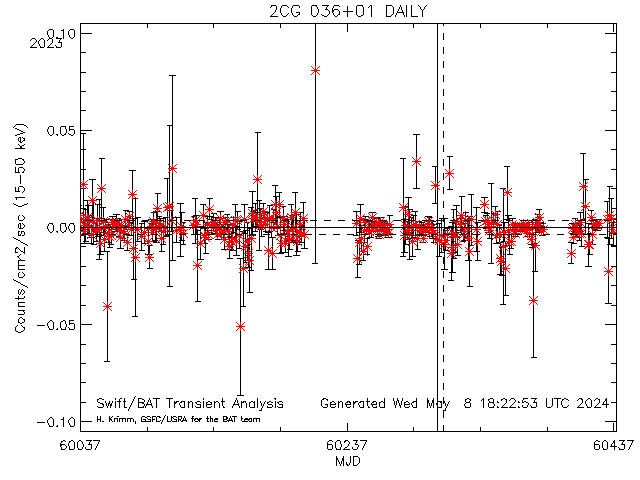
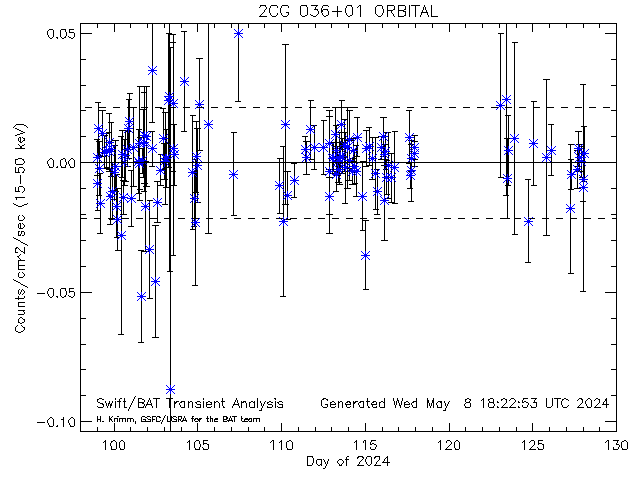
| 125 | 2CG 036+01 | 283.120 | 3.86700 | Gamma-ray source | - | - | 19 ( 2.8) | 0 | 0 | 3 | 1 ( 0) | |
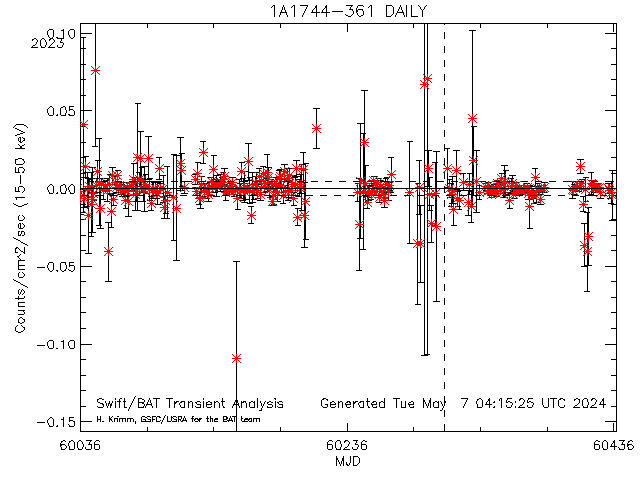
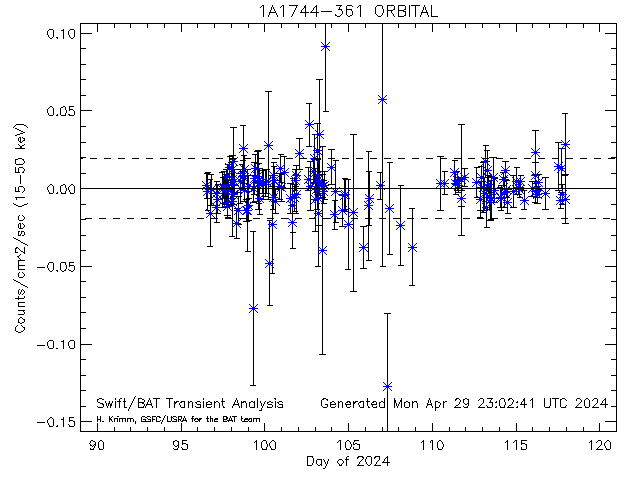
| 126 | 1A1744-361 | 267.080 | -36.1210 | [KRL2007b] 281 | LMXB | - | - | 14 ( 2.2) | 0 | 0 | 9 | 1 ( 0) |
| 127 | IGR J18410-0535 | 280.252 | -5.59600 | AX J1841.0-0535 | HMXB | - | 46 ( 2.5) | - | 0 | 38 | 11 | 56092 ( 4089) | Source Name | RA J2000 Degs | Dec J2000 Degs | Alternate Name | Source Type | Today# | Yesterday# | Tenday# | Mean* | Peak* | Days* | Last Day* |
* Explanation of last four table headings:
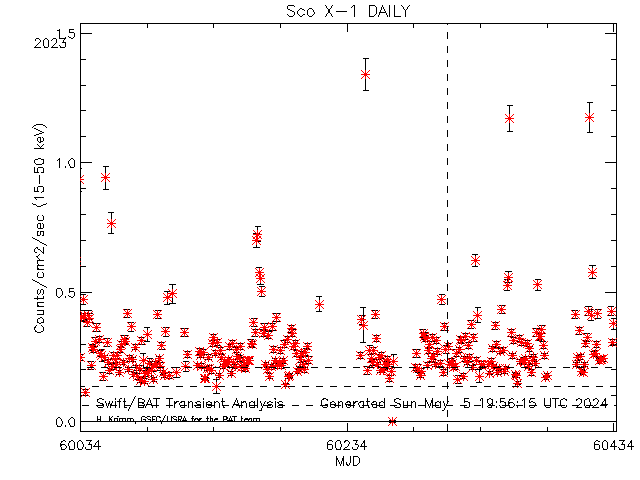
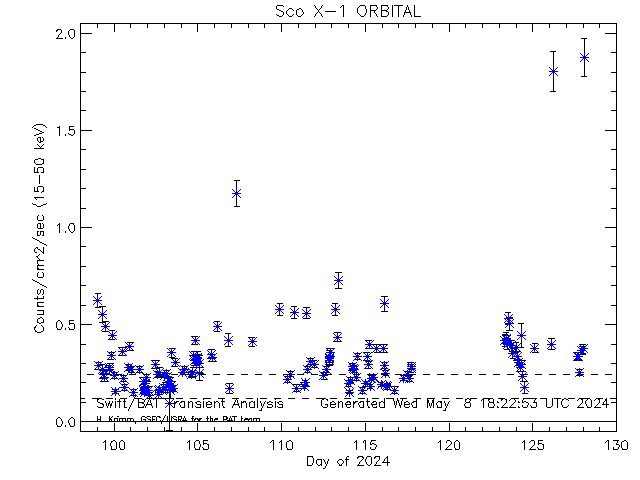
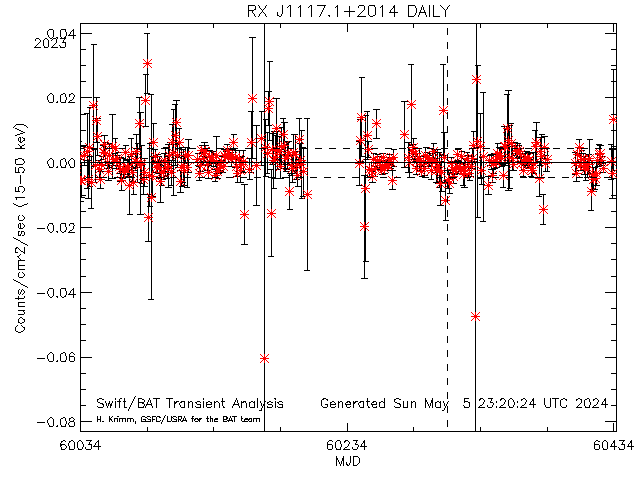
Dashed lines show average rate (and +/- 1 sigma standard deviation) for this source (derived from this plot)
[10003] Sco X-1 RA= 244.979 degs; Dec= -15.6400 degs
Daily light curves: FITS version ASCII version
Orbit light curves: FITS version ASCII version
Full mission light curve
-------------------------------------------------------------------------------------------------------------------------------------------------------------------
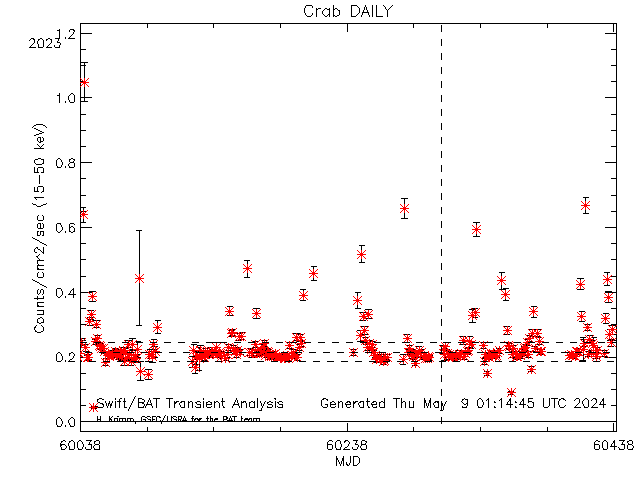
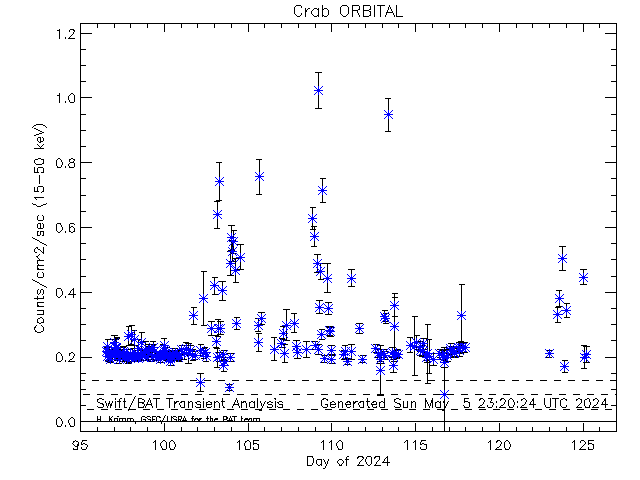
Dashed lines show average rate (and +/- 1 sigma standard deviation) for this source (derived from this plot)
[10001] Crab RA= 83.6330 degs; Dec= 22.0150 degs
Daily light curves: FITS version ASCII version
Orbit light curves: FITS version ASCII version
Full mission light curve
-------------------------------------------------------------------------------------------------------------------------------------------------------------------
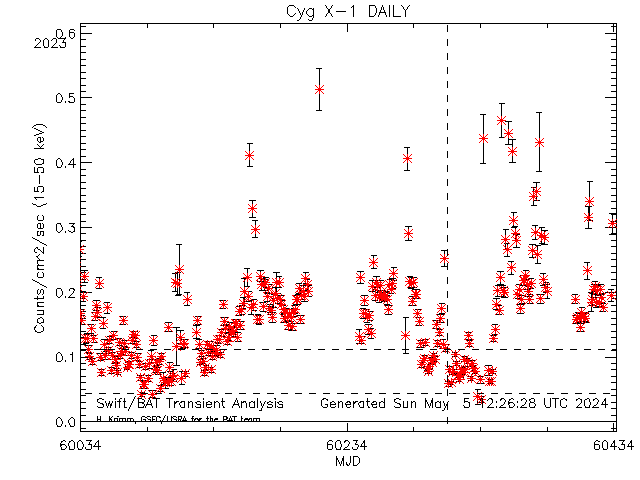
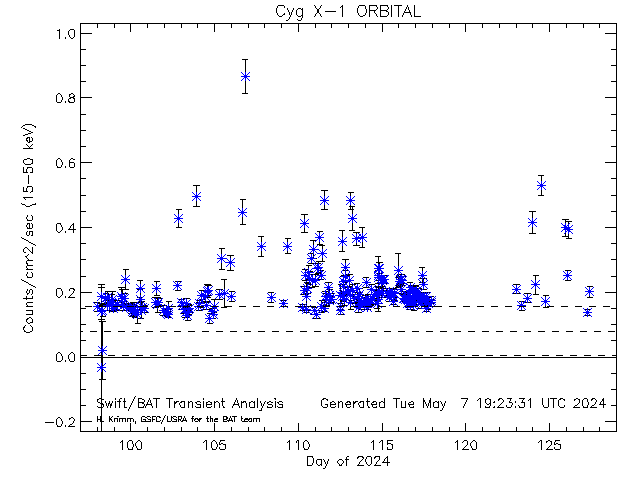
Dashed lines show average rate (and +/- 1 sigma standard deviation) for this source (derived from this plot)
[10002] Cyg X-1 RA= 299.591 degs; Dec= 35.2020 degs
Daily light curves: FITS version ASCII version
Orbit light curves: FITS version ASCII version
Full mission light curve
-------------------------------------------------------------------------------------------------------------------------------------------------------------------
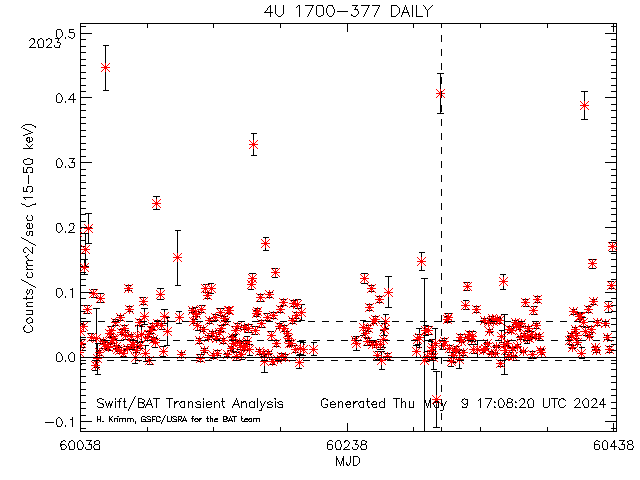
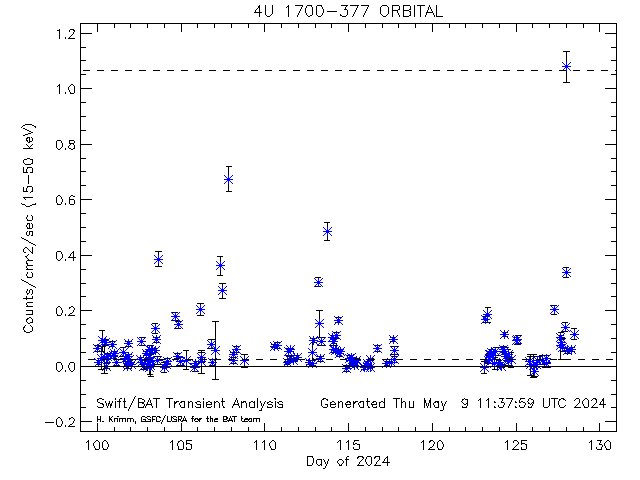
Dashed lines show average rate (and +/- 1 sigma standard deviation) for this source (derived from this plot)
[10029] 4U 1700-377 RA= 255.987 degs; Dec= -37.8440 degs
Daily light curves: FITS version ASCII version
Orbit light curves: FITS version ASCII version
Full mission light curve
-------------------------------------------------------------------------------------------------------------------------------------------------------------------
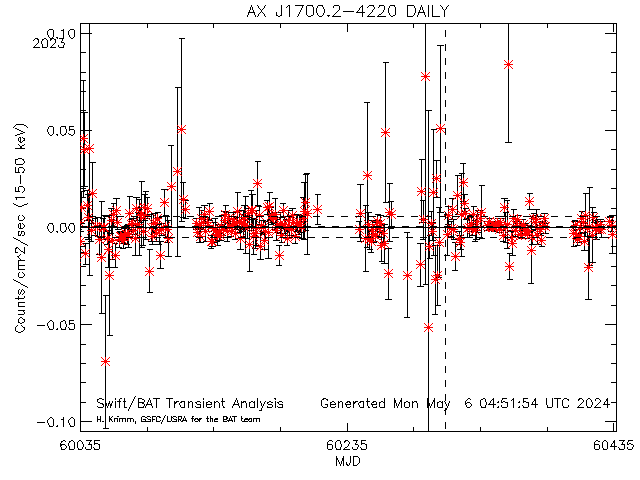
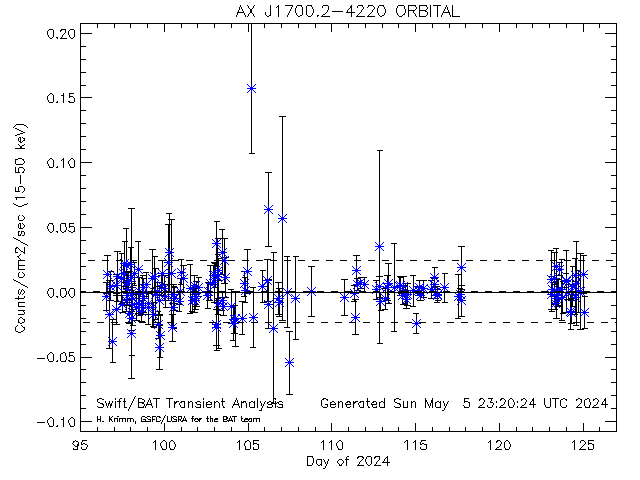
Dashed lines show average rate (and +/- 1 sigma standard deviation) for this source (derived from this plot)
[10578] AX J1700.2-4220 RA= 255.105 degs; Dec= -42.3170 degs
Daily light curves: FITS version ASCII version
Orbit light curves: FITS version ASCII version
Full mission light curve
-------------------------------------------------------------------------------------------------------------------------------------------------------------------
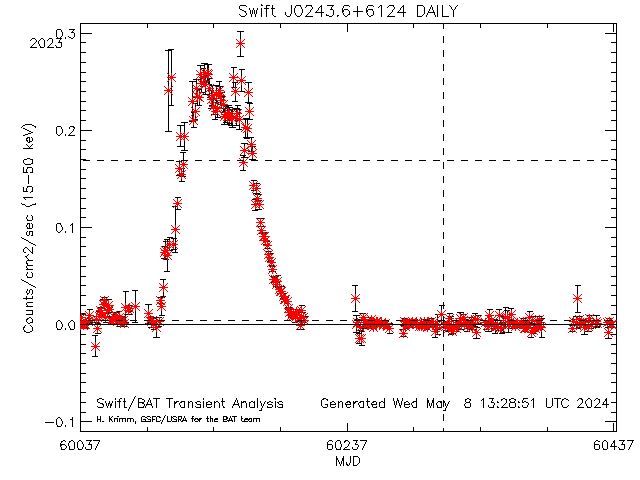
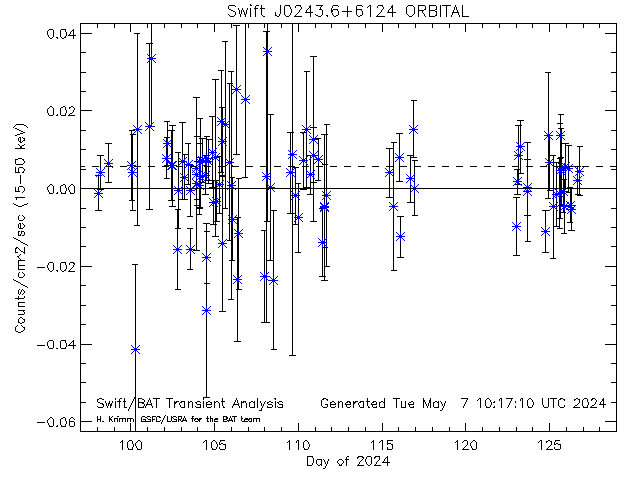
Dashed lines show average rate (and +/- 1 sigma standard deviation) for this source (derived from this plot)
[34120] Swift J0243.6+6124 RA= 40.9186 degs; Dec= 61.4323 degs
Daily light curves: FITS version ASCII version
Orbit light curves: FITS version ASCII version
Full mission light curve
-------------------------------------------------------------------------------------------------------------------------------------------------------------------
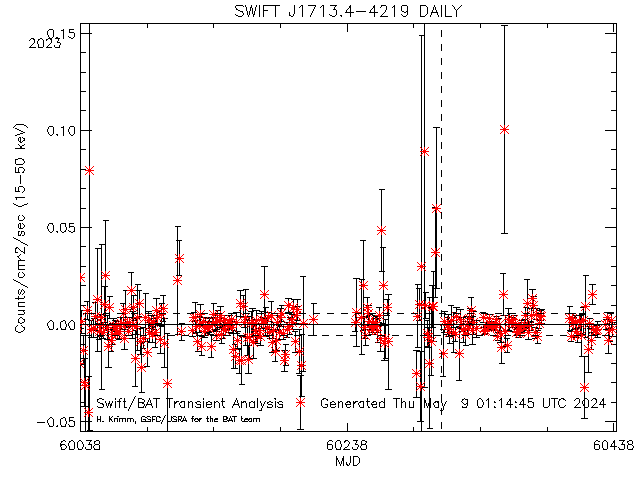
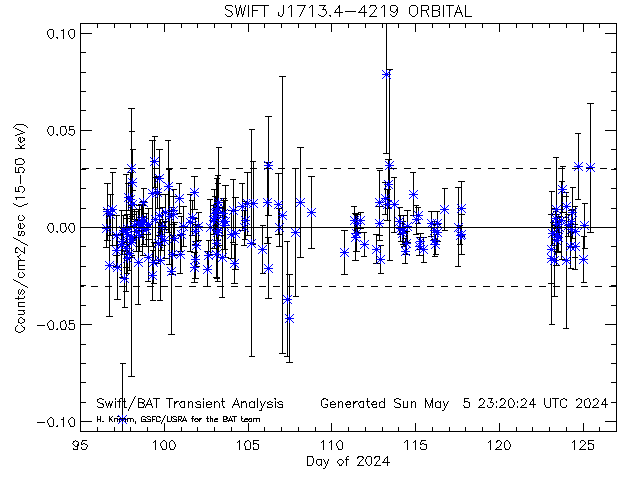
Dashed lines show average rate (and +/- 1 sigma standard deviation) for this source (derived from this plot)
[33913] SWIFT J1713.4-4219 RA= 258.361 degs; Dec= -42.3270 degs
Daily light curves: FITS version ASCII version
Orbit light curves: FITS version ASCII version
Full mission light curve
-------------------------------------------------------------------------------------------------------------------------------------------------------------------
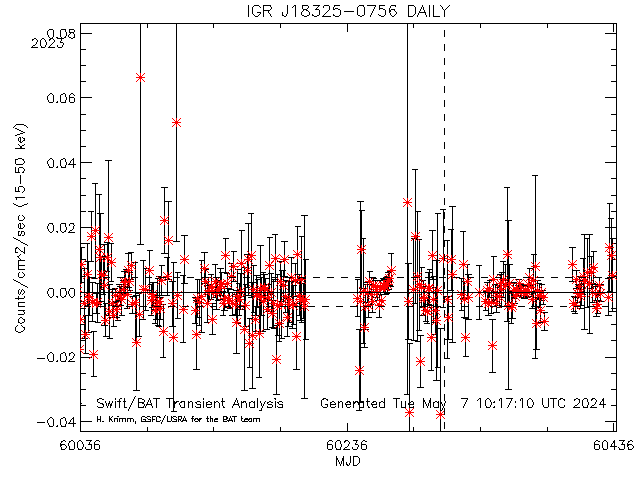

Dashed lines show average rate (and +/- 1 sigma standard deviation) for this source (derived from this plot)
[10659] IGR J18325-0756 RA= 278.125 degs; Dec= -7.93300 degs
Daily light curves: FITS version ASCII version
Orbit light curves: FITS version ASCII version
Full mission light curve
-------------------------------------------------------------------------------------------------------------------------------------------------------------------
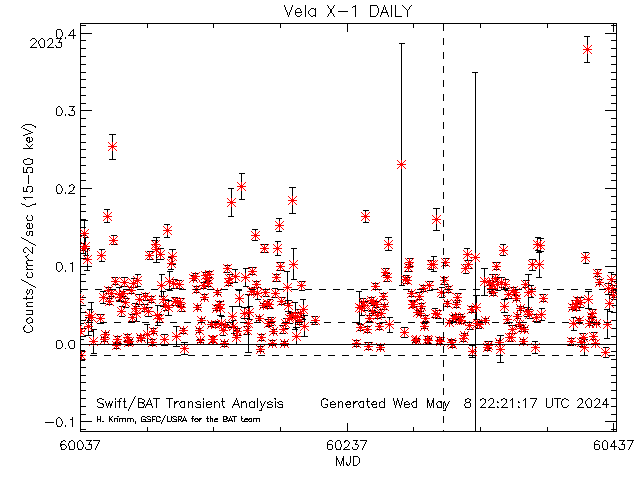
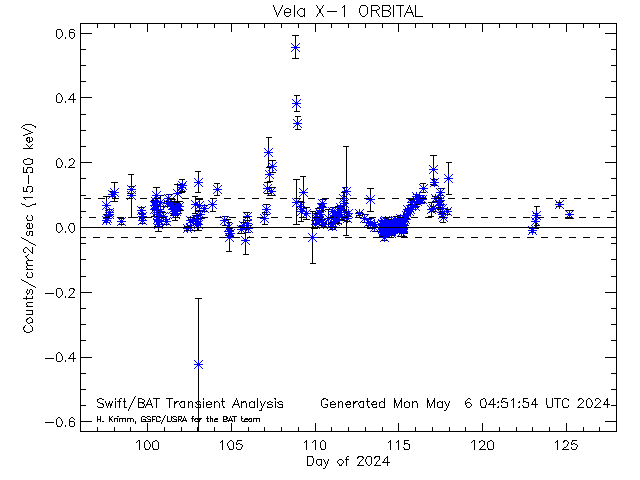
Dashed lines show average rate (and +/- 1 sigma standard deviation) for this source (derived from this plot)
[10005] Vela X-1 RA= 135.529 degs; Dec= -40.5550 degs
Daily light curves: FITS version ASCII version
Orbit light curves: FITS version ASCII version
Full mission light curve
-------------------------------------------------------------------------------------------------------------------------------------------------------------------
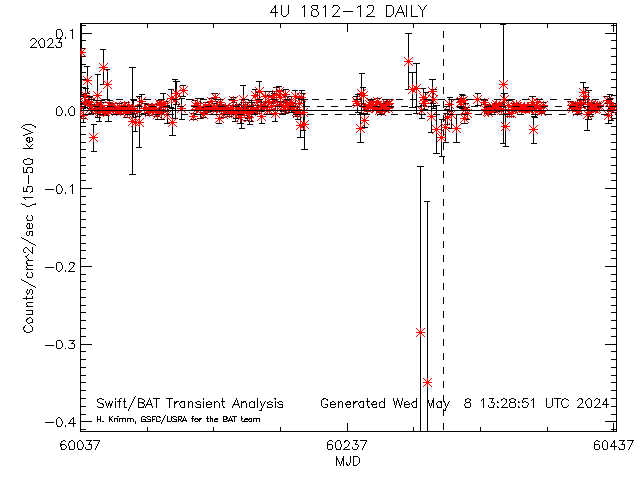
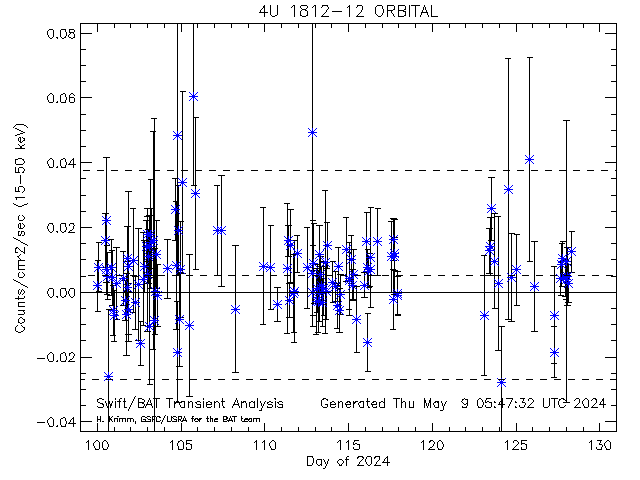
Dashed lines show average rate (and +/- 1 sigma standard deviation) for this source (derived from this plot)
[10329] 4U 1812-12 RA= 273.776 degs; Dec= -12.0960 degs
Daily light curves: FITS version ASCII version
Orbit light curves: FITS version ASCII version
Full mission light curve
-------------------------------------------------------------------------------------------------------------------------------------------------------------------
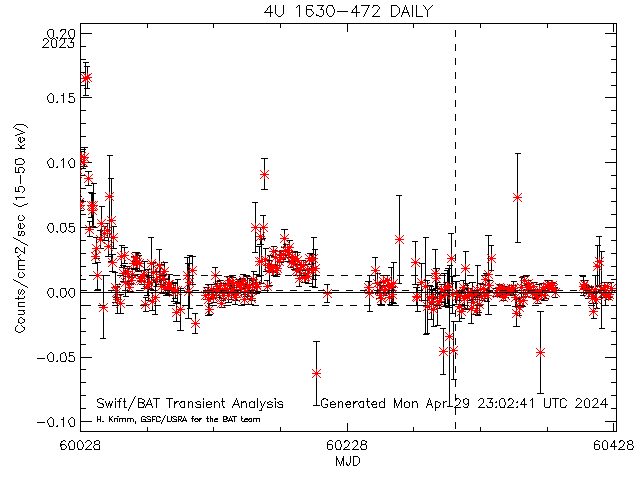
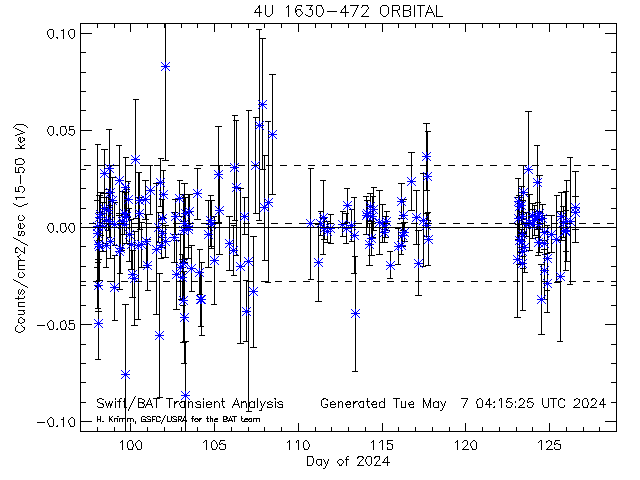
Dashed lines show average rate (and +/- 1 sigma standard deviation) for this source (derived from this plot)
[10022] 4U 1630-472 RA= 248.504 degs; Dec= -47.3930 degs
Daily light curves: FITS version ASCII version
Orbit light curves: FITS version ASCII version
Full mission light curve
-------------------------------------------------------------------------------------------------------------------------------------------------------------------
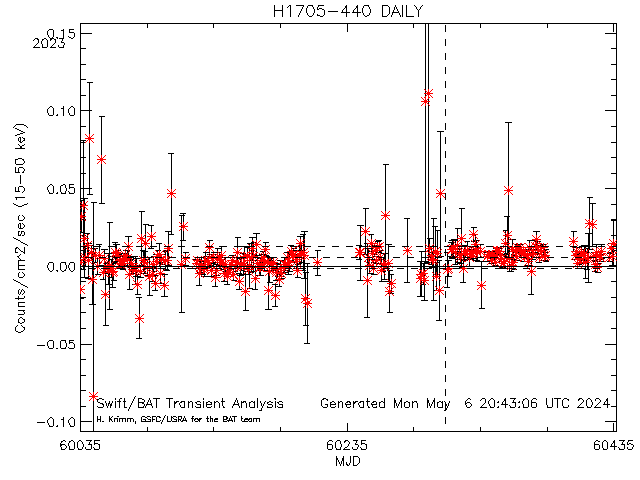
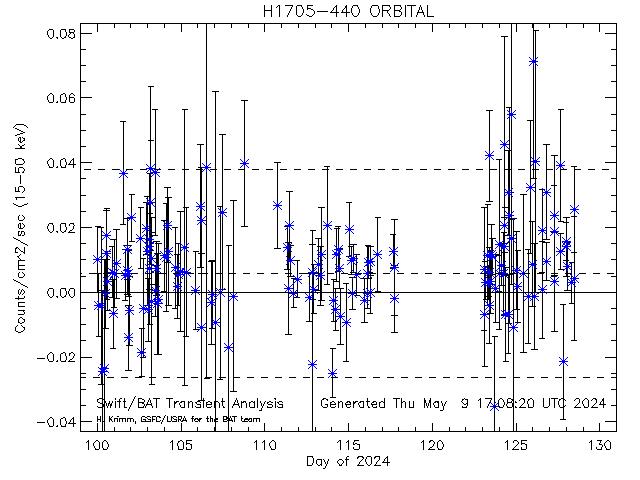
Dashed lines show average rate (and +/- 1 sigma standard deviation) for this source (derived from this plot)
[10072] H1705-440 RA= 257.225 degs; Dec= -44.1020 degs
Daily light curves: FITS version ASCII version
Orbit light curves: FITS version ASCII version
Full mission light curve
-------------------------------------------------------------------------------------------------------------------------------------------------------------------
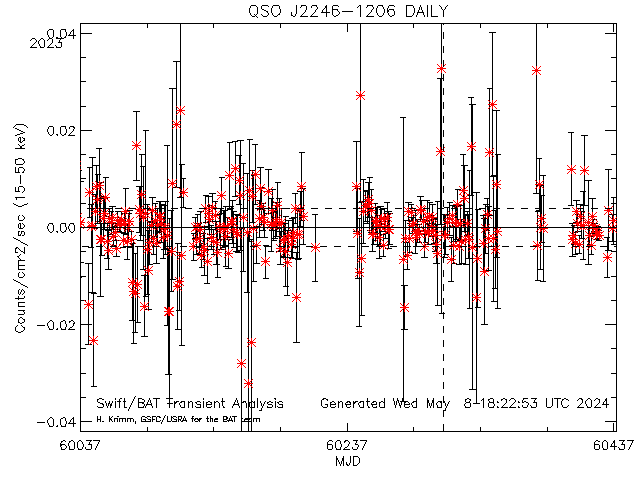
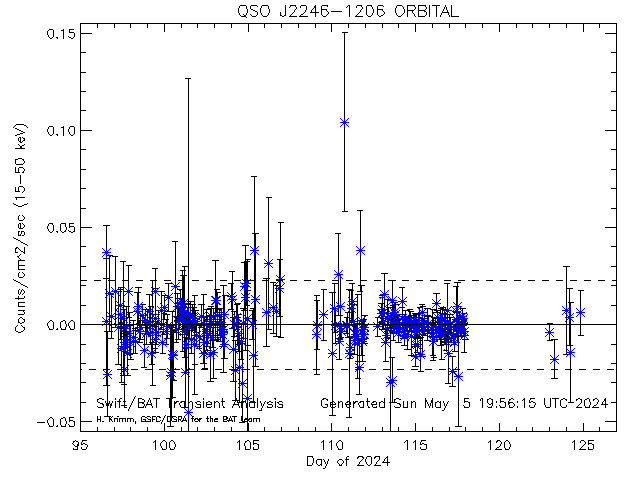
Dashed lines show average rate (and +/- 1 sigma standard deviation) for this source (derived from this plot)
[33129] QSO J2246-1206 RA= 341.576 degs; Dec= -12.1142 degs
Daily light curves: FITS version ASCII version
Orbit light curves: FITS version ASCII version
Full mission light curve
-------------------------------------------------------------------------------------------------------------------------------------------------------------------
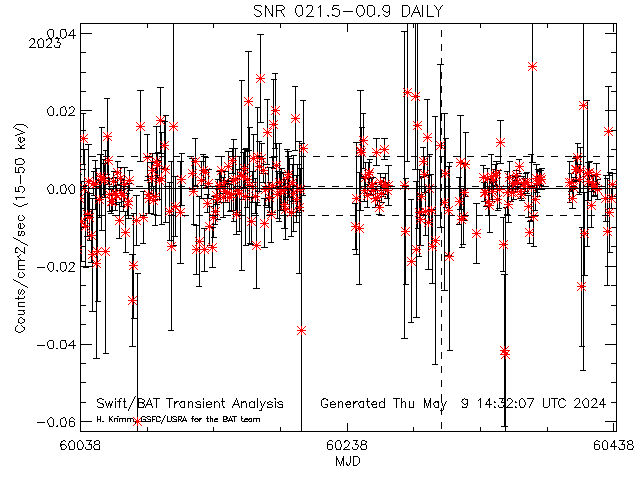
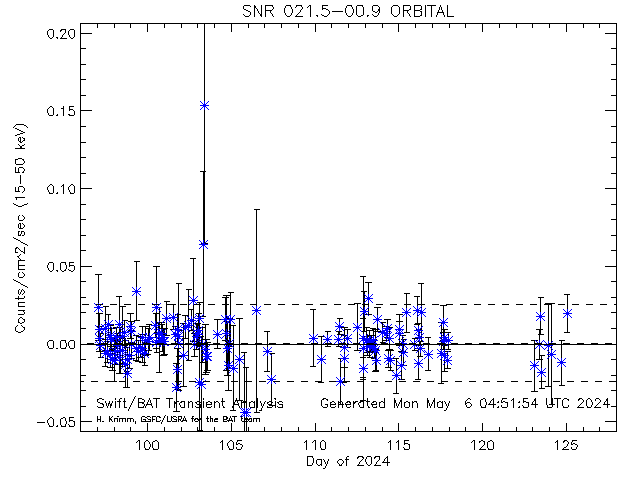
Dashed lines show average rate (and +/- 1 sigma standard deviation) for this source (derived from this plot)
[10594] SNR 021.5-00.9 RA= 278.390 degs; Dec= -10.5690 degs
Daily light curves: FITS version ASCII version
Orbit light curves: FITS version ASCII version
Full mission light curve
-------------------------------------------------------------------------------------------------------------------------------------------------------------------
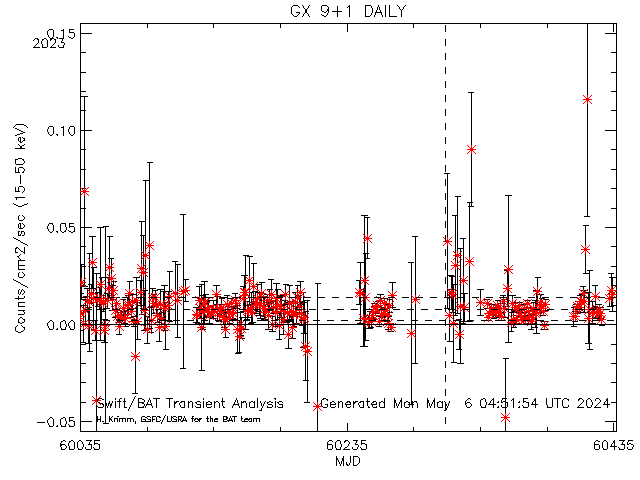
Dashed lines show average rate (and +/- 1 sigma standard deviation) for this source (derived from this plot)
[10059] GX 9+1 RA= 270.385 degs; Dec= -20.5290 degs
Daily light curves: FITS version ASCII version
Orbit light curves: FITS version ASCII version
Full mission light curve
-------------------------------------------------------------------------------------------------------------------------------------------------------------------
Dashed lines show average rate (and +/- 1 sigma standard deviation) for this source (derived from this plot)
[33727] PKS 2023-07 RA= 306.419 degs; Dec= -7.59800 degs
Daily light curves: FITS version ASCII version
Orbit light curves: FITS version ASCII version
Full mission light curve
-------------------------------------------------------------------------------------------------------------------------------------------------------------------
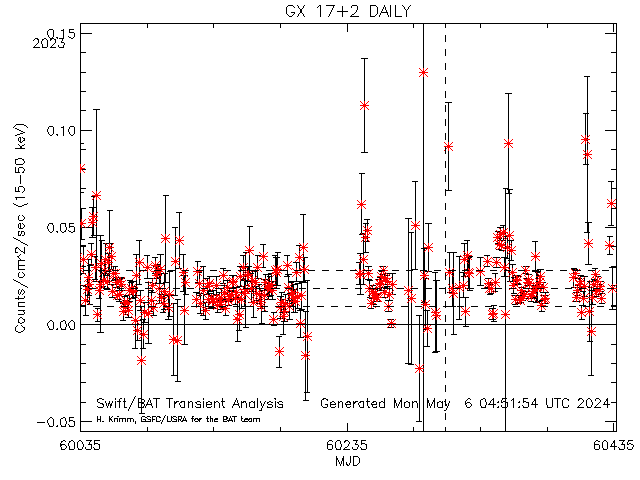
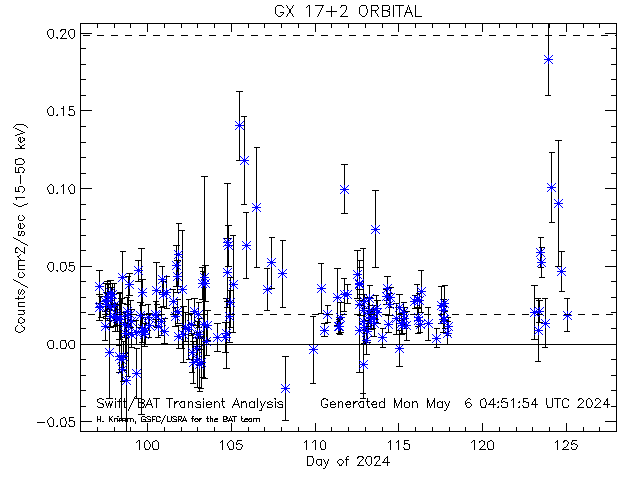
Dashed lines show average rate (and +/- 1 sigma standard deviation) for this source (derived from this plot)
[10049] GX 17+2 RA= 274.006 degs; Dec= -14.0360 degs
Daily light curves: FITS version ASCII version
Orbit light curves: FITS version ASCII version
Full mission light curve
-------------------------------------------------------------------------------------------------------------------------------------------------------------------
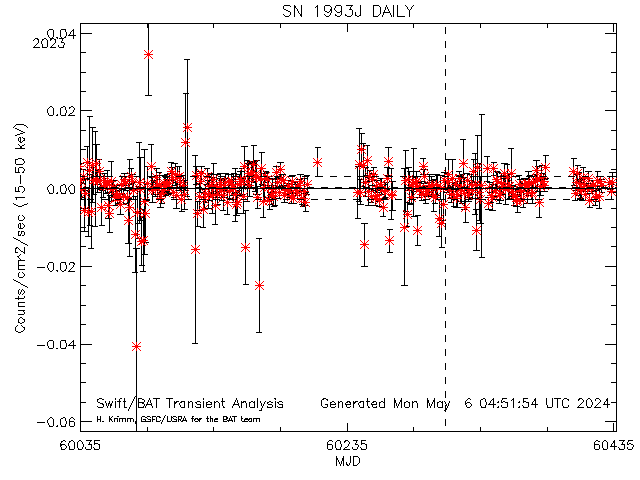
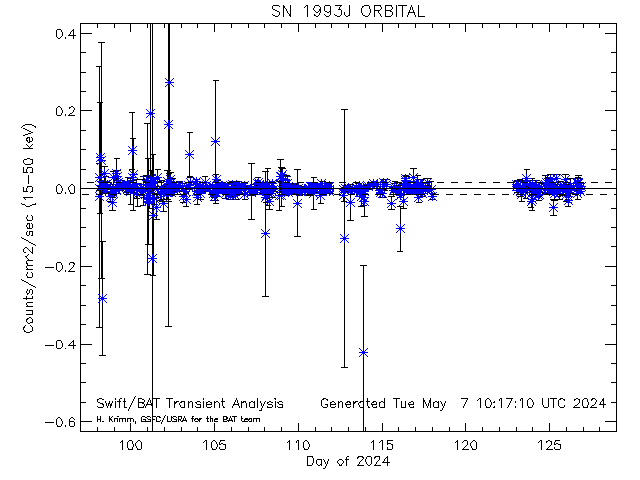
Dashed lines show average rate (and +/- 1 sigma standard deviation) for this source (derived from this plot)
[10117] SN 1993J RA= 148.850 degs; Dec= 69.0170 degs
Daily light curves: FITS version ASCII version
Orbit light curves: FITS version ASCII version
Full mission light curve
-------------------------------------------------------------------------------------------------------------------------------------------------------------------
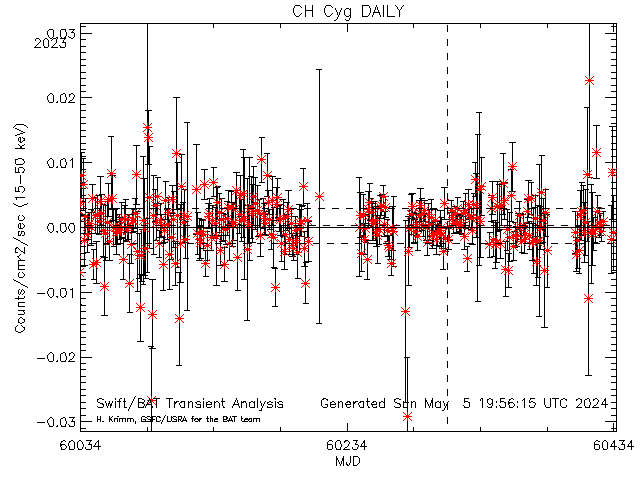
Dashed lines show average rate (and +/- 1 sigma standard deviation) for this source (derived from this plot)
[20161] CH Cyg RA= 291.138 degs; Dec= 50.2414 degs
Daily light curves: FITS version ASCII version
Orbit light curves: FITS version ASCII version
Full mission light curve
-------------------------------------------------------------------------------------------------------------------------------------------------------------------
Dashed lines show average rate (and +/- 1 sigma standard deviation) for this source (derived from this plot)
[10108] PSR B1951+32 RA= 298.250 degs; Dec= 32.8830 degs
Daily light curves: FITS version ASCII version
Orbit light curves: FITS version ASCII version
Full mission light curve
-------------------------------------------------------------------------------------------------------------------------------------------------------------------
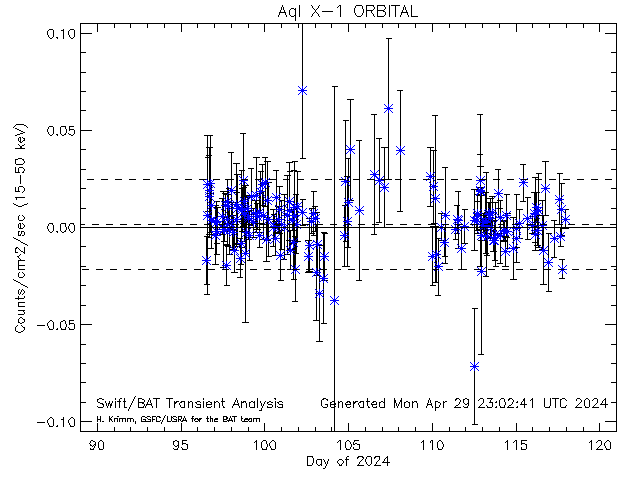
Dashed lines show average rate (and +/- 1 sigma standard deviation) for this source (derived from this plot)
[10031] Aql X-1 RA= 287.817 degs; Dec= 0.585000 degs
Daily light curves: FITS version ASCII version
Orbit light curves: FITS version ASCII version
Full mission light curve
-------------------------------------------------------------------------------------------------------------------------------------------------------------------
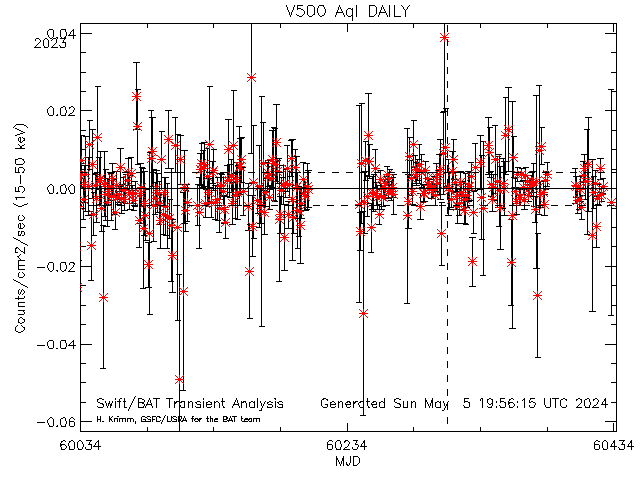
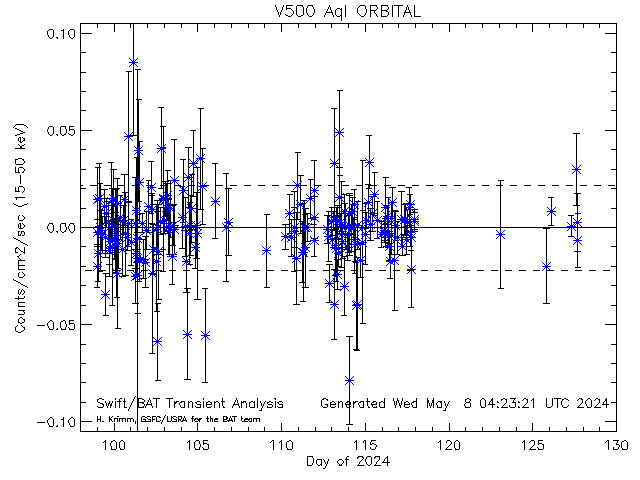
Dashed lines show average rate (and +/- 1 sigma standard deviation) for this source (derived from this plot)
[33857] V500 Aql RA= 298.116 degs; Dec= 8.48000 degs
Daily light curves: FITS version ASCII version
Orbit light curves: FITS version ASCII version
Full mission light curve
-------------------------------------------------------------------------------------------------------------------------------------------------------------------
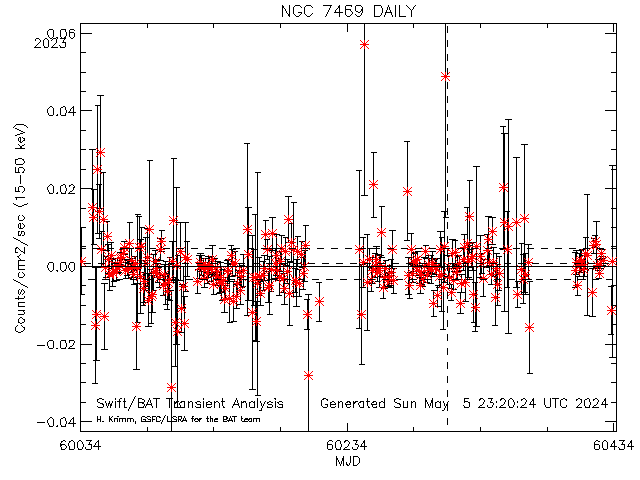
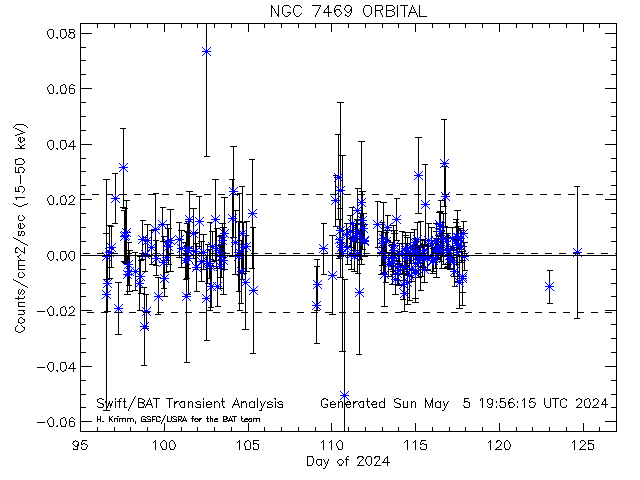
Dashed lines show average rate (and +/- 1 sigma standard deviation) for this source (derived from this plot)
[20178] NGC 7469 RA= 345.816 degs; Dec= 8.87386 degs
Daily light curves: FITS version ASCII version
Orbit light curves: FITS version ASCII version
Full mission light curve
-------------------------------------------------------------------------------------------------------------------------------------------------------------------
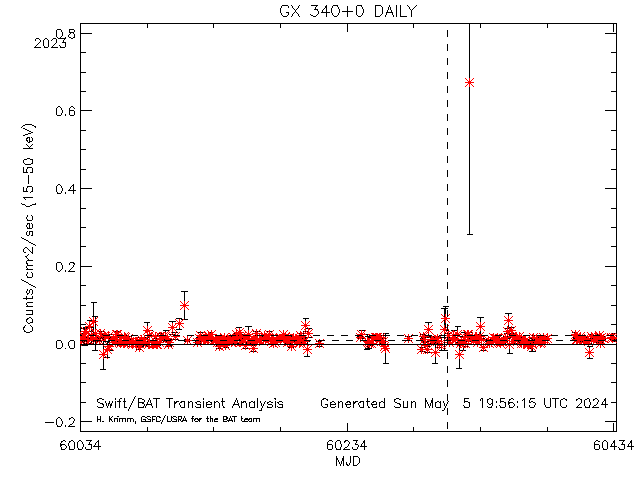
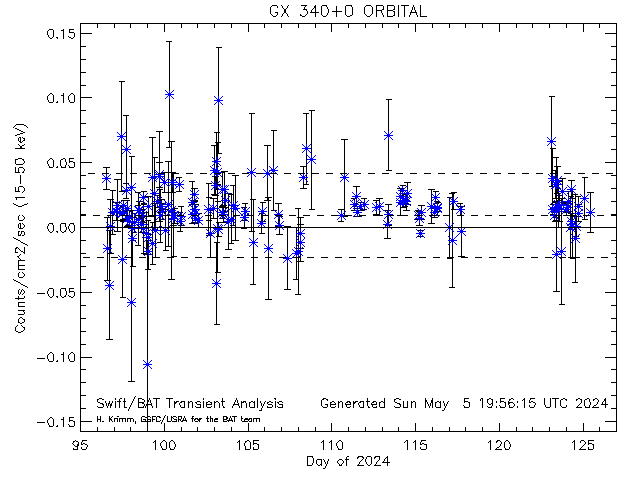
Dashed lines show average rate (and +/- 1 sigma standard deviation) for this source (derived from this plot)
[10054] GX 340+0 RA= 251.449 degs; Dec= -45.6111 degs
Daily light curves: FITS version ASCII version
Orbit light curves: FITS version ASCII version
Full mission light curve
-------------------------------------------------------------------------------------------------------------------------------------------------------------------
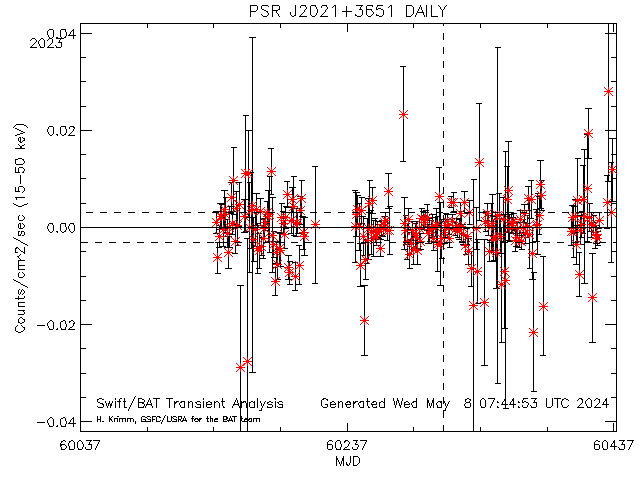
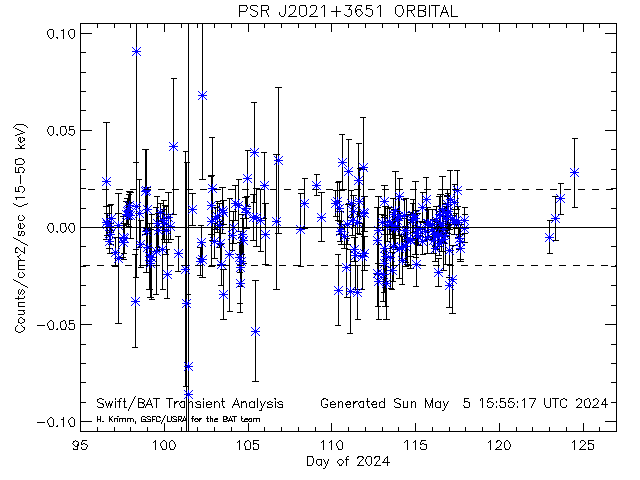
Dashed lines show average rate (and +/- 1 sigma standard deviation) for this source (derived from this plot)
[33824] PSR J2021+3651 RA= 305.269 degs; Dec= 36.8570 degs
Daily light curves: FITS version ASCII version
Orbit light curves: FITS version ASCII version
Full mission light curve
-------------------------------------------------------------------------------------------------------------------------------------------------------------------
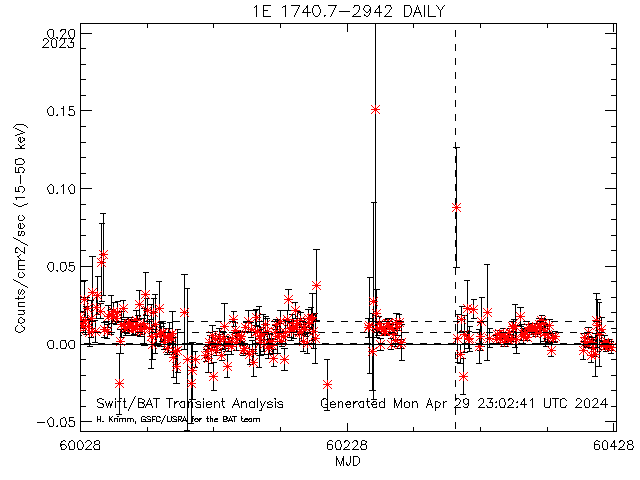
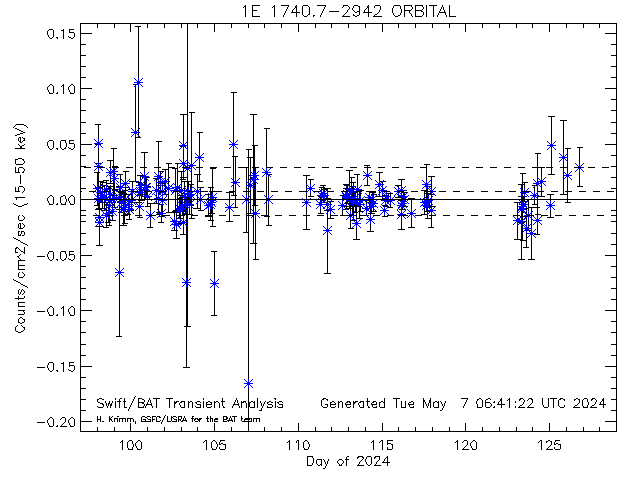
Dashed lines show average rate (and +/- 1 sigma standard deviation) for this source (derived from this plot)
[10006] 1E 1740.7-2942 RA= 265.978 degs; Dec= -29.7450 degs
Daily light curves: FITS version ASCII version
Orbit light curves: FITS version ASCII version
Full mission light curve
-------------------------------------------------------------------------------------------------------------------------------------------------------------------
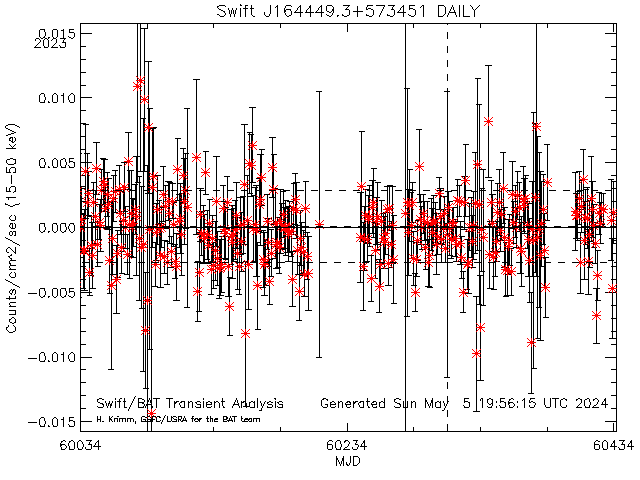
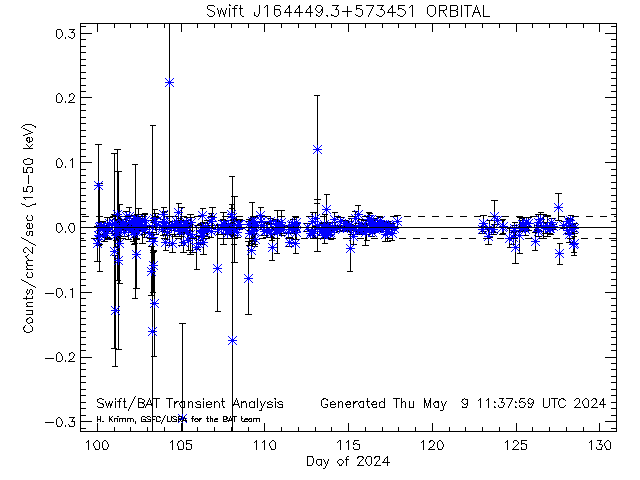
Dashed lines show average rate (and +/- 1 sigma standard deviation) for this source (derived from this plot)
[34005] Swift J164449.3+573451 RA= 251.205 degs; Dec= 57.5810 degs
Daily light curves: FITS version ASCII version
Orbit light curves: FITS version ASCII version
Full mission light curve
-------------------------------------------------------------------------------------------------------------------------------------------------------------------
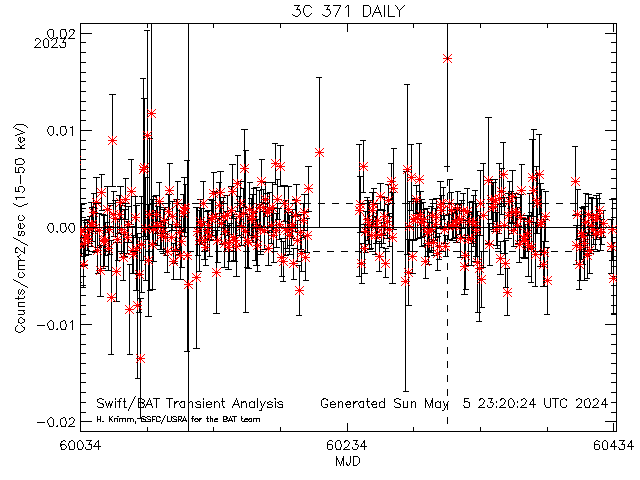
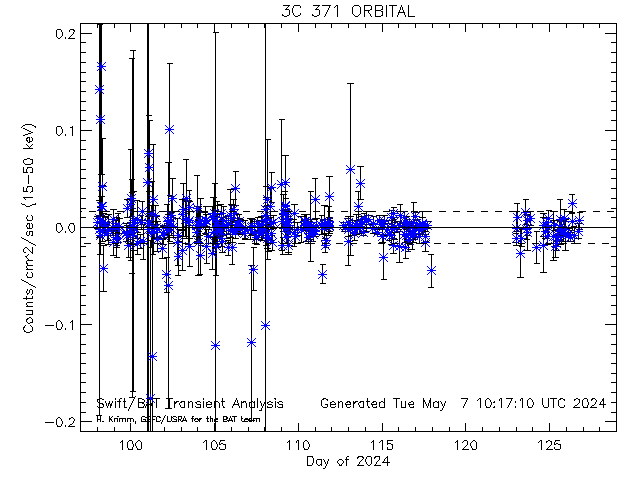
Dashed lines show average rate (and +/- 1 sigma standard deviation) for this source (derived from this plot)
[33843] 3C 371 RA= 271.711 degs; Dec= 69.8240 degs
Daily light curves: FITS version ASCII version
Orbit light curves: FITS version ASCII version
Full mission light curve
-------------------------------------------------------------------------------------------------------------------------------------------------------------------
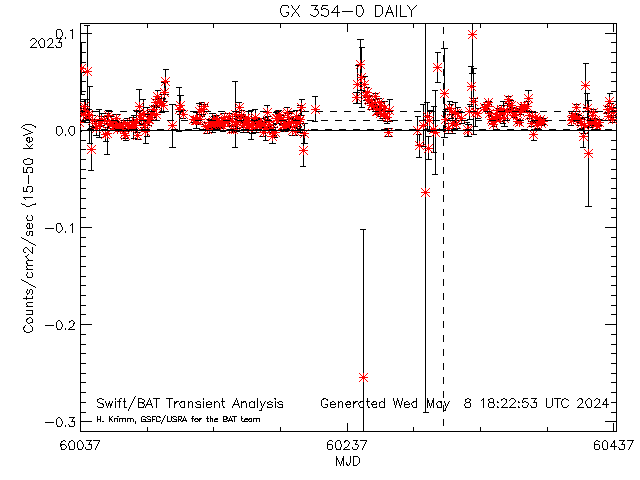
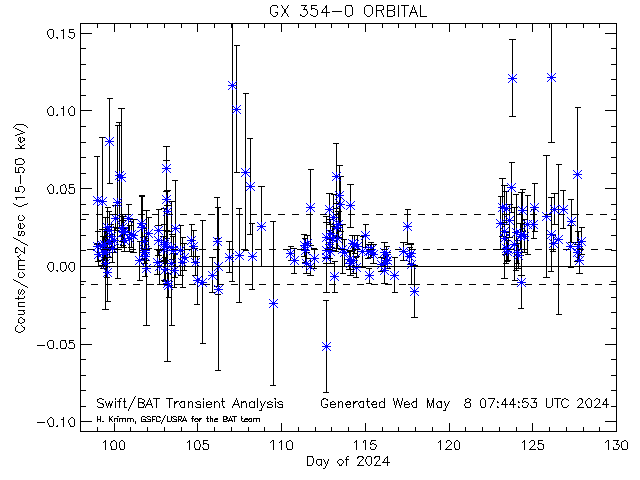
Dashed lines show average rate (and +/- 1 sigma standard deviation) for this source (derived from this plot)
[10056] GX 354-0 RA= 262.988 degs; Dec= -33.8340 degs
Daily light curves: FITS version ASCII version
Orbit light curves: FITS version ASCII version
Full mission light curve
-------------------------------------------------------------------------------------------------------------------------------------------------------------------
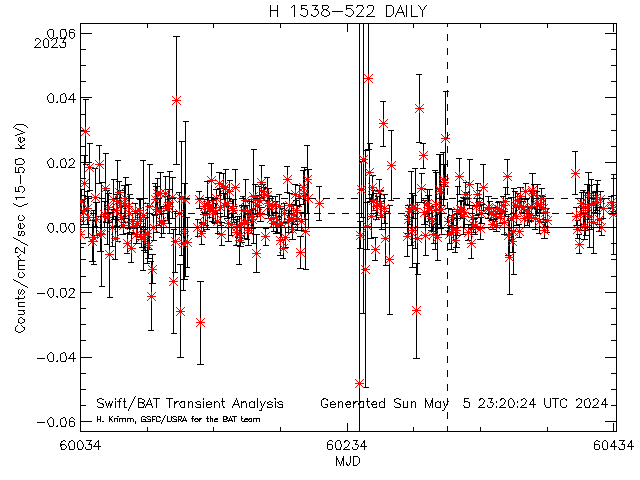
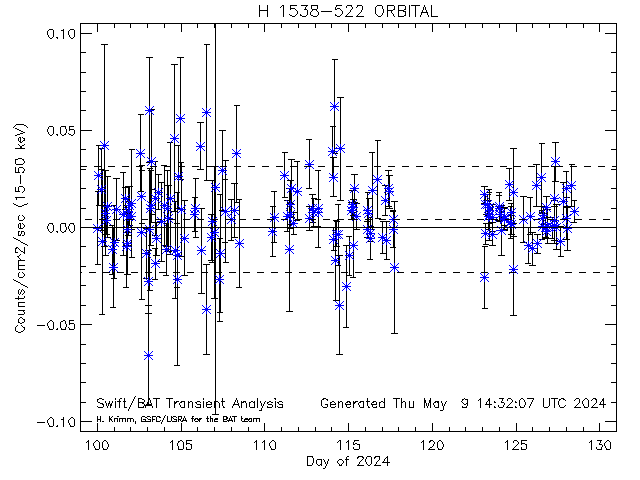
Dashed lines show average rate (and +/- 1 sigma standard deviation) for this source (derived from this plot)
[10066] H 1538-522 RA= 235.597 degs; Dec= -52.3860 degs
Daily light curves: FITS version ASCII version
Orbit light curves: FITS version ASCII version
Full mission light curve
-------------------------------------------------------------------------------------------------------------------------------------------------------------------
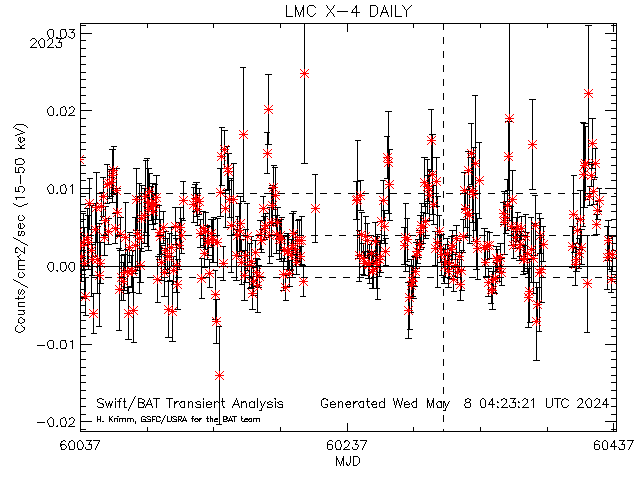
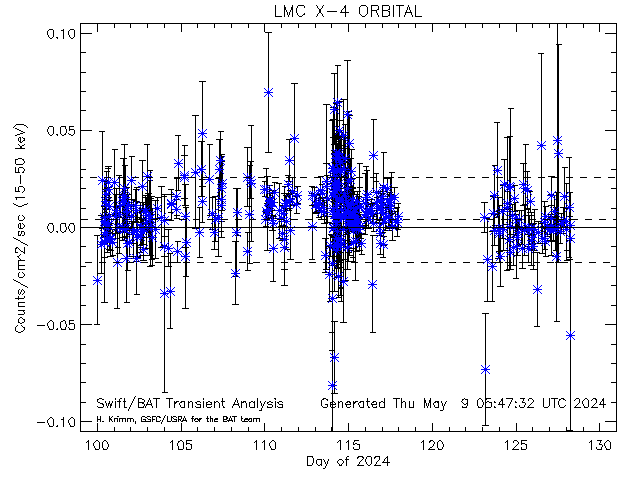
Dashed lines show average rate (and +/- 1 sigma standard deviation) for this source (derived from this plot)
[10081] LMC X-4 RA= 83.2060 degs; Dec= -66.3700 degs
Daily light curves: FITS version ASCII version
Orbit light curves: FITS version ASCII version
Full mission light curve
-------------------------------------------------------------------------------------------------------------------------------------------------------------------
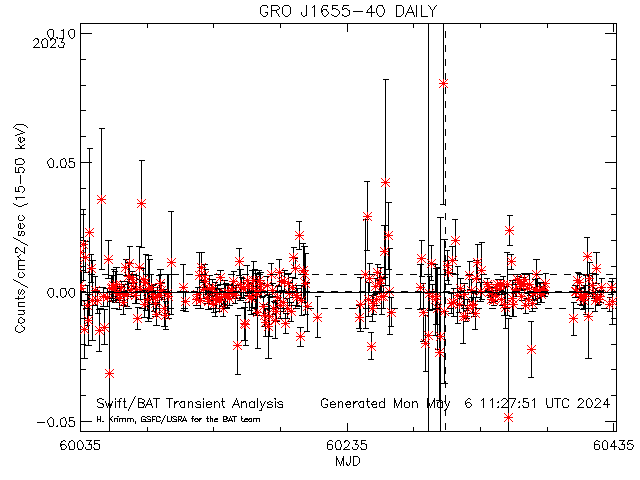
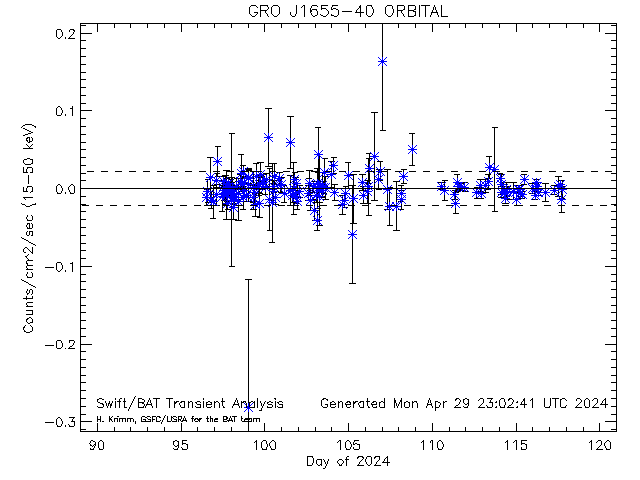
Dashed lines show average rate (and +/- 1 sigma standard deviation) for this source (derived from this plot)
[20001] GRO J1655-40 RA= 253.501 degs; Dec= -39.8333 degs
Daily light curves: FITS version ASCII version
Orbit light curves: FITS version ASCII version
Full mission light curve
-------------------------------------------------------------------------------------------------------------------------------------------------------------------
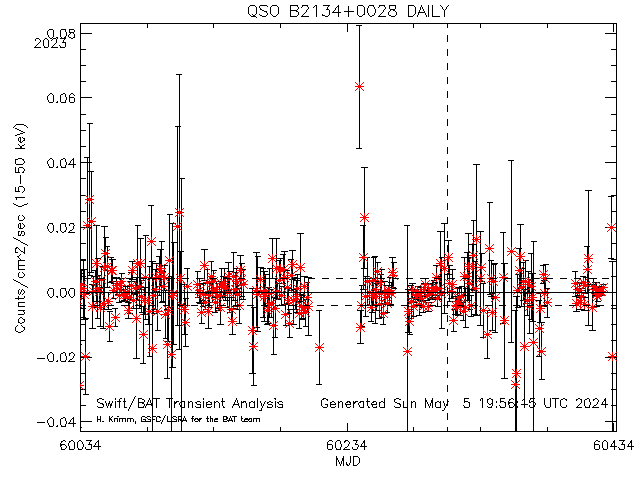
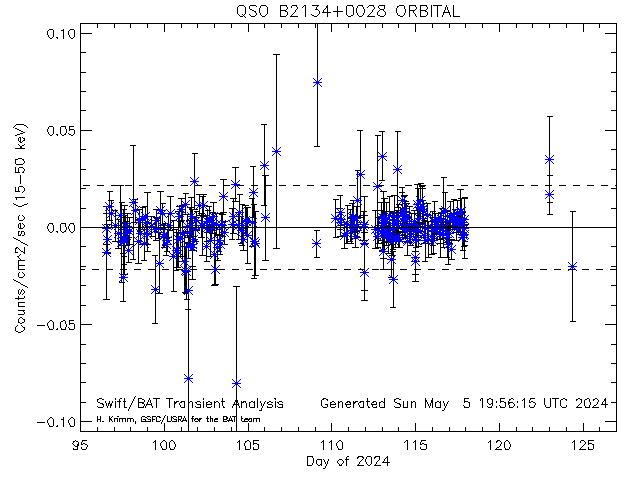
Dashed lines show average rate (and +/- 1 sigma standard deviation) for this source (derived from this plot)
[33117] QSO B2134+0028 RA= 324.161 degs; Dec= 0.698393 degs
Daily light curves: FITS version ASCII version
Orbit light curves: FITS version ASCII version
Full mission light curve
-------------------------------------------------------------------------------------------------------------------------------------------------------------------
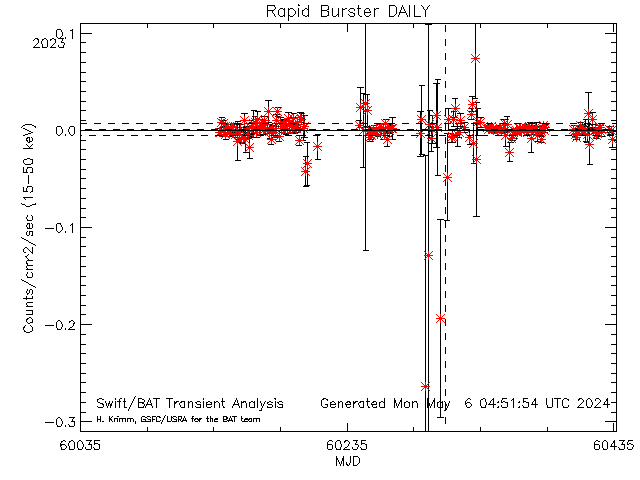
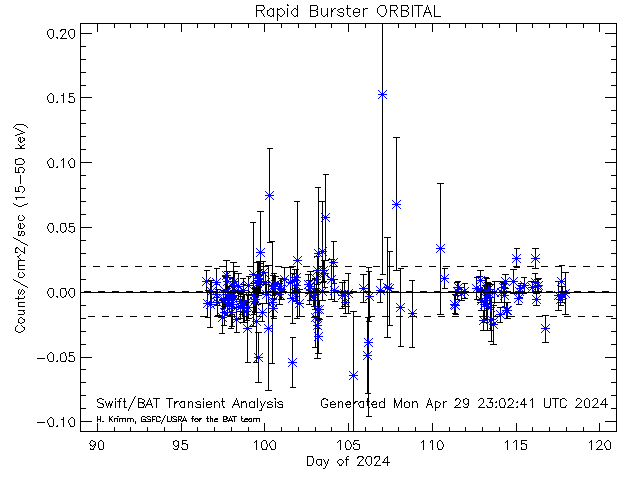
Dashed lines show average rate (and +/- 1 sigma standard deviation) for this source (derived from this plot)
[10354] Rapid Burster RA= 263.353 degs; Dec= -33.3880 degs
Daily light curves: FITS version ASCII version
Orbit light curves: FITS version ASCII version
Full mission light curve
-------------------------------------------------------------------------------------------------------------------------------------------------------------------
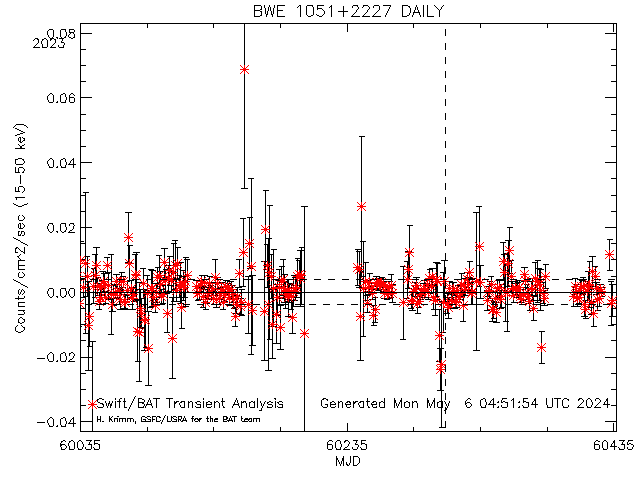
Dashed lines show average rate (and +/- 1 sigma standard deviation) for this source (derived from this plot)
[33776] BWE 1051+2227 RA= 163.627 degs; Dec= 22.1820 degs
Daily light curves: FITS version ASCII version
Orbit light curves: FITS version ASCII version
Full mission light curve
-------------------------------------------------------------------------------------------------------------------------------------------------------------------
Dashed lines show average rate (and +/- 1 sigma standard deviation) for this source (derived from this plot)
[10319] GX 13+1 RA= 273.630 degs; Dec= -17.1570 degs
Daily light curves: FITS version ASCII version
Orbit light curves: FITS version ASCII version
Full mission light curve
-------------------------------------------------------------------------------------------------------------------------------------------------------------------
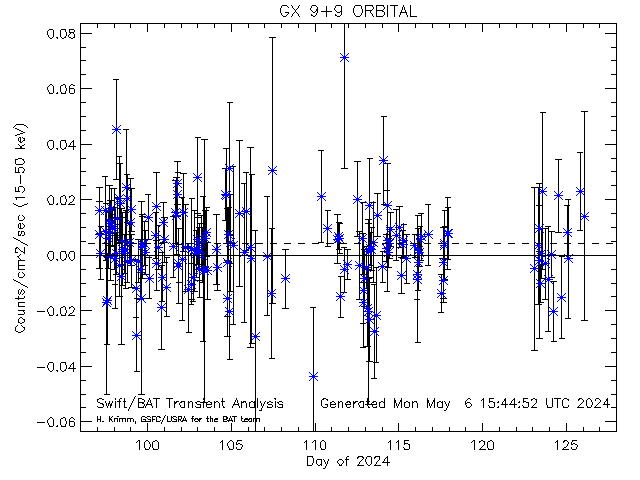
Dashed lines show average rate (and +/- 1 sigma standard deviation) for this source (derived from this plot)
[10317] GX 9+9 RA= 262.934 degs; Dec= -16.9620 degs
Daily light curves: FITS version ASCII version
Orbit light curves: FITS version ASCII version
Full mission light curve
-------------------------------------------------------------------------------------------------------------------------------------------------------------------
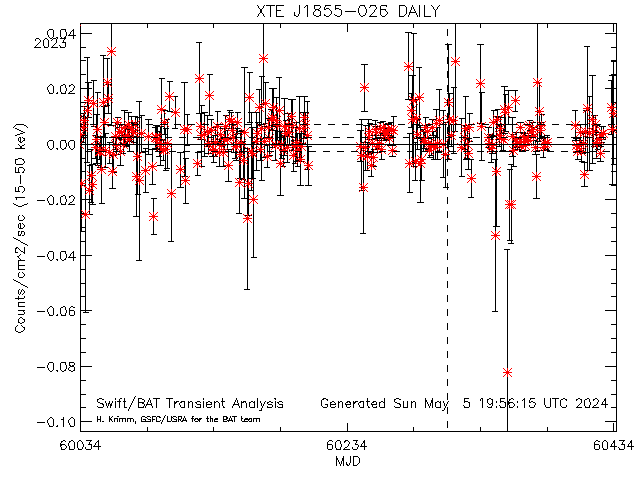
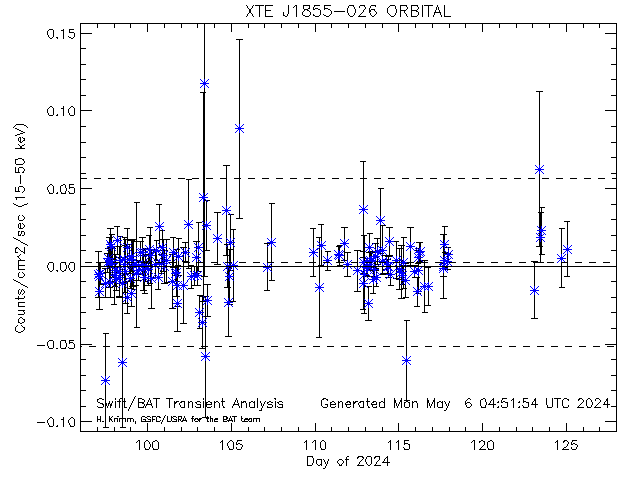
Dashed lines show average rate (and +/- 1 sigma standard deviation) for this source (derived from this plot)
[10566] XTE J1855-026 RA= 283.877 degs; Dec= -2.60500 degs
Daily light curves: FITS version ASCII version
Orbit light curves: FITS version ASCII version
Full mission light curve
-------------------------------------------------------------------------------------------------------------------------------------------------------------------
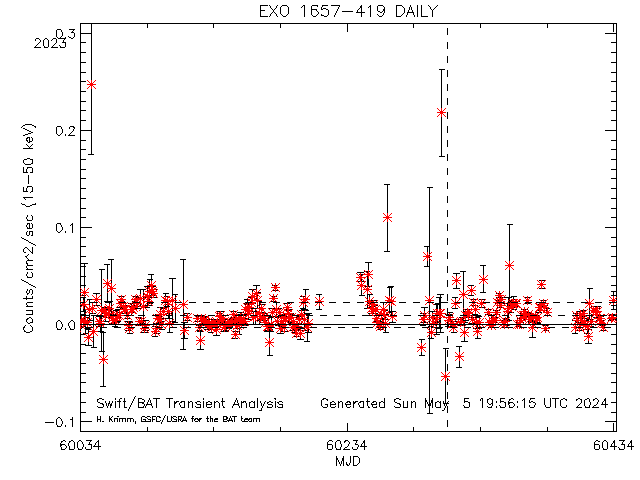
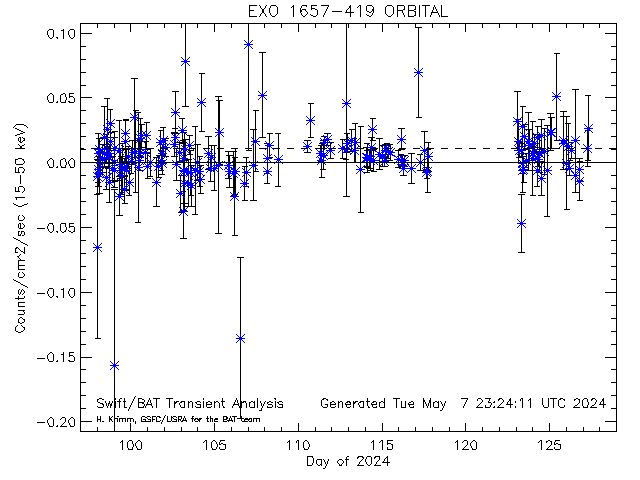
Dashed lines show average rate (and +/- 1 sigma standard deviation) for this source (derived from this plot)
[20002] EXO 1657-419 RA= 255.200 degs; Dec= -41.6731 degs
Daily light curves: FITS version ASCII version
Orbit light curves: FITS version ASCII version
Full mission light curve
-------------------------------------------------------------------------------------------------------------------------------------------------------------------
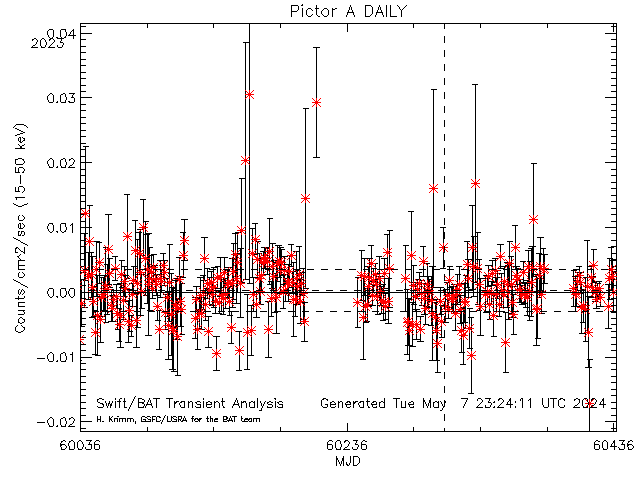
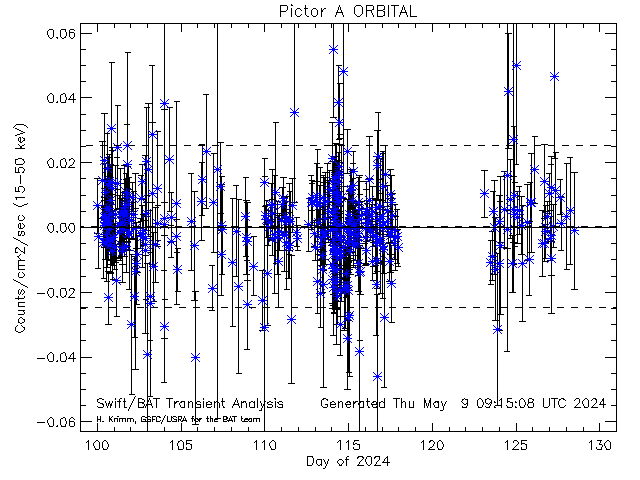
Dashed lines show average rate (and +/- 1 sigma standard deviation) for this source (derived from this plot)
[33966] Pictor A RA= 79.9570 degs; Dec= -45.7790 degs
Daily light curves: FITS version ASCII version
Orbit light curves: FITS version ASCII version
Full mission light curve
-------------------------------------------------------------------------------------------------------------------------------------------------------------------
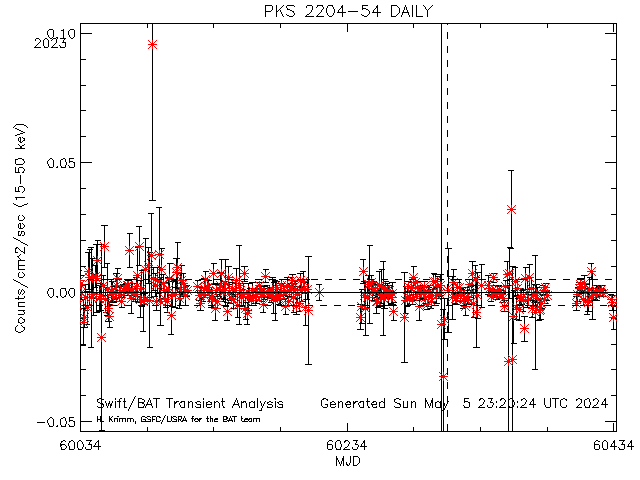
Dashed lines show average rate (and +/- 1 sigma standard deviation) for this source (derived from this plot)
[33834] PKS 2204-54 RA= 331.932 degs; Dec= -53.7760 degs
Daily light curves: FITS version ASCII version
Orbit light curves: FITS version ASCII version
Full mission light curve
-------------------------------------------------------------------------------------------------------------------------------------------------------------------
Dashed lines show average rate (and +/- 1 sigma standard deviation) for this source (derived from this plot)
[10058] GX 5-1 RA= 270.284 degs; Dec= -25.0780 degs
Daily light curves: FITS version ASCII version
Orbit light curves: FITS version ASCII version
Full mission light curve
-------------------------------------------------------------------------------------------------------------------------------------------------------------------
Dashed lines show average rate (and +/- 1 sigma standard deviation) for this source (derived from this plot)
[20006] 3C 454.3 RA= 343.490 degs; Dec= 16.1480 degs
Daily light curves: FITS version ASCII version
Orbit light curves: FITS version ASCII version
Full mission light curve
-------------------------------------------------------------------------------------------------------------------------------------------------------------------
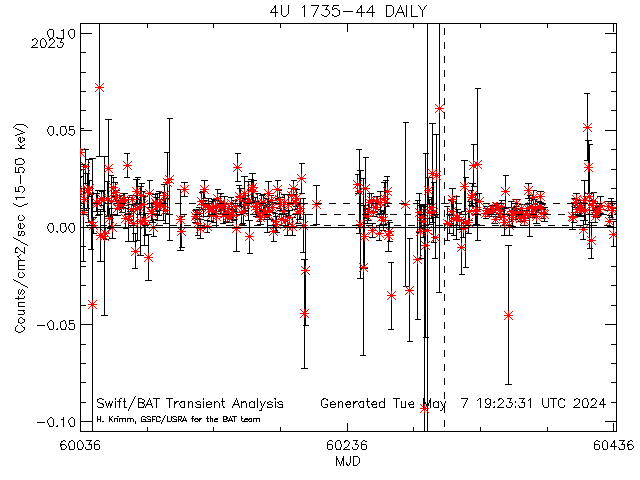
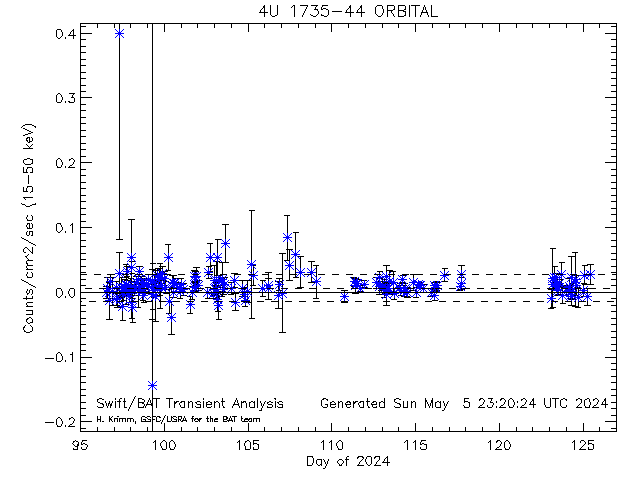
Dashed lines show average rate (and +/- 1 sigma standard deviation) for this source (derived from this plot)
[10300] 4U 1735-44 RA= 264.743 degs; Dec= -44.4500 degs
Daily light curves: FITS version ASCII version
Orbit light curves: FITS version ASCII version
Full mission light curve
-------------------------------------------------------------------------------------------------------------------------------------------------------------------
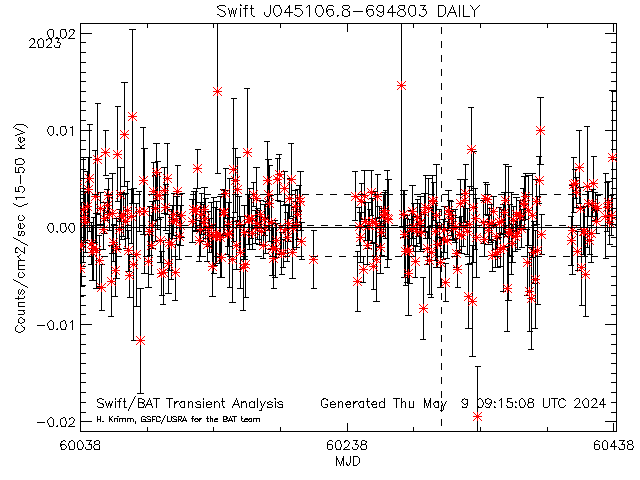
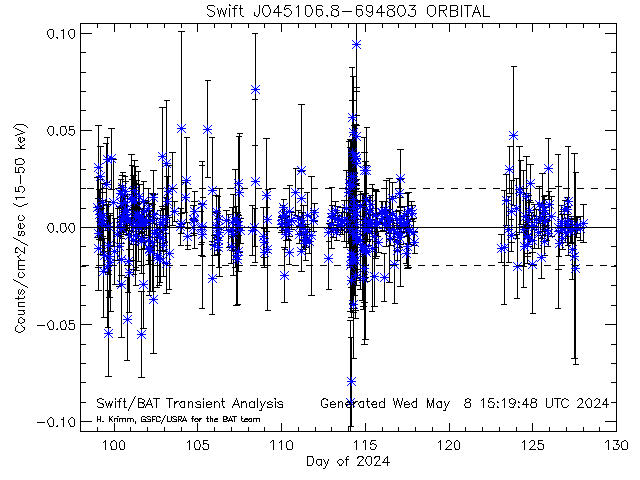
Dashed lines show average rate (and +/- 1 sigma standard deviation) for this source (derived from this plot)
[33720] Swift J045106.8-694803 RA= 72.7780 degs; Dec= -69.8010 degs
Daily light curves: FITS version ASCII version
Orbit light curves: FITS version ASCII version
Full mission light curve
-------------------------------------------------------------------------------------------------------------------------------------------------------------------
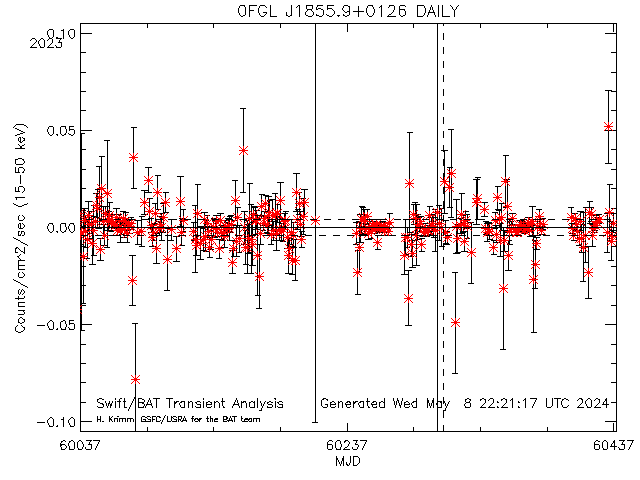
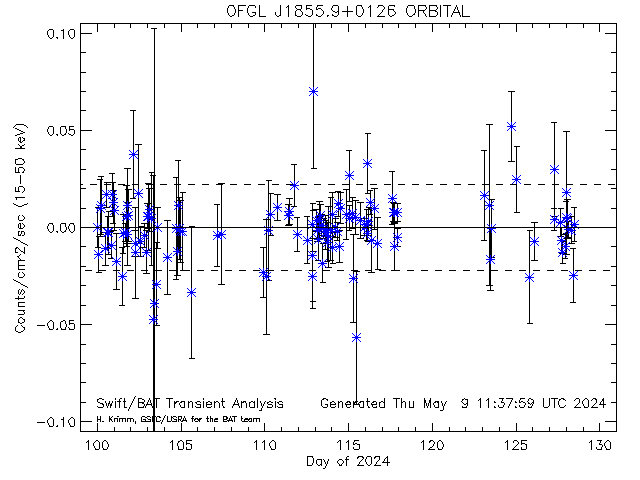
Dashed lines show average rate (and +/- 1 sigma standard deviation) for this source (derived from this plot)
[33814] 0FGL J1855.9+0126 RA= 284.038 degs; Dec= 1.37500 degs
Daily light curves: FITS version ASCII version
Orbit light curves: FITS version ASCII version
Full mission light curve
-------------------------------------------------------------------------------------------------------------------------------------------------------------------
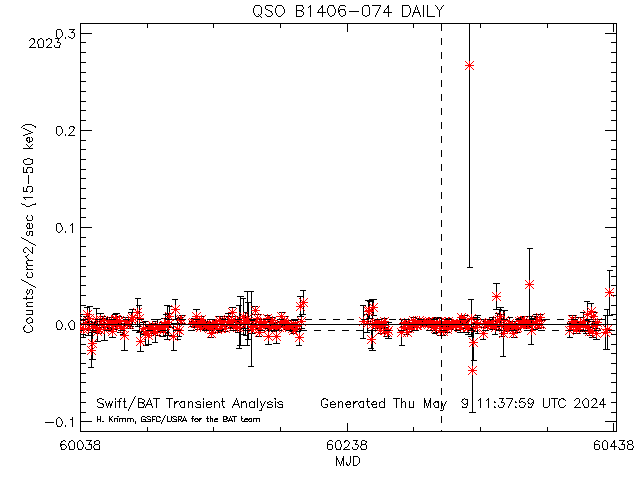
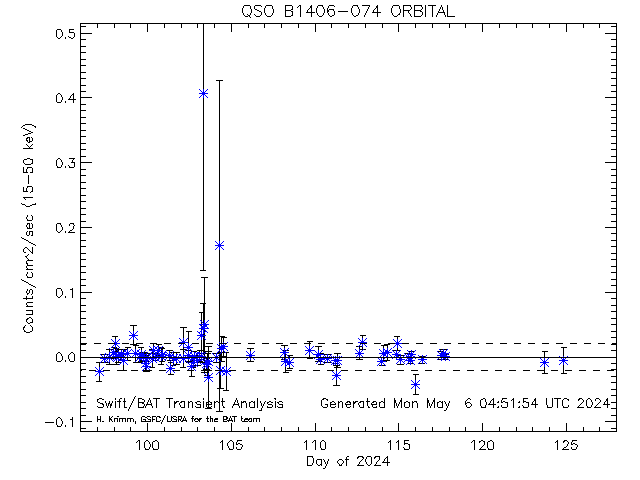
Dashed lines show average rate (and +/- 1 sigma standard deviation) for this source (derived from this plot)
[33664] QSO B1406-074 RA= 212.235 degs; Dec= -7.87400 degs
Daily light curves: FITS version ASCII version
Orbit light curves: FITS version ASCII version
Full mission light curve
-------------------------------------------------------------------------------------------------------------------------------------------------------------------
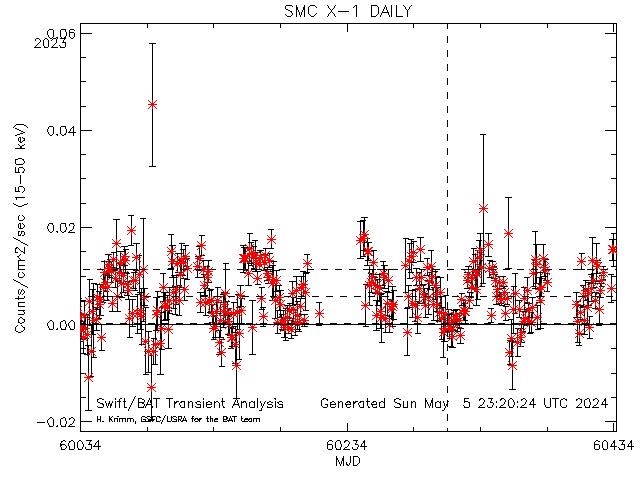
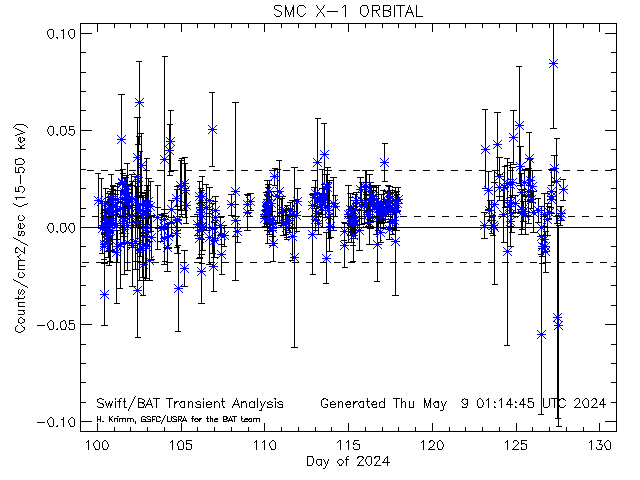
Dashed lines show average rate (and +/- 1 sigma standard deviation) for this source (derived from this plot)
[10114] SMC X-1 RA= 19.2710 degs; Dec= -73.4430 degs
Daily light curves: FITS version ASCII version
Orbit light curves: FITS version ASCII version
Full mission light curve
-------------------------------------------------------------------------------------------------------------------------------------------------------------------
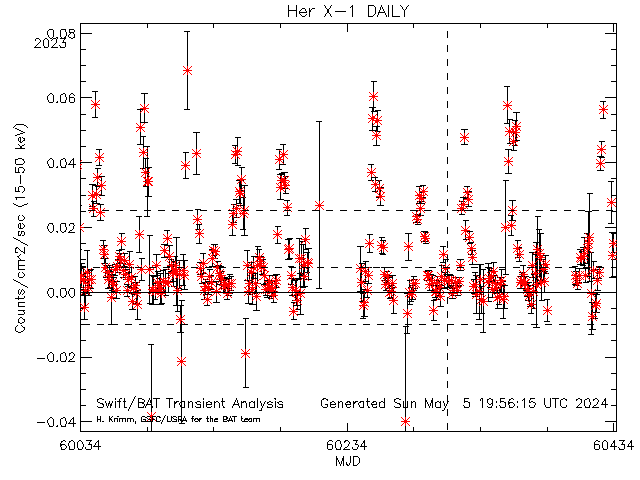
Dashed lines show average rate (and +/- 1 sigma standard deviation) for this source (derived from this plot)
[10004] Her X-1 RA= 254.457 degs; Dec= 35.3420 degs
Daily light curves: FITS version ASCII version
Orbit light curves: FITS version ASCII version
Full mission light curve
-------------------------------------------------------------------------------------------------------------------------------------------------------------------
Dashed lines show average rate (and +/- 1 sigma standard deviation) for this source (derived from this plot)
[20156] ESO 103-035 RA= 279.585 degs; Dec= -65.4281 degs
Daily light curves: FITS version ASCII version
Orbit light curves: FITS version ASCII version
Full mission light curve
-------------------------------------------------------------------------------------------------------------------------------------------------------------------

Dashed lines show average rate (and +/- 1 sigma standard deviation) for this source (derived from this plot)
[33880] IGR J17586-2129 RA= 269.644 degs; Dec= -21.3890 degs
Daily light curves: FITS version ASCII version
Orbit light curves: FITS version ASCII version
Full mission light curve
-------------------------------------------------------------------------------------------------------------------------------------------------------------------
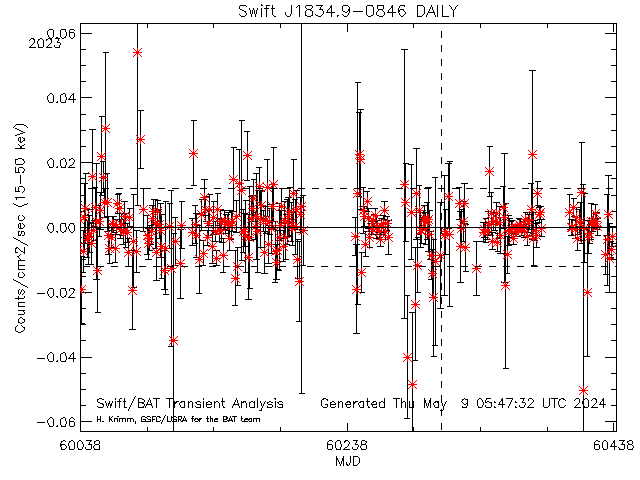
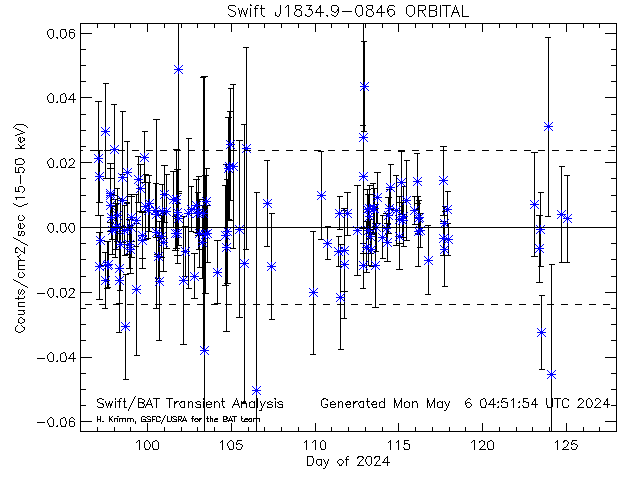
Dashed lines show average rate (and +/- 1 sigma standard deviation) for this source (derived from this plot)
[33808] Swift J1834.9-0846 RA= 278.717 degs; Dec= -8.76600 degs
Daily light curves: FITS version ASCII version
Orbit light curves: FITS version ASCII version
Full mission light curve
-------------------------------------------------------------------------------------------------------------------------------------------------------------------
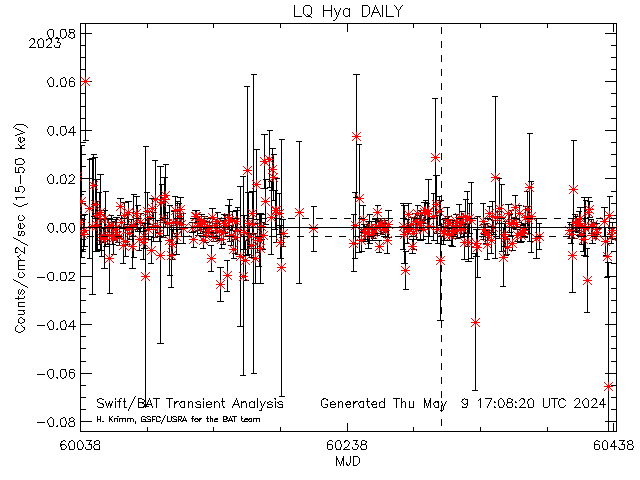
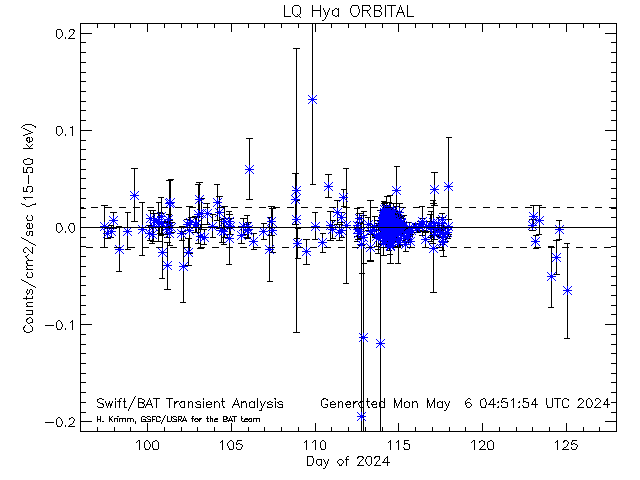
Dashed lines show average rate (and +/- 1 sigma standard deviation) for this source (derived from this plot)
[30172] LQ Hya RA= 143.107 degs; Dec= -11.1847 degs
Daily light curves: FITS version ASCII version
Orbit light curves: FITS version ASCII version
Full mission light curve
-------------------------------------------------------------------------------------------------------------------------------------------------------------------
Dashed lines show average rate (and +/- 1 sigma standard deviation) for this source (derived from this plot)
[33057] 4C 39.25 RA= 141.763 degs; Dec= 39.0391 degs
Daily light curves: FITS version ASCII version
Orbit light curves: FITS version ASCII version
Full mission light curve
-------------------------------------------------------------------------------------------------------------------------------------------------------------------
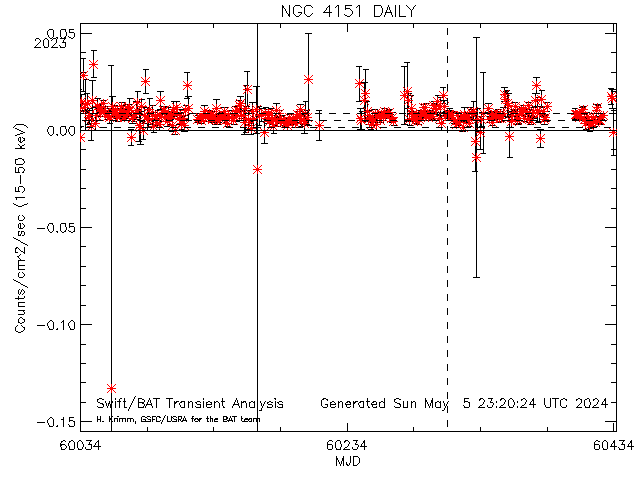
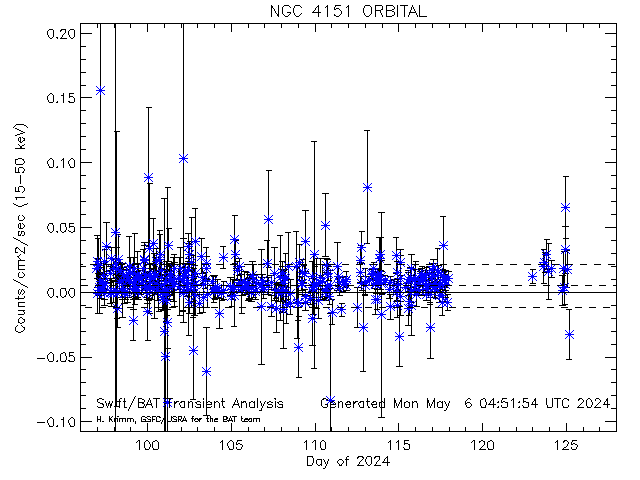
Dashed lines show average rate (and +/- 1 sigma standard deviation) for this source (derived from this plot)
[10092] NGC 4151 RA= 182.633 degs; Dec= 39.4060 degs
Daily light curves: FITS version ASCII version
Orbit light curves: FITS version ASCII version
Full mission light curve
-------------------------------------------------------------------------------------------------------------------------------------------------------------------
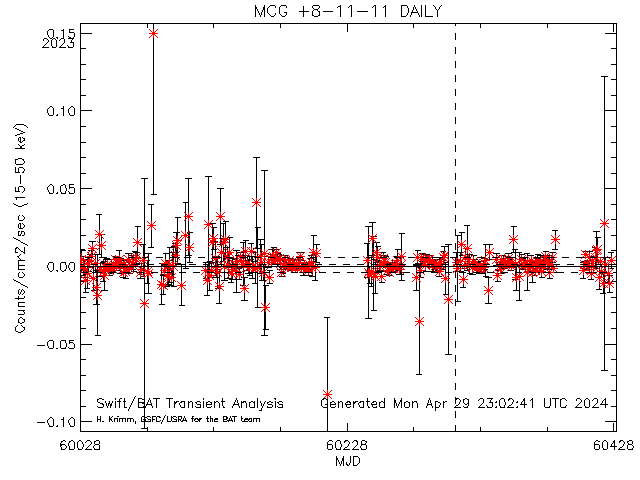
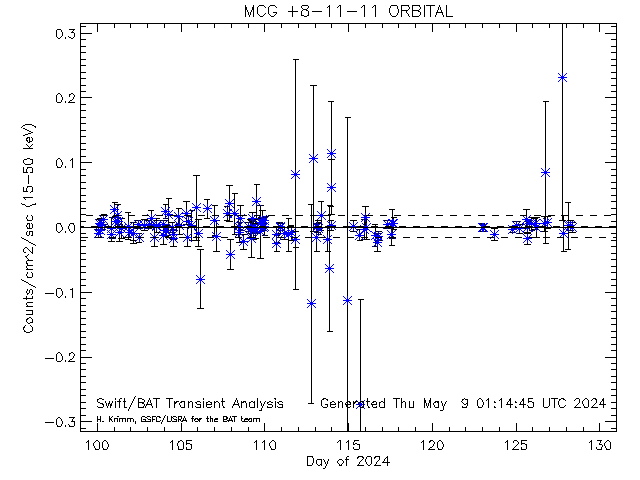
Dashed lines show average rate (and +/- 1 sigma standard deviation) for this source (derived from this plot)
[10082] MCG +8-11-11 RA= 88.7230 degs; Dec= 46.4390 degs
Daily light curves: FITS version ASCII version
Orbit light curves: FITS version ASCII version
Full mission light curve
-------------------------------------------------------------------------------------------------------------------------------------------------------------------
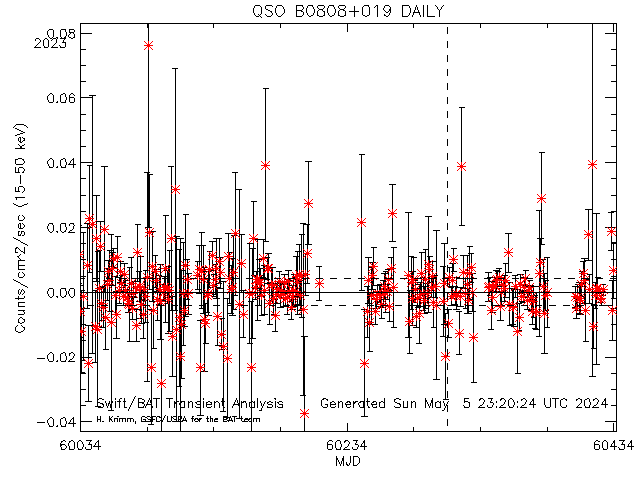
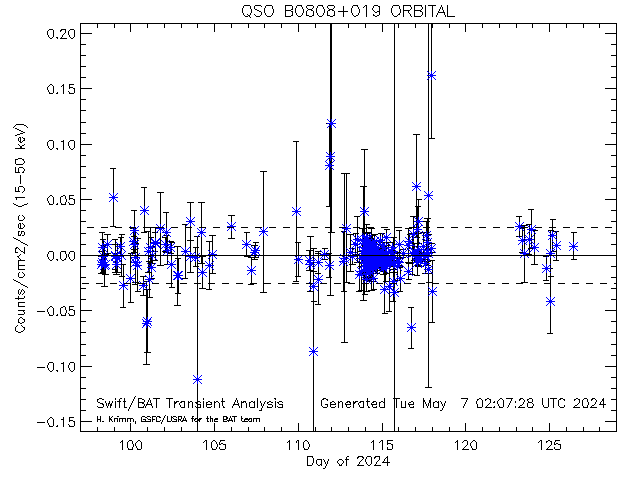
Dashed lines show average rate (and +/- 1 sigma standard deviation) for this source (derived from this plot)
[33048] QSO B0808+019 RA= 122.861 degs; Dec= 1.78117 degs
Daily light curves: FITS version ASCII version
Orbit light curves: FITS version ASCII version
Full mission light curve
-------------------------------------------------------------------------------------------------------------------------------------------------------------------
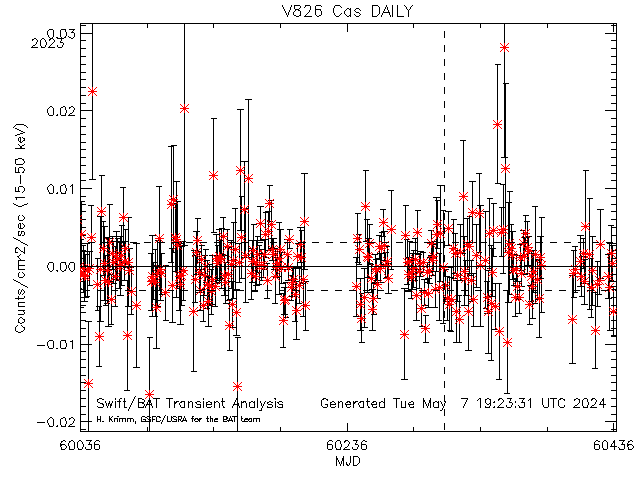
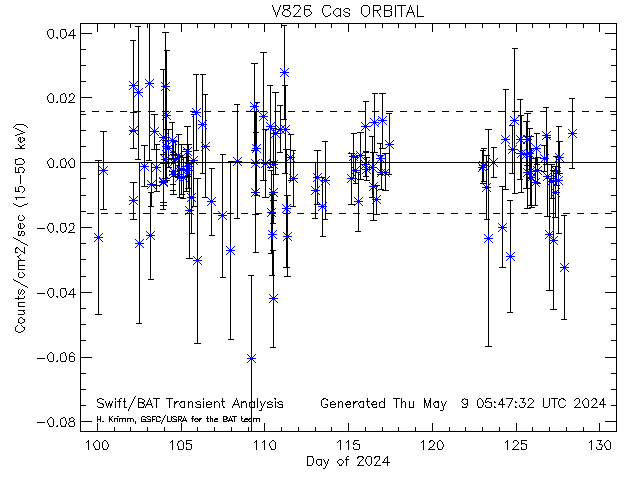
Dashed lines show average rate (and +/- 1 sigma standard deviation) for this source (derived from this plot)
[20065] V826 Cas RA= 8.76146 degs; Dec= 61.3173 degs
Daily light curves: FITS version ASCII version
Orbit light curves: FITS version ASCII version
Full mission light curve
-------------------------------------------------------------------------------------------------------------------------------------------------------------------
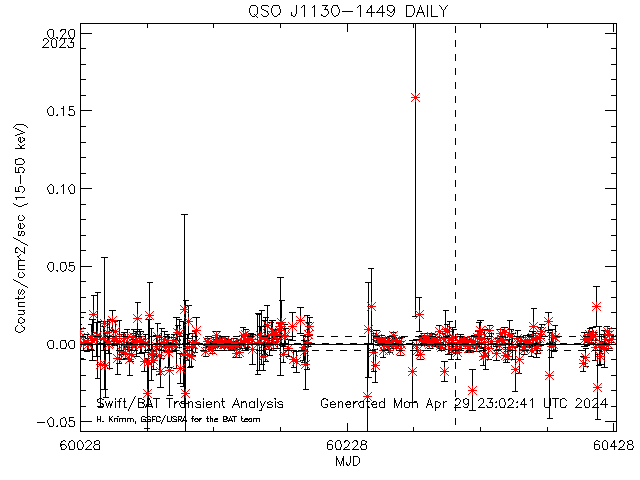
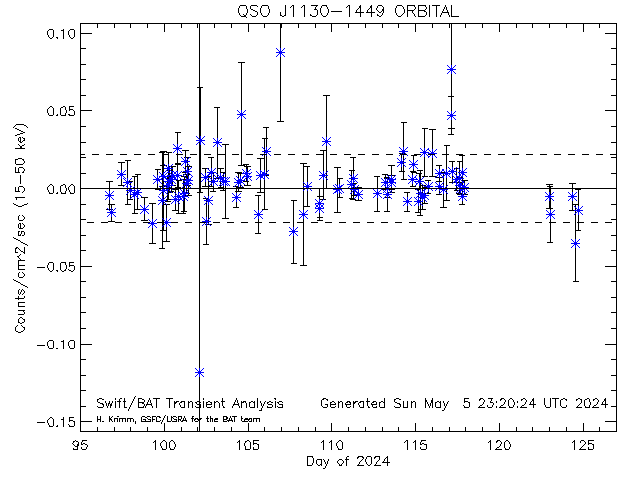
Dashed lines show average rate (and +/- 1 sigma standard deviation) for this source (derived from this plot)
[33065] QSO J1130-1449 RA= 172.529 degs; Dec= -14.8243 degs
Daily light curves: FITS version ASCII version
Orbit light curves: FITS version ASCII version
Full mission light curve
-------------------------------------------------------------------------------------------------------------------------------------------------------------------
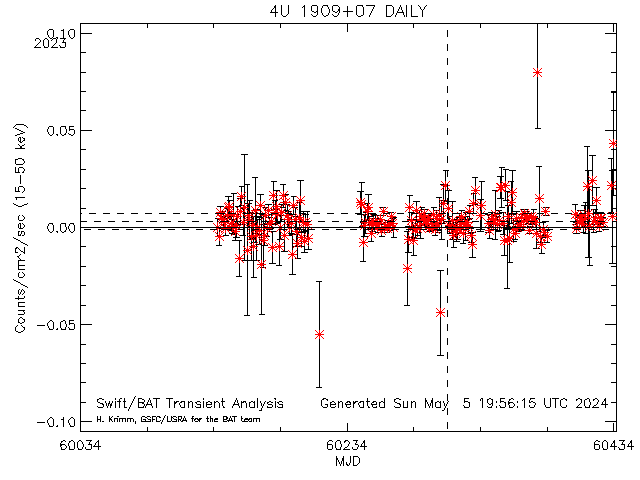
Dashed lines show average rate (and +/- 1 sigma standard deviation) for this source (derived from this plot)
[10561] 4U 1909+07 RA= 287.701 degs; Dec= 7.59800 degs
Daily light curves: FITS version ASCII version
Orbit light curves: FITS version ASCII version
Full mission light curve
-------------------------------------------------------------------------------------------------------------------------------------------------------------------
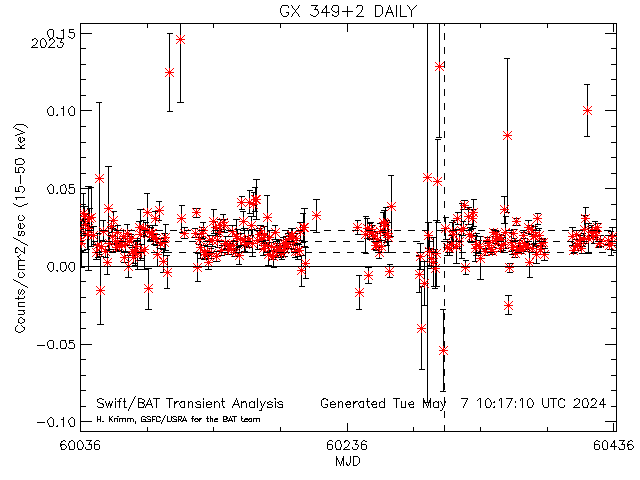
Dashed lines show average rate (and +/- 1 sigma standard deviation) for this source (derived from this plot)
[10055] GX 349+2 RA= 256.435 degs; Dec= -36.4230 degs
Daily light curves: FITS version ASCII version
Orbit light curves: FITS version ASCII version
Full mission light curve
-------------------------------------------------------------------------------------------------------------------------------------------------------------------
Dashed lines show average rate (and +/- 1 sigma standard deviation) for this source (derived from this plot)
[10027] X Per RA= 58.8460 degs; Dec= 31.0460 degs
Daily light curves: FITS version ASCII version
Orbit light curves: FITS version ASCII version
Full mission light curve
-------------------------------------------------------------------------------------------------------------------------------------------------------------------
Dashed lines show average rate (and +/- 1 sigma standard deviation) for this source (derived from this plot)
[30171] BF Lyn RA= 140.608 degs; Dec= 40.2011 degs
Daily light curves: FITS version ASCII version
Orbit light curves: FITS version ASCII version
Full mission light curve
-------------------------------------------------------------------------------------------------------------------------------------------------------------------
Dashed lines show average rate (and +/- 1 sigma standard deviation) for this source (derived from this plot)
[10076] H 1820-303 RA= 275.919 degs; Dec= -30.3610 degs
Daily light curves: FITS version ASCII version
Orbit light curves: FITS version ASCII version
Full mission light curve
-------------------------------------------------------------------------------------------------------------------------------------------------------------------
Dashed lines show average rate (and +/- 1 sigma standard deviation) for this source (derived from this plot)
[34163] 4U 1730-22 RA= 263.487 degs; Dec= -22.0353 degs
Daily light curves: FITS version ASCII version
Orbit light curves: FITS version ASCII version
Full mission light curve
-------------------------------------------------------------------------------------------------------------------------------------------------------------------
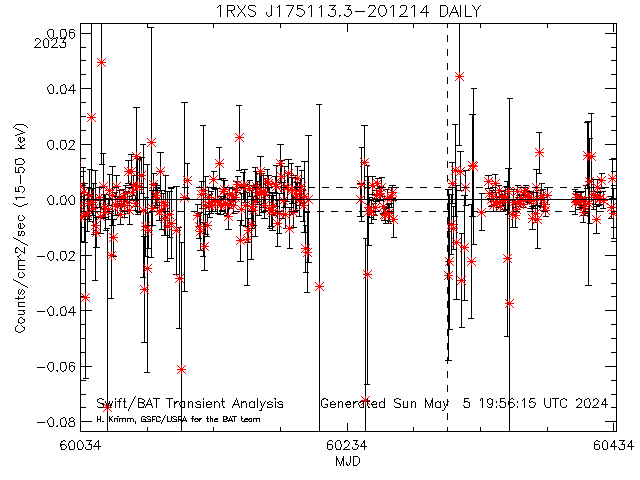
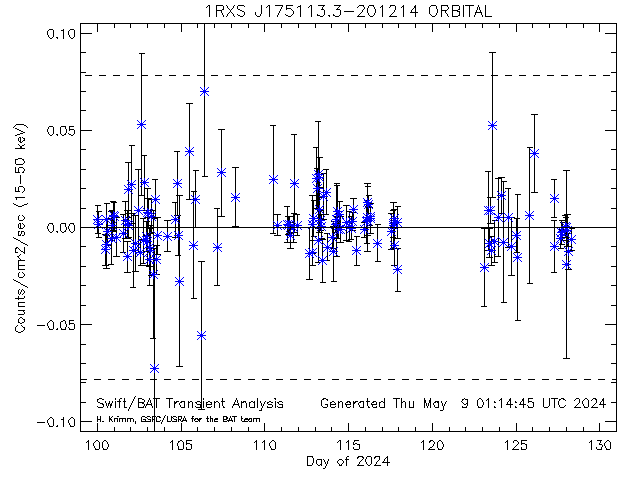
Dashed lines show average rate (and +/- 1 sigma standard deviation) for this source (derived from this plot)
[20180] 1RXS J175113.3-201214 RA= 267.806 degs; Dec= -20.2040 degs
Daily light curves: FITS version ASCII version
Orbit light curves: FITS version ASCII version
Full mission light curve
-------------------------------------------------------------------------------------------------------------------------------------------------------------------
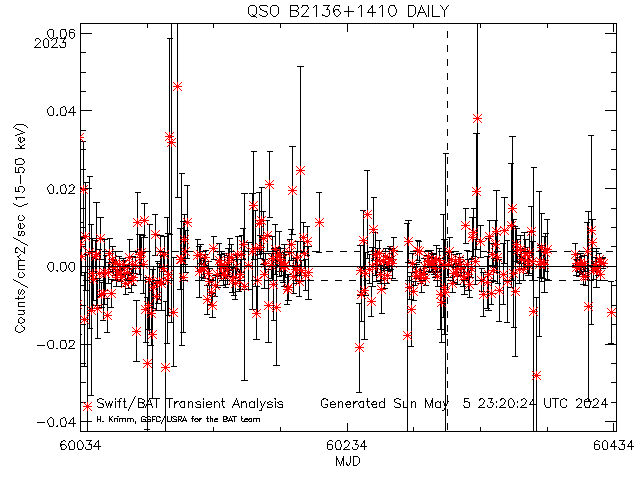
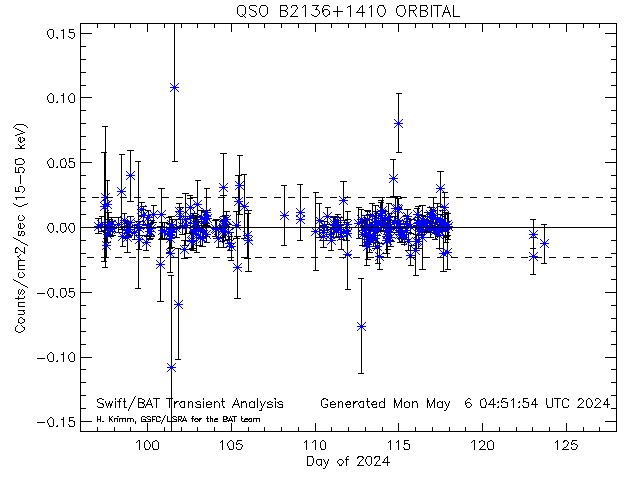
Dashed lines show average rate (and +/- 1 sigma standard deviation) for this source (derived from this plot)
[33118] QSO B2136+1410 RA= 324.755 degs; Dec= 14.3933 degs
Daily light curves: FITS version ASCII version
Orbit light curves: FITS version ASCII version
Full mission light curve
-------------------------------------------------------------------------------------------------------------------------------------------------------------------
Dashed lines show average rate (and +/- 1 sigma standard deviation) for this source (derived from this plot)
[33722] QSO B0917+449 RA= 140.243 degs; Dec= 44.6980 degs
Daily light curves: FITS version ASCII version
Orbit light curves: FITS version ASCII version
Full mission light curve
-------------------------------------------------------------------------------------------------------------------------------------------------------------------

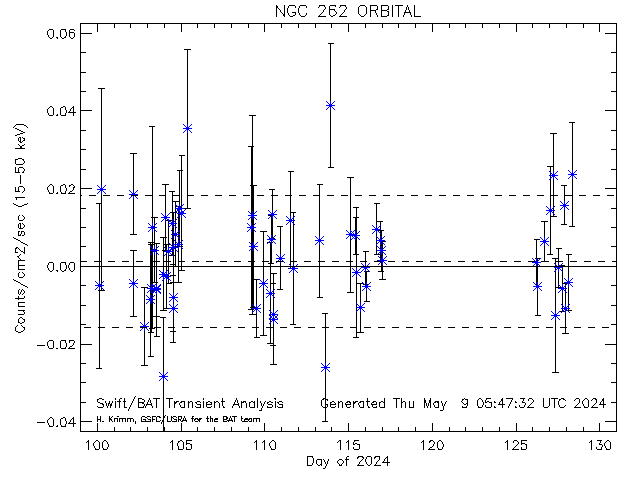
Dashed lines show average rate (and +/- 1 sigma standard deviation) for this source (derived from this plot)
[20066] NGC 262 RA= 12.1964 degs; Dec= 31.9570 degs
Daily light curves: FITS version ASCII version
Orbit light curves: FITS version ASCII version
Full mission light curve
-------------------------------------------------------------------------------------------------------------------------------------------------------------------
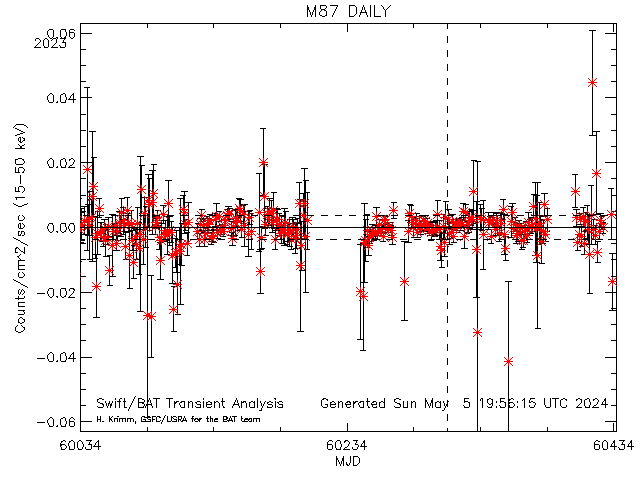
Dashed lines show average rate (and +/- 1 sigma standard deviation) for this source (derived from this plot)
[33072] M87 RA= 187.706 degs; Dec= 12.3911 degs
Daily light curves: FITS version ASCII version
Orbit light curves: FITS version ASCII version
Full mission light curve
-------------------------------------------------------------------------------------------------------------------------------------------------------------------
Dashed lines show average rate (and +/- 1 sigma standard deviation) for this source (derived from this plot)
[33842] 3C 207 RA= 130.198 degs; Dec= 13.2060 degs
Daily light curves: FITS version ASCII version
Orbit light curves: FITS version ASCII version
Full mission light curve
-------------------------------------------------------------------------------------------------------------------------------------------------------------------
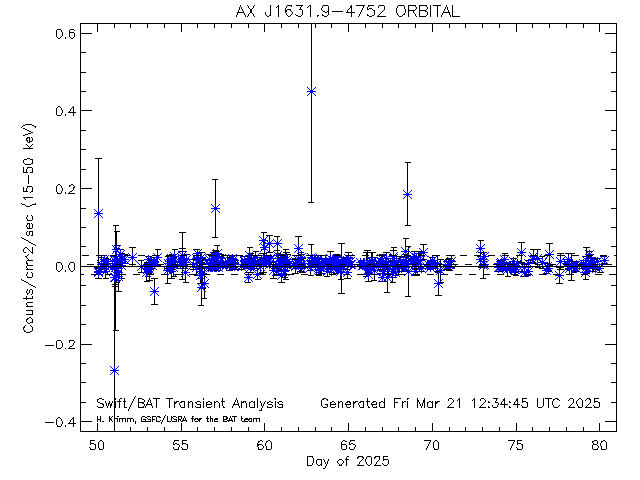
Dashed lines show average rate (and +/- 1 sigma standard deviation) for this source (derived from this plot)
[20010] AX J1631.9-4752 RA= 248.008 degs; Dec= -47.8740 degs
Daily light curves: FITS version ASCII version
Orbit light curves: FITS version ASCII version
Full mission light curve
-------------------------------------------------------------------------------------------------------------------------------------------------------------------
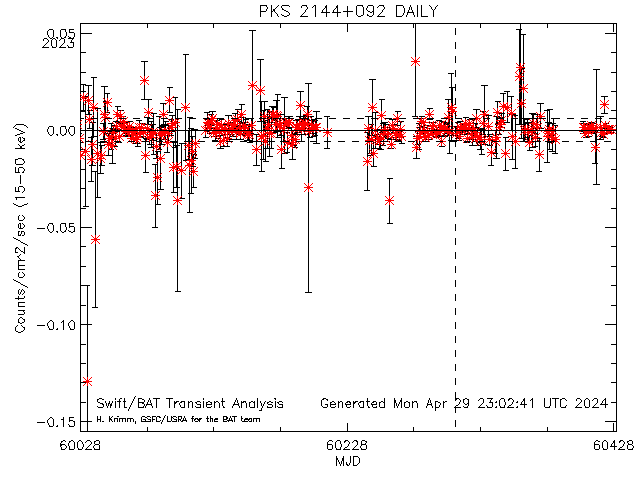
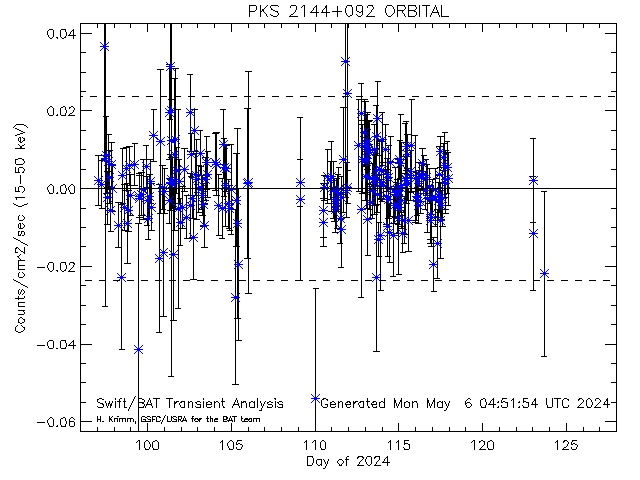
Dashed lines show average rate (and +/- 1 sigma standard deviation) for this source (derived from this plot)
[33832] PKS 2144+092 RA= 326.792 degs; Dec= 9.49600 degs
Daily light curves: FITS version ASCII version
Orbit light curves: FITS version ASCII version
Full mission light curve
-------------------------------------------------------------------------------------------------------------------------------------------------------------------
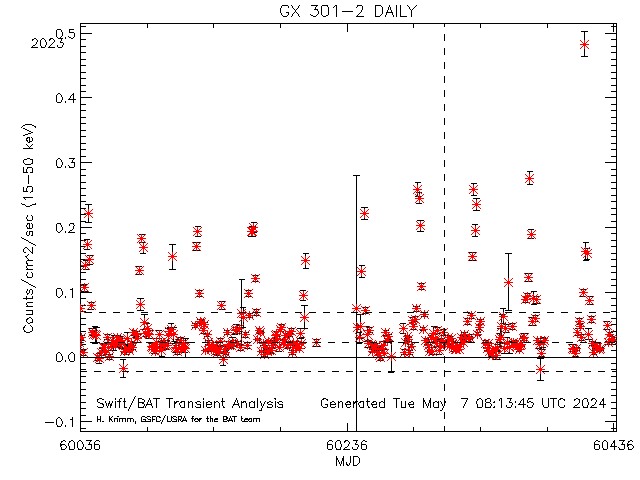
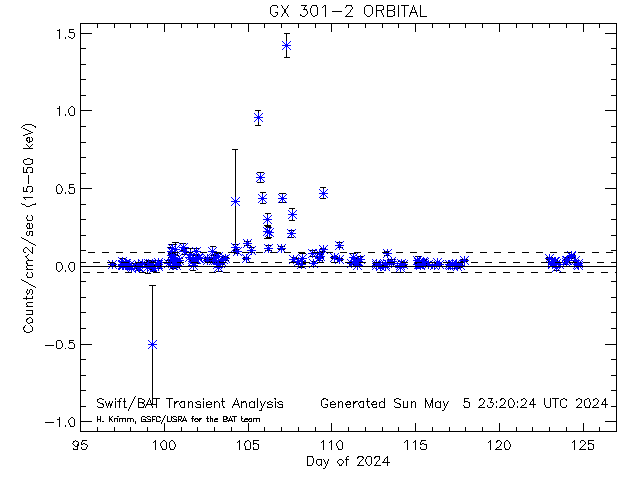
Dashed lines show average rate (and +/- 1 sigma standard deviation) for this source (derived from this plot)
[10051] GX 301-2 RA= 186.657 degs; Dec= -62.7700 degs
Daily light curves: FITS version ASCII version
Orbit light curves: FITS version ASCII version
Full mission light curve
-------------------------------------------------------------------------------------------------------------------------------------------------------------------
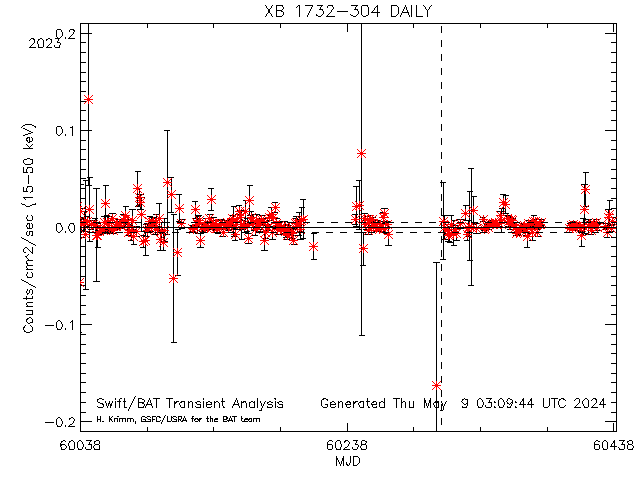
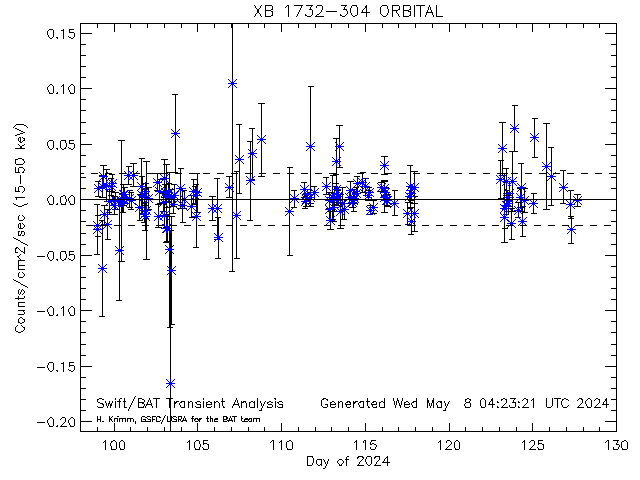
Dashed lines show average rate (and +/- 1 sigma standard deviation) for this source (derived from this plot)
[10121] XB 1732-304 RA= 263.950 degs; Dec= -30.4830 degs
Daily light curves: FITS version ASCII version
Orbit light curves: FITS version ASCII version
Full mission light curve
-------------------------------------------------------------------------------------------------------------------------------------------------------------------
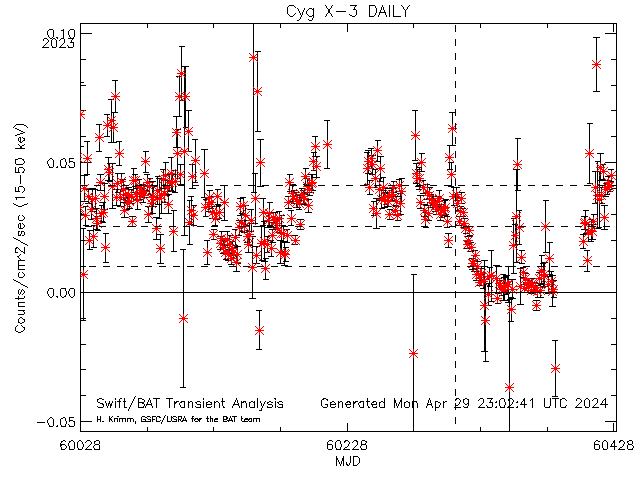
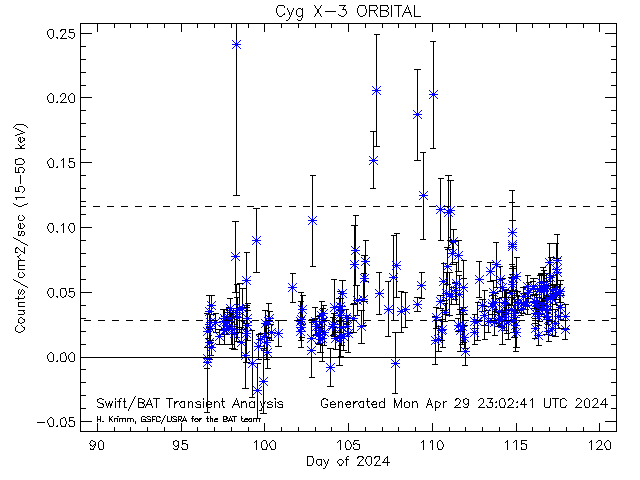
Dashed lines show average rate (and +/- 1 sigma standard deviation) for this source (derived from this plot)
[10038] Cyg X-3 RA= 308.107 degs; Dec= 40.9580 degs
Daily light curves: FITS version ASCII version
Orbit light curves: FITS version ASCII version
Full mission light curve
-------------------------------------------------------------------------------------------------------------------------------------------------------------------
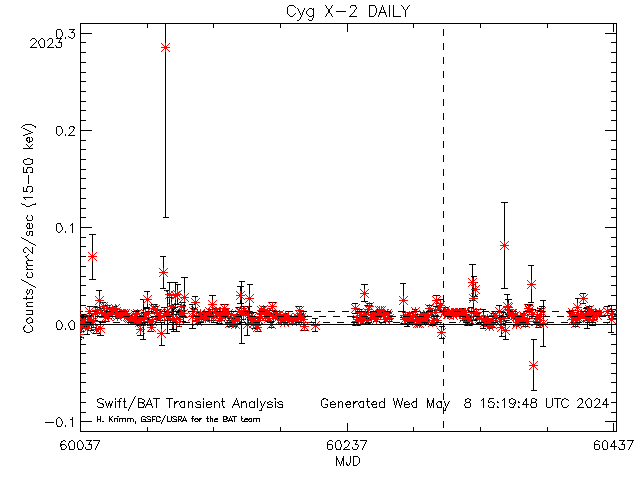

Dashed lines show average rate (and +/- 1 sigma standard deviation) for this source (derived from this plot)
[10037] Cyg X-2 RA= 326.172 degs; Dec= 38.3220 degs
Daily light curves: FITS version ASCII version
Orbit light curves: FITS version ASCII version
Full mission light curve
-------------------------------------------------------------------------------------------------------------------------------------------------------------------
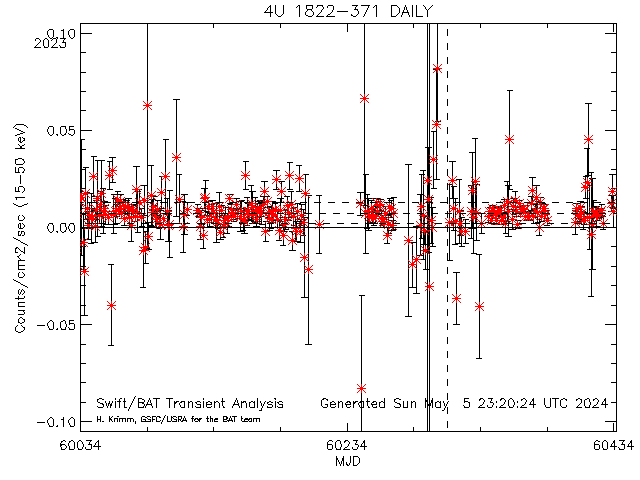
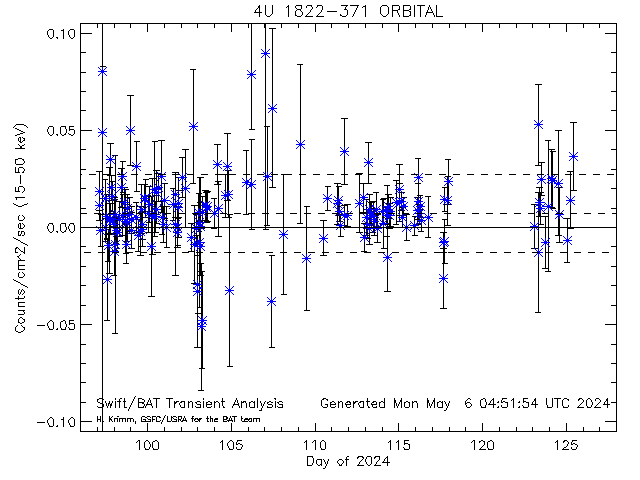
Dashed lines show average rate (and +/- 1 sigma standard deviation) for this source (derived from this plot)
[10593] 4U 1822-371 RA= 276.445 degs; Dec= -37.1053 degs
Daily light curves: FITS version ASCII version
Orbit light curves: FITS version ASCII version
Full mission light curve
-------------------------------------------------------------------------------------------------------------------------------------------------------------------
Dashed lines show average rate (and +/- 1 sigma standard deviation) for this source (derived from this plot)
[10350] Cir X-1 RA= 230.170 degs; Dec= -57.1670 degs
Daily light curves: FITS version ASCII version
Orbit light curves: FITS version ASCII version
Full mission light curve
-------------------------------------------------------------------------------------------------------------------------------------------------------------------
Dashed lines show average rate (and +/- 1 sigma standard deviation) for this source (derived from this plot)
[10035] Cen X-3 RA= 170.313 degs; Dec= -60.6230 degs
Daily light curves: FITS version ASCII version
Orbit light curves: FITS version ASCII version
Full mission light curve
-------------------------------------------------------------------------------------------------------------------------------------------------------------------
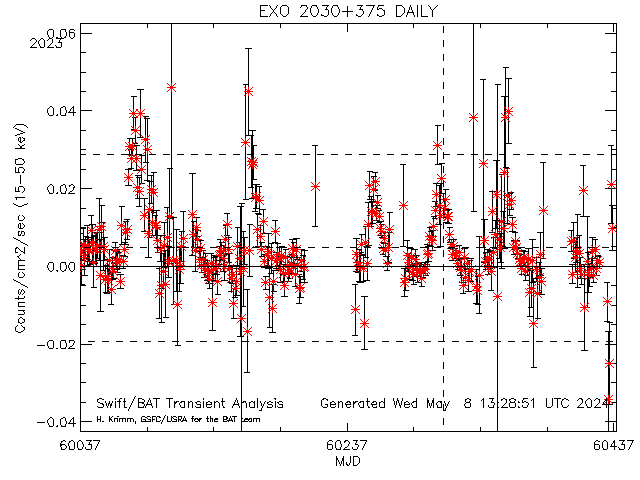
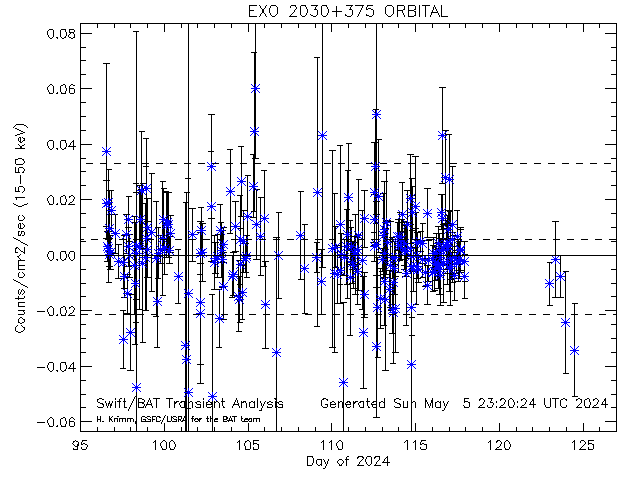
Dashed lines show average rate (and +/- 1 sigma standard deviation) for this source (derived from this plot)
[10526] EXO 2030+375 RA= 308.064 degs; Dec= 37.6370 degs
Daily light curves: FITS version ASCII version
Orbit light curves: FITS version ASCII version
Full mission light curve
-------------------------------------------------------------------------------------------------------------------------------------------------------------------
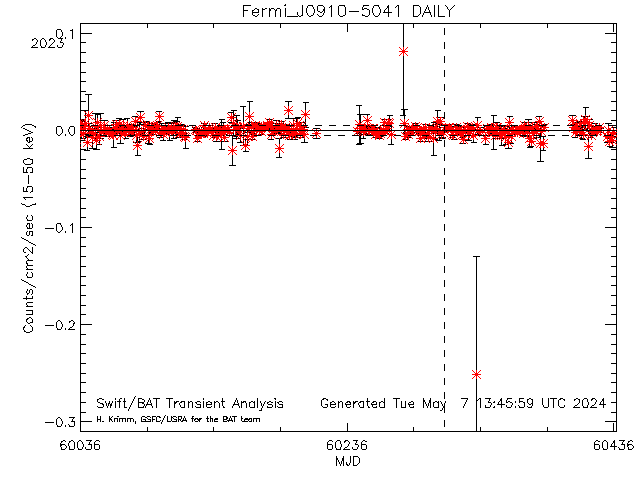
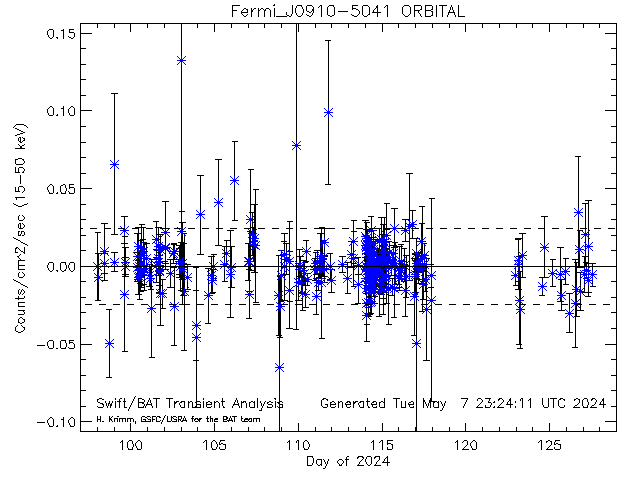
Dashed lines show average rate (and +/- 1 sigma standard deviation) for this source (derived from this plot)
[33711] Fermi_J0910-5041 RA= 137.690 degs; Dec= -50.7400 degs
Daily light curves: FITS version ASCII version
Orbit light curves: FITS version ASCII version
Full mission light curve
-------------------------------------------------------------------------------------------------------------------------------------------------------------------
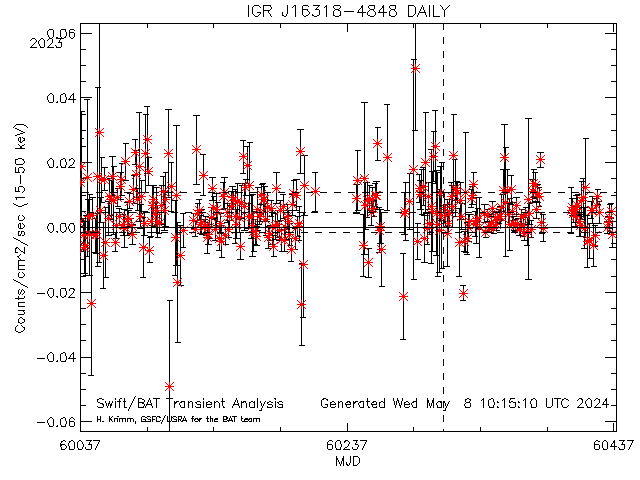
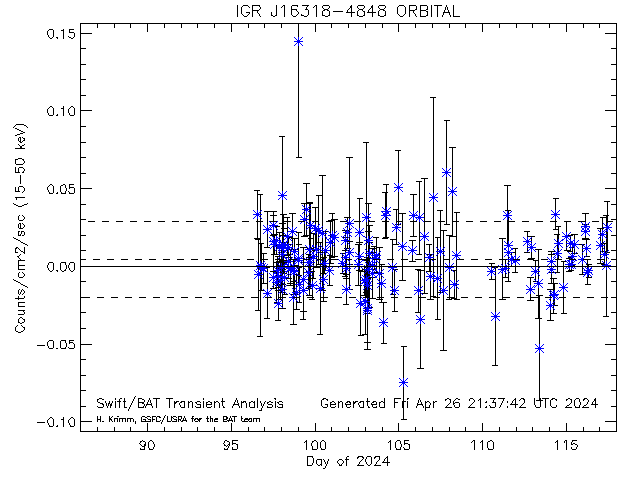
Dashed lines show average rate (and +/- 1 sigma standard deviation) for this source (derived from this plot)
[10560] IGR J16318-4848 RA= 247.949 degs; Dec= -48.8190 degs
Daily light curves: FITS version ASCII version
Orbit light curves: FITS version ASCII version
Full mission light curve
-------------------------------------------------------------------------------------------------------------------------------------------------------------------
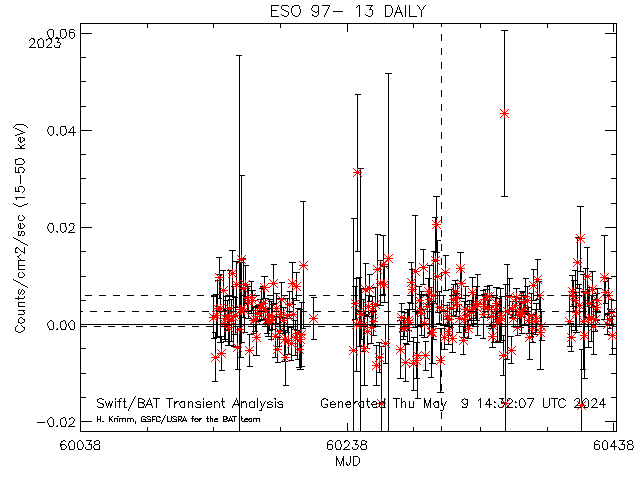
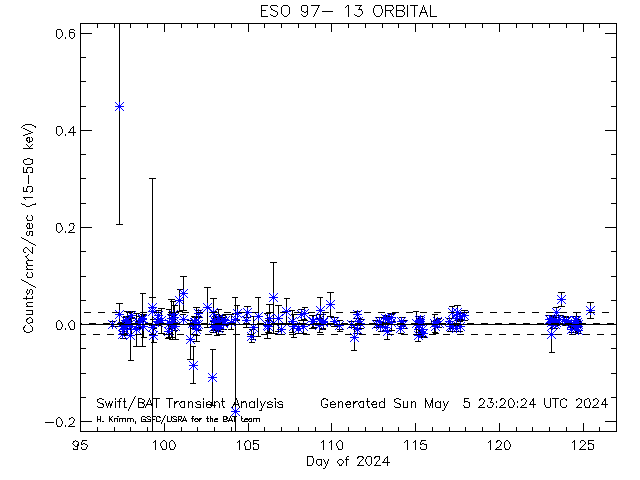
Dashed lines show average rate (and +/- 1 sigma standard deviation) for this source (derived from this plot)
[10573] ESO 97- 13 RA= 213.291 degs; Dec= -65.3390 degs
Daily light curves: FITS version ASCII version
Orbit light curves: FITS version ASCII version
Full mission light curve
-------------------------------------------------------------------------------------------------------------------------------------------------------------------
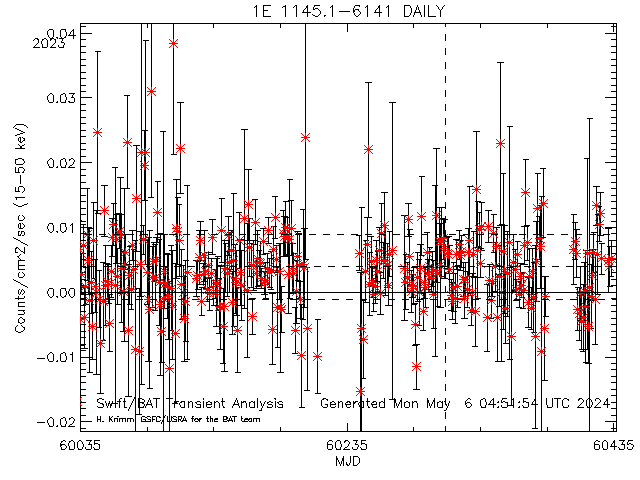
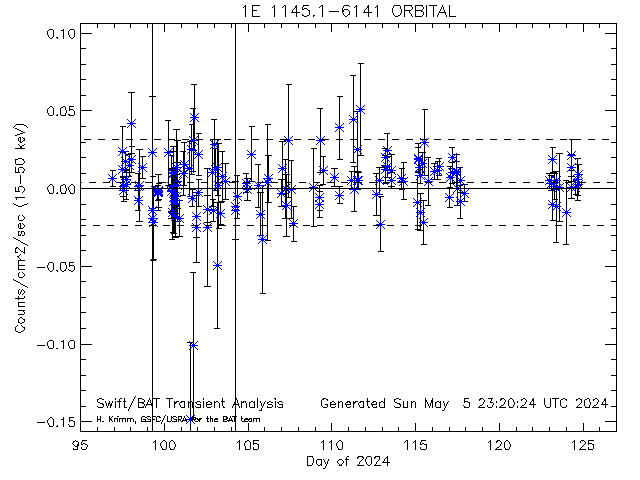
Dashed lines show average rate (and +/- 1 sigma standard deviation) for this source (derived from this plot)
[10559] 1E 1145.1-6141 RA= 176.869 degs; Dec= -61.9540 degs
Daily light curves: FITS version ASCII version
Orbit light curves: FITS version ASCII version
Full mission light curve
-------------------------------------------------------------------------------------------------------------------------------------------------------------------
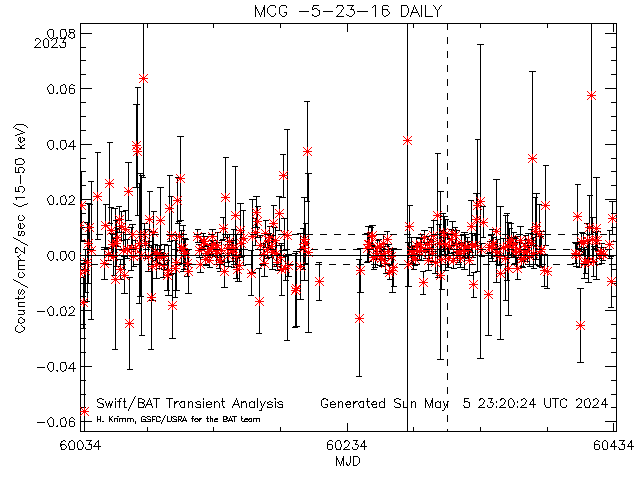
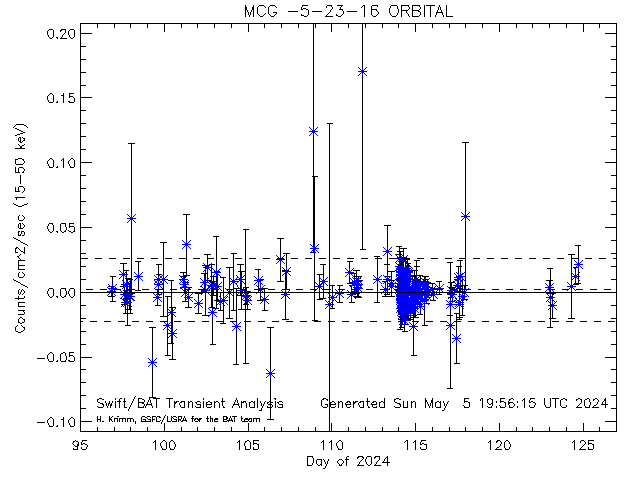
Dashed lines show average rate (and +/- 1 sigma standard deviation) for this source (derived from this plot)
[10083] MCG -5-23-16 RA= 146.917 degs; Dec= -30.9490 degs
Daily light curves: FITS version ASCII version
Orbit light curves: FITS version ASCII version
Full mission light curve
-------------------------------------------------------------------------------------------------------------------------------------------------------------------
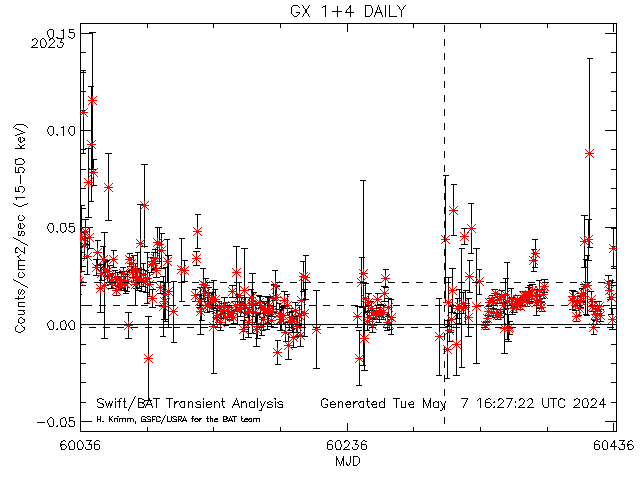
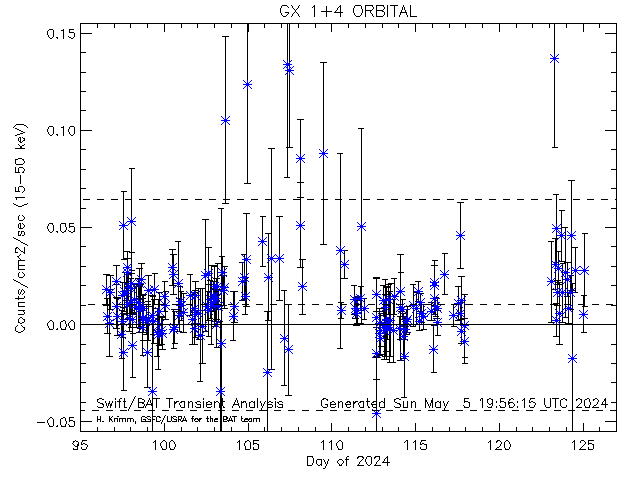
Dashed lines show average rate (and +/- 1 sigma standard deviation) for this source (derived from this plot)
[10008] GX 1+4 RA= 263.009 degs; Dec= -24.7460 degs
Daily light curves: FITS version ASCII version
Orbit light curves: FITS version ASCII version
Full mission light curve
-------------------------------------------------------------------------------------------------------------------------------------------------------------------
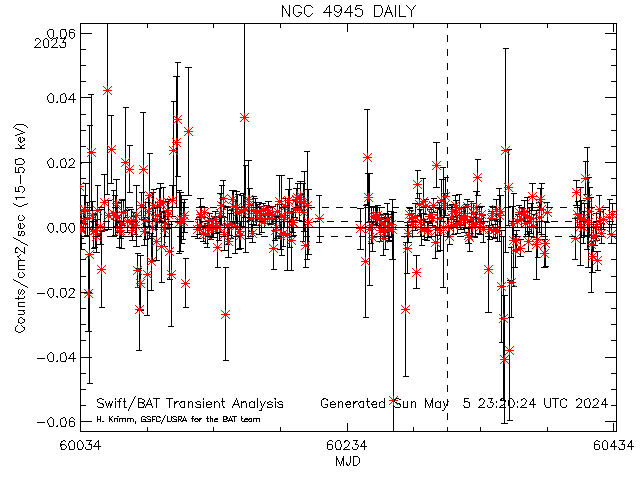
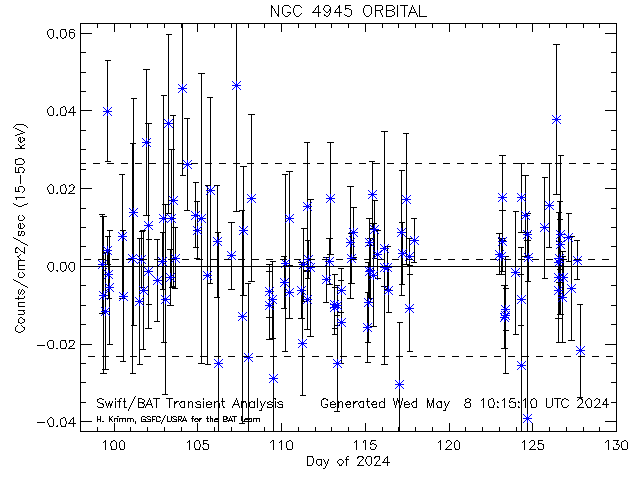
Dashed lines show average rate (and +/- 1 sigma standard deviation) for this source (derived from this plot)
[20135] NGC 4945 RA= 196.363 degs; Dec= -49.4680 degs
Daily light curves: FITS version ASCII version
Orbit light curves: FITS version ASCII version
Full mission light curve
-------------------------------------------------------------------------------------------------------------------------------------------------------------------
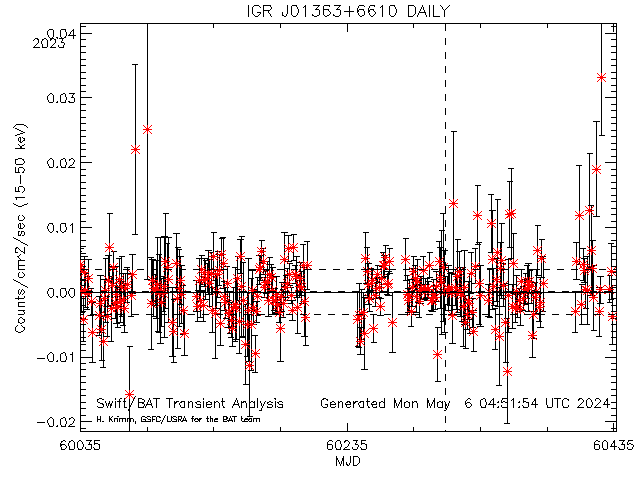
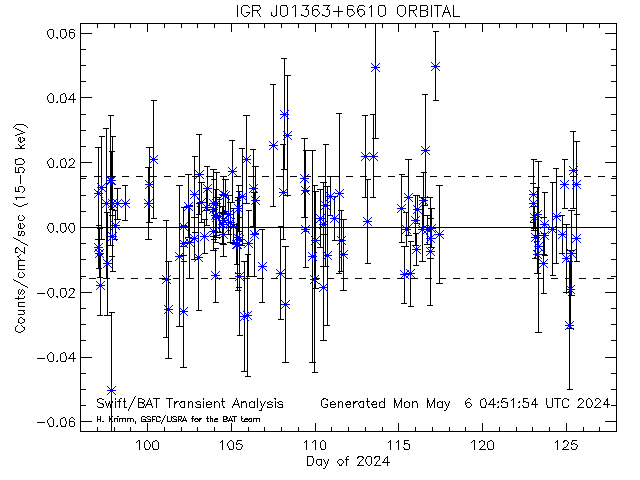
Dashed lines show average rate (and +/- 1 sigma standard deviation) for this source (derived from this plot)
[10601] IGR J01363+6610 RA= 24.0750 degs; Dec= 66.1750 degs
Daily light curves: FITS version ASCII version
Orbit light curves: FITS version ASCII version
Full mission light curve
-------------------------------------------------------------------------------------------------------------------------------------------------------------------
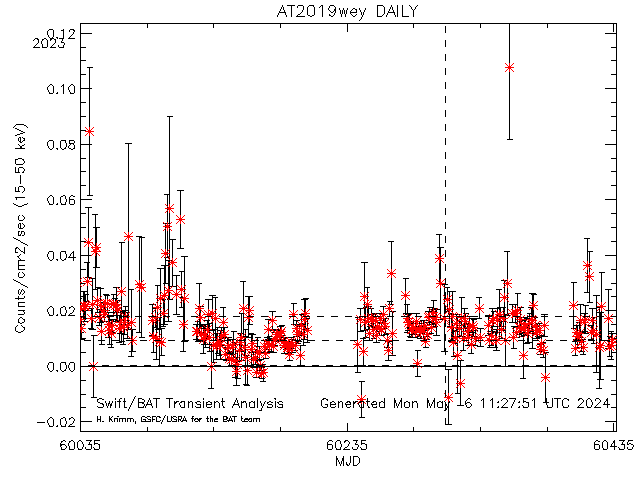
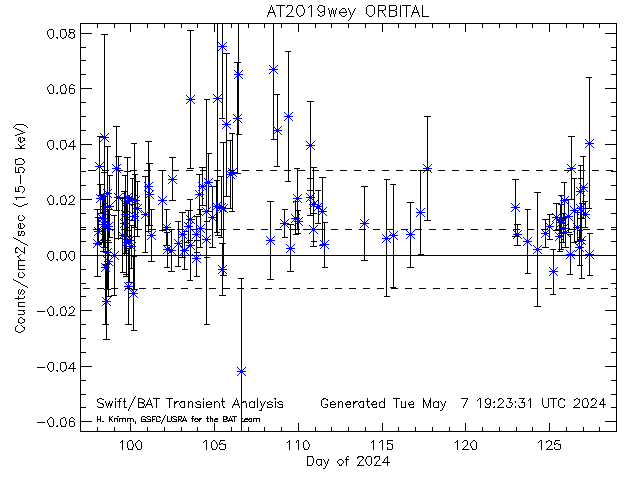
Dashed lines show average rate (and +/- 1 sigma standard deviation) for this source (derived from this plot)
[34139] AT2019wey RA= 68.8370 degs; Dec= 55.3740 degs
Daily light curves: FITS version ASCII version
Orbit light curves: FITS version ASCII version
Full mission light curve
-------------------------------------------------------------------------------------------------------------------------------------------------------------------
Dashed lines show average rate (and +/- 1 sigma standard deviation) for this source (derived from this plot)
[30150] Zeta And RA= 11.8346 degs; Dec= 24.2672 degs
Daily light curves: FITS version ASCII version
Orbit light curves: FITS version ASCII version
Full mission light curve
-------------------------------------------------------------------------------------------------------------------------------------------------------------------
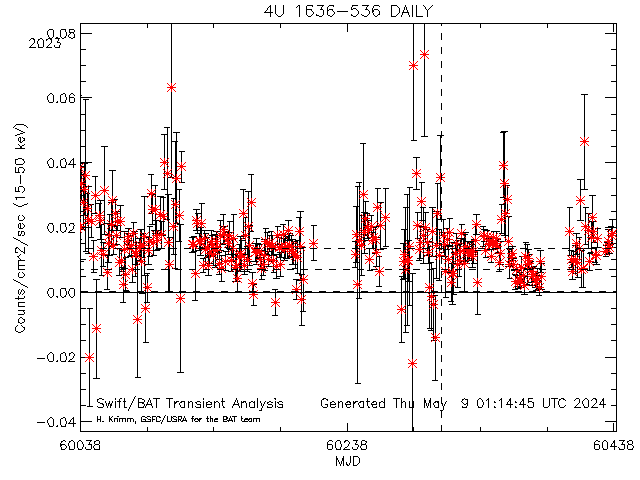
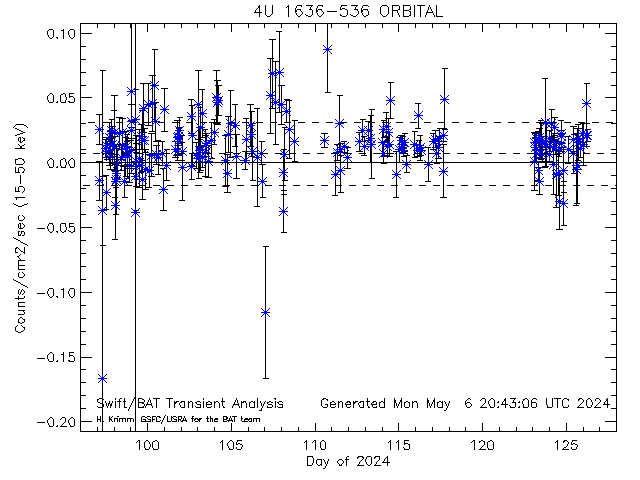
Dashed lines show average rate (and +/- 1 sigma standard deviation) for this source (derived from this plot)
[10069] 4U 1636-536 RA= 250.231 degs; Dec= -53.7510 degs
Daily light curves: FITS version ASCII version
Orbit light curves: FITS version ASCII version
Full mission light curve
-------------------------------------------------------------------------------------------------------------------------------------------------------------------
Dashed lines show average rate (and +/- 1 sigma standard deviation) for this source (derived from this plot)
[10034] Cen A RA= 201.365 degs; Dec= -43.0191 degs
Daily light curves: FITS version ASCII version
Orbit light curves: FITS version ASCII version
Full mission light curve
-------------------------------------------------------------------------------------------------------------------------------------------------------------------
Dashed lines show average rate (and +/- 1 sigma standard deviation) for this source (derived from this plot)
[10079] IC 4329A RA= 207.330 degs; Dec= -30.3090 degs
Daily light curves: FITS version ASCII version
Orbit light curves: FITS version ASCII version
Full mission light curve
-------------------------------------------------------------------------------------------------------------------------------------------------------------------
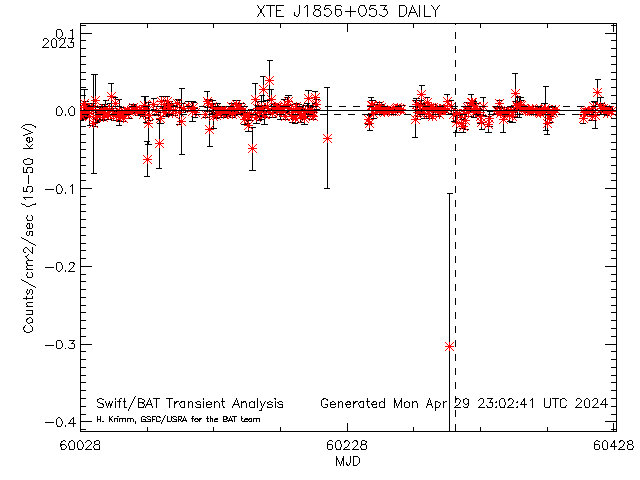
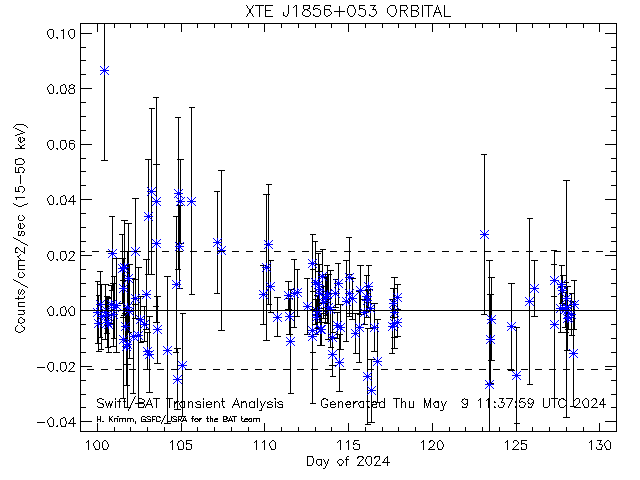
Dashed lines show average rate (and +/- 1 sigma standard deviation) for this source (derived from this plot)
[33592] XTE J1856+053 RA= 284.163 degs; Dec= 5.33000 degs
Daily light curves: FITS version ASCII version
Orbit light curves: FITS version ASCII version
Full mission light curve
-------------------------------------------------------------------------------------------------------------------------------------------------------------------
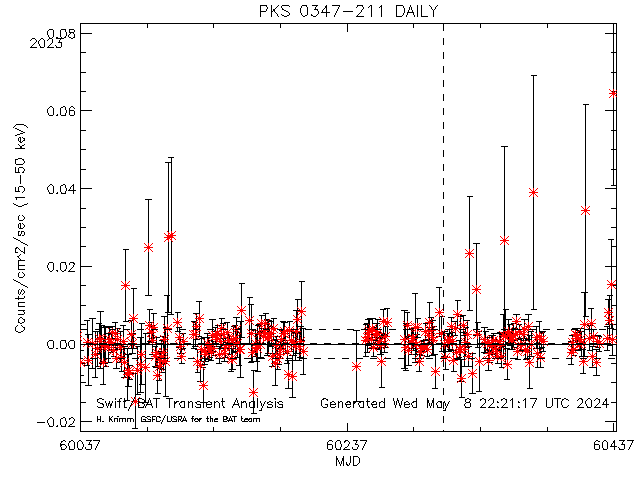
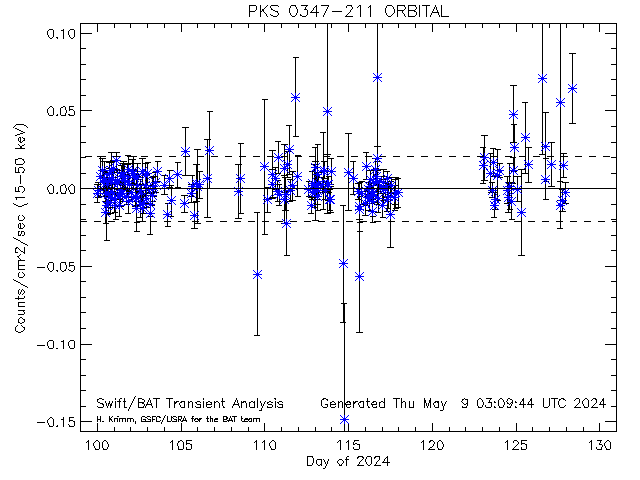
Dashed lines show average rate (and +/- 1 sigma standard deviation) for this source (derived from this plot)
[33746] PKS 0347-211 RA= 57.4910 degs; Dec= -21.0470 degs
Daily light curves: FITS version ASCII version
Orbit light curves: FITS version ASCII version
Full mission light curve
-------------------------------------------------------------------------------------------------------------------------------------------------------------------
Dashed lines show average rate (and +/- 1 sigma standard deviation) for this source (derived from this plot)
[30211] 7C 1156+2931 RA= 179.883 degs; Dec= 29.2455 degs
Daily light curves: FITS version ASCII version
Orbit light curves: FITS version ASCII version
Full mission light curve
-------------------------------------------------------------------------------------------------------------------------------------------------------------------
Dashed lines show average rate (and +/- 1 sigma standard deviation) for this source (derived from this plot)
[33622] NOVAPUPPIS 2007 RA= 124.075 degs; Dec= -34.2570 degs
Daily light curves: FITS version ASCII version
Orbit light curves: FITS version ASCII version
Full mission light curve
-------------------------------------------------------------------------------------------------------------------------------------------------------------------
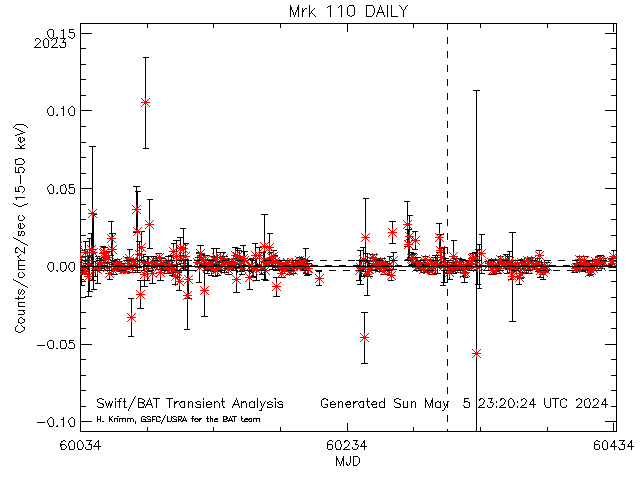
Dashed lines show average rate (and +/- 1 sigma standard deviation) for this source (derived from this plot)
[20116] Mrk 110 RA= 141.304 degs; Dec= 52.2863 degs
Daily light curves: FITS version ASCII version
Orbit light curves: FITS version ASCII version
Full mission light curve
-------------------------------------------------------------------------------------------------------------------------------------------------------------------
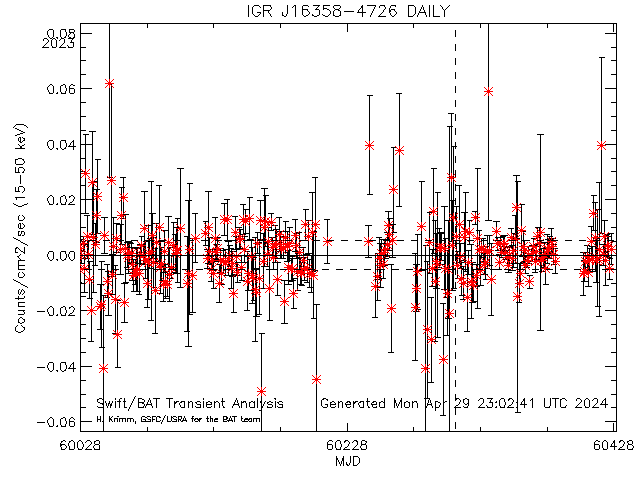
Dashed lines show average rate (and +/- 1 sigma standard deviation) for this source (derived from this plot)
[10630] IGR J16358-4726 RA= 248.974 degs; Dec= -47.4280 degs
Daily light curves: FITS version ASCII version
Orbit light curves: FITS version ASCII version
Full mission light curve
-------------------------------------------------------------------------------------------------------------------------------------------------------------------
Dashed lines show average rate (and +/- 1 sigma standard deviation) for this source (derived from this plot)
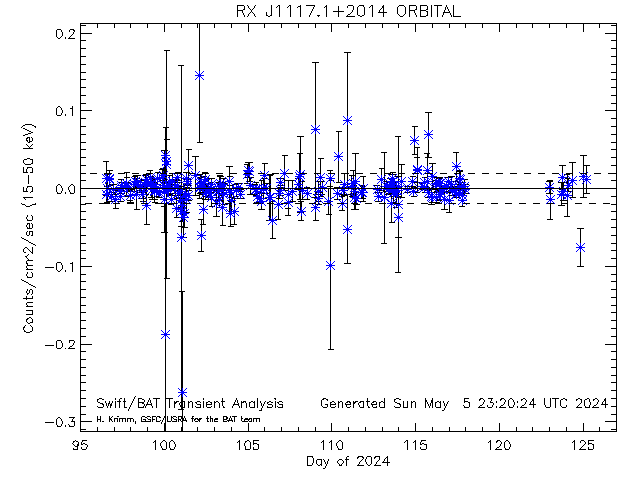
[20048] RX J1117.1+2014 RA= 169.276 degs; Dec= 20.2353 degs
Daily light curves: FITS version ASCII version
Orbit light curves: FITS version ASCII version
Full mission light curve
-------------------------------------------------------------------------------------------------------------------------------------------------------------------
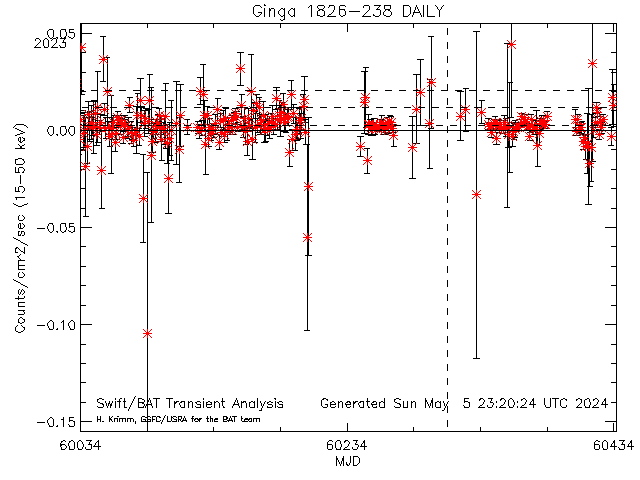
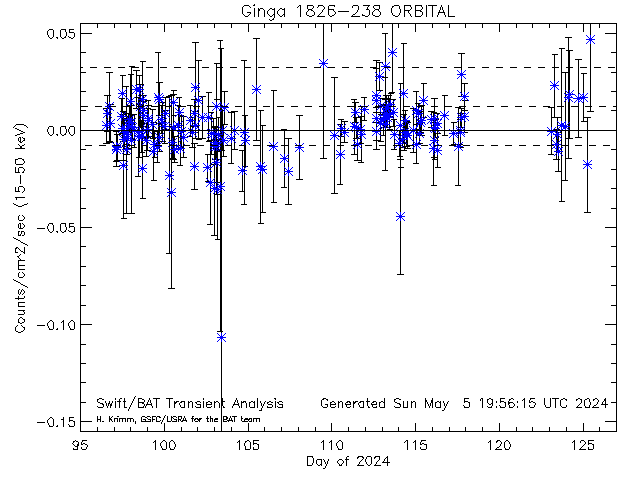
Dashed lines show average rate (and +/- 1 sigma standard deviation) for this source (derived from this plot)
[10311] Ginga 1826-238 RA= 277.368 degs; Dec= -23.7970 degs
Daily light curves: FITS version ASCII version
Orbit light curves: FITS version ASCII version
Full mission light curve
-------------------------------------------------------------------------------------------------------------------------------------------------------------------
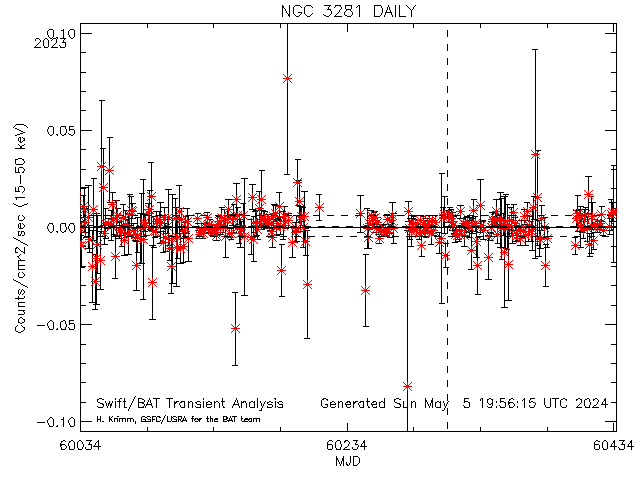
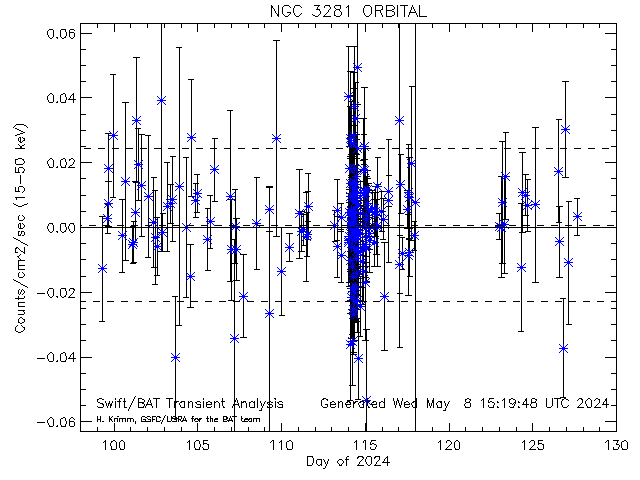
Dashed lines show average rate (and +/- 1 sigma standard deviation) for this source (derived from this plot)
[20120] NGC 3281 RA= 157.967 degs; Dec= -34.8537 degs
Daily light curves: FITS version ASCII version
Orbit light curves: FITS version ASCII version
Full mission light curve
-------------------------------------------------------------------------------------------------------------------------------------------------------------------
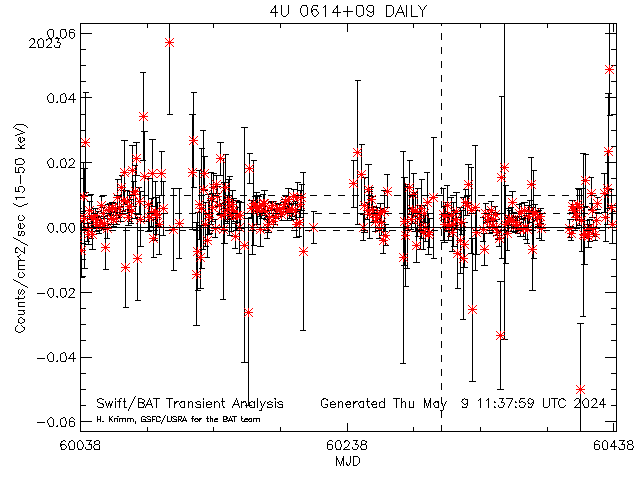
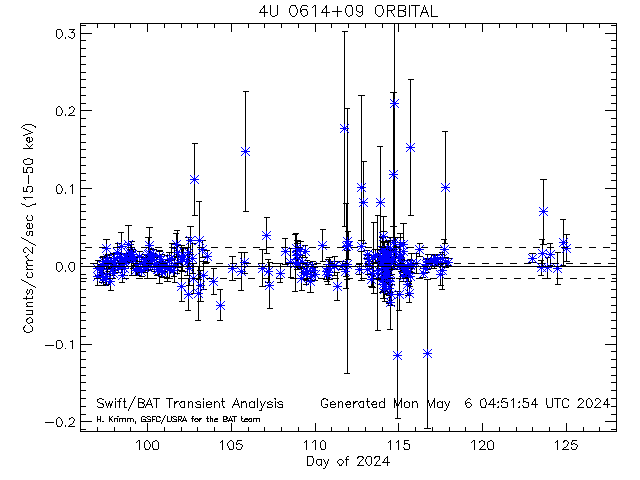
Dashed lines show average rate (and +/- 1 sigma standard deviation) for this source (derived from this plot)
[10307] 4U 0614+09 RA= 94.2800 degs; Dec= 9.13700 degs
Daily light curves: FITS version ASCII version
Orbit light curves: FITS version ASCII version
Full mission light curve
-------------------------------------------------------------------------------------------------------------------------------------------------------------------
Dashed lines show average rate (and +/- 1 sigma standard deviation) for this source (derived from this plot)
[33061] 4C 06.41 RA= 160.322 degs; Dec= 6.17137 degs
Daily light curves: FITS version ASCII version
Orbit light curves: FITS version ASCII version
Full mission light curve
-------------------------------------------------------------------------------------------------------------------------------------------------------------------
Dashed lines show average rate (and +/- 1 sigma standard deviation) for this source (derived from this plot)
[34008] T Pyx RA= 136.173 degs; Dec= -32.3800 degs
Daily light curves: FITS version ASCII version
Orbit light curves: FITS version ASCII version
Full mission light curve
-------------------------------------------------------------------------------------------------------------------------------------------------------------------
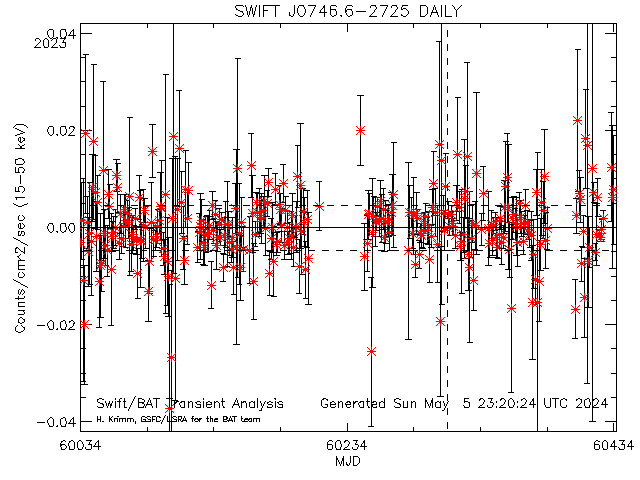
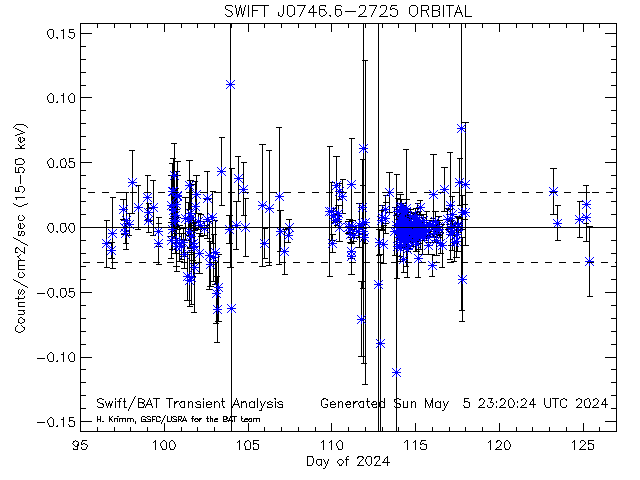
Dashed lines show average rate (and +/- 1 sigma standard deviation) for this source (derived from this plot)
[34050] SWIFT J0746.6-2725 RA= 116.654 degs; Dec= -27.4240 degs
Daily light curves: FITS version ASCII version
Orbit light curves: FITS version ASCII version
Full mission light curve
-------------------------------------------------------------------------------------------------------------------------------------------------------------------
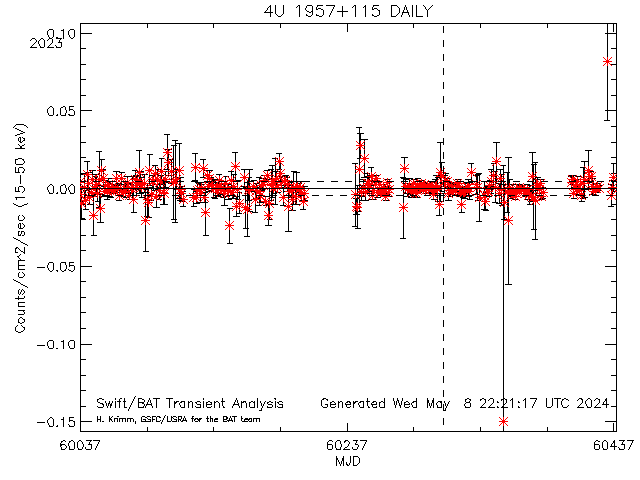
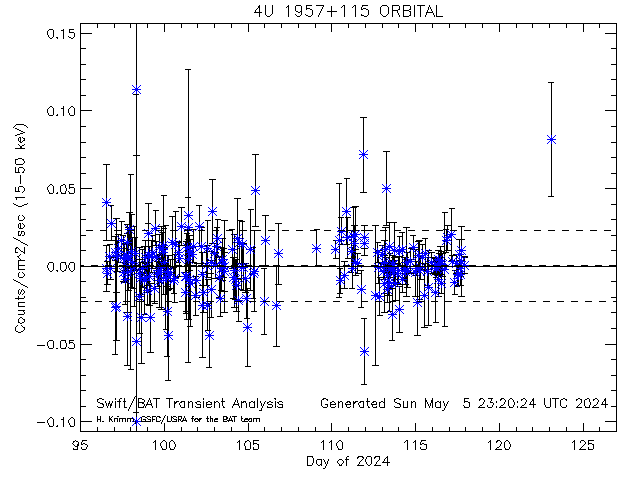
Dashed lines show average rate (and +/- 1 sigma standard deviation) for this source (derived from this plot)
[33875] 4U 1957+115 RA= 299.851 degs; Dec= 11.7090 degs
Daily light curves: FITS version ASCII version
Orbit light curves: FITS version ASCII version
Full mission light curve
-------------------------------------------------------------------------------------------------------------------------------------------------------------------
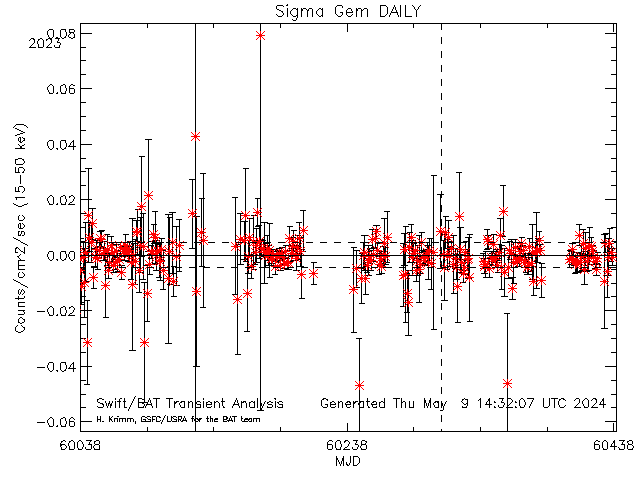
Dashed lines show average rate (and +/- 1 sigma standard deviation) for this source (derived from this plot)
[30169] Sigma Gem RA= 115.828 degs; Dec= 28.8836 degs
Daily light curves: FITS version ASCII version
Orbit light curves: FITS version ASCII version
Full mission light curve
-------------------------------------------------------------------------------------------------------------------------------------------------------------------
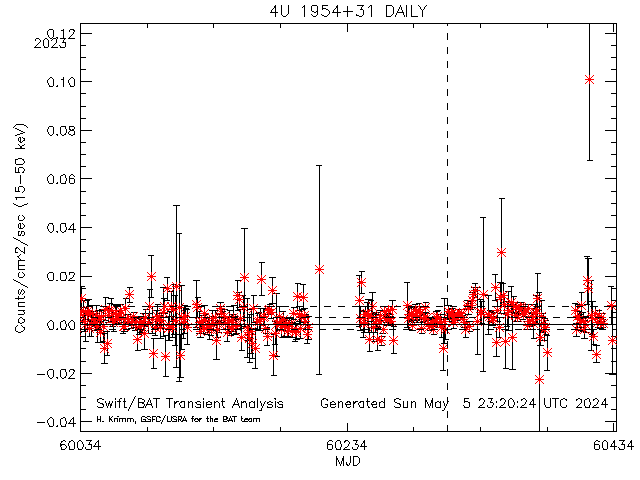
Dashed lines show average rate (and +/- 1 sigma standard deviation) for this source (derived from this plot)
[20003] 4U 1954+31 RA= 298.926 degs; Dec= 32.0970 degs
Daily light curves: FITS version ASCII version
Orbit light curves: FITS version ASCII version
Full mission light curve
-------------------------------------------------------------------------------------------------------------------------------------------------------------------
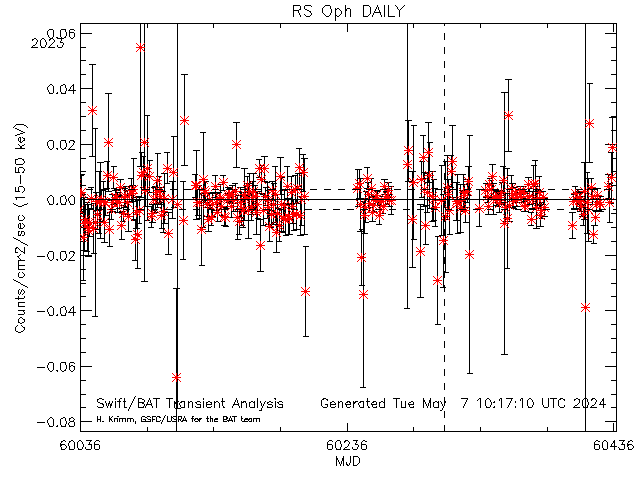
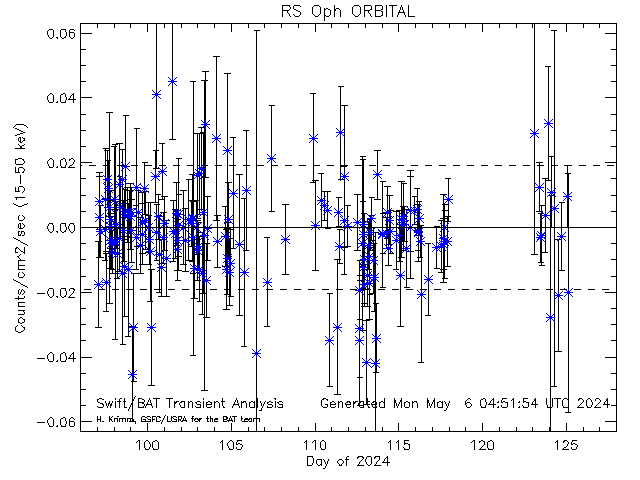
Dashed lines show average rate (and +/- 1 sigma standard deviation) for this source (derived from this plot)
[20019] RS Oph RA= 267.555 degs; Dec= -6.70800 degs
Daily light curves: FITS version ASCII version
Orbit light curves: FITS version ASCII version
Full mission light curve
-------------------------------------------------------------------------------------------------------------------------------------------------------------------
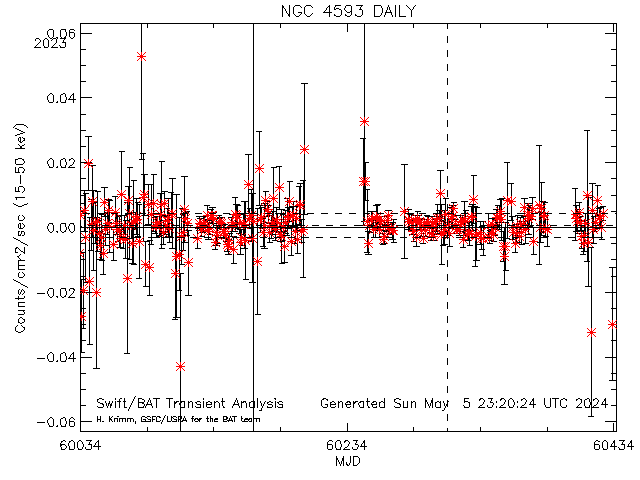
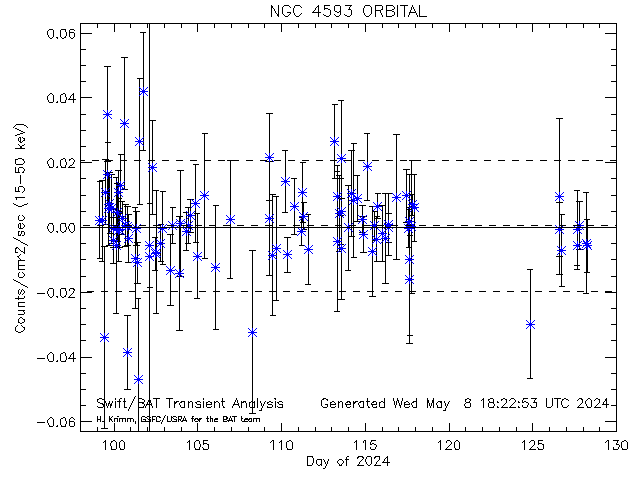
Dashed lines show average rate (and +/- 1 sigma standard deviation) for this source (derived from this plot)
[20132] NGC 4593 RA= 189.914 degs; Dec= -5.34425 degs
Daily light curves: FITS version ASCII version
Orbit light curves: FITS version ASCII version
Full mission light curve
-------------------------------------------------------------------------------------------------------------------------------------------------------------------
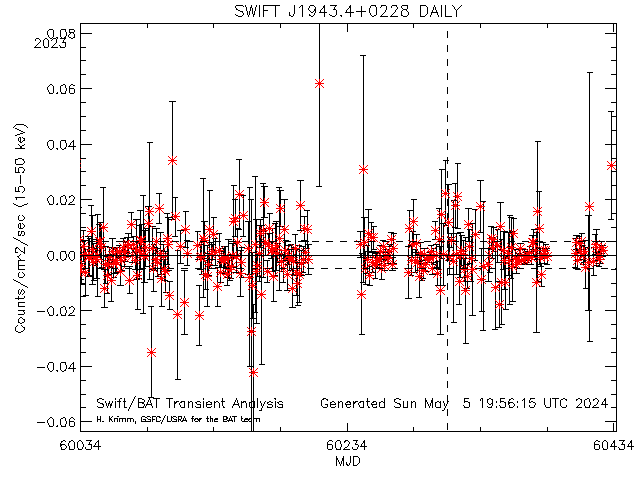
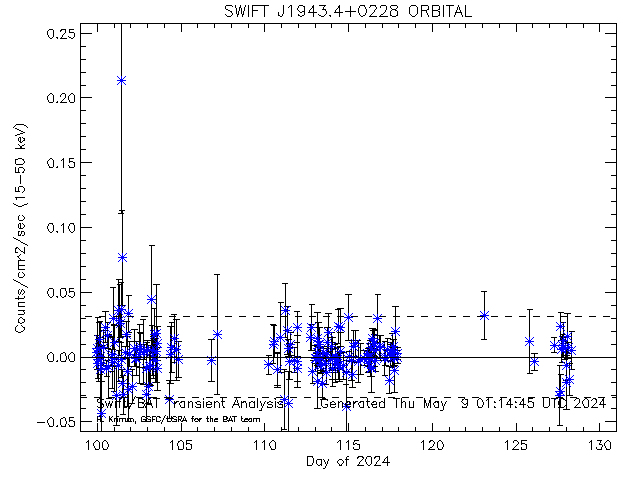
Dashed lines show average rate (and +/- 1 sigma standard deviation) for this source (derived from this plot)
[34049] SWIFT J1943.4+0228 RA= 295.892 degs; Dec= 2.46500 degs
Daily light curves: FITS version ASCII version
Orbit light curves: FITS version ASCII version
Full mission light curve
-------------------------------------------------------------------------------------------------------------------------------------------------------------------
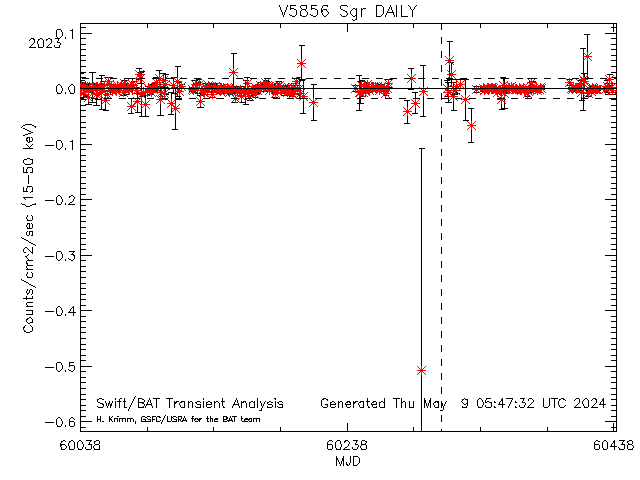
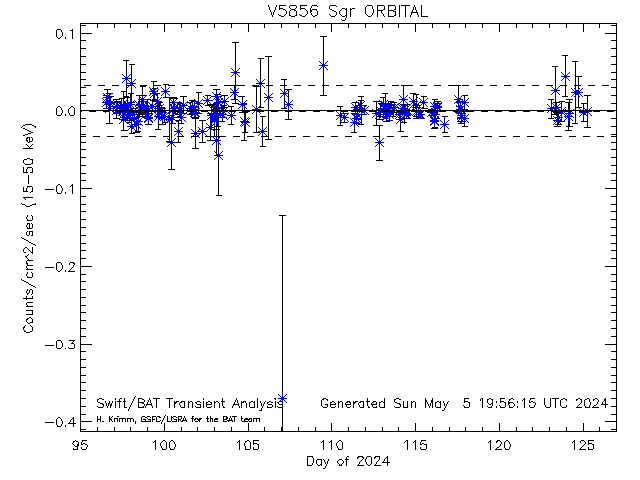
Dashed lines show average rate (and +/- 1 sigma standard deviation) for this source (derived from this plot)
[34157] V5856 Sgr RA= 275.218 degs; Dec= -28.3700 degs
Daily light curves: FITS version ASCII version
Orbit light curves: FITS version ASCII version
Full mission light curve
-------------------------------------------------------------------------------------------------------------------------------------------------------------------
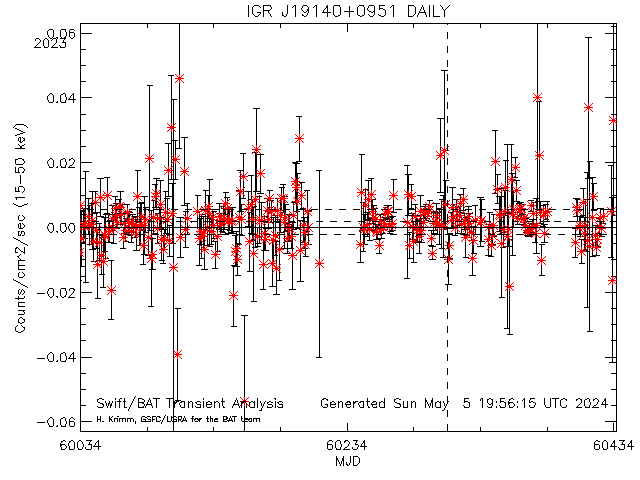
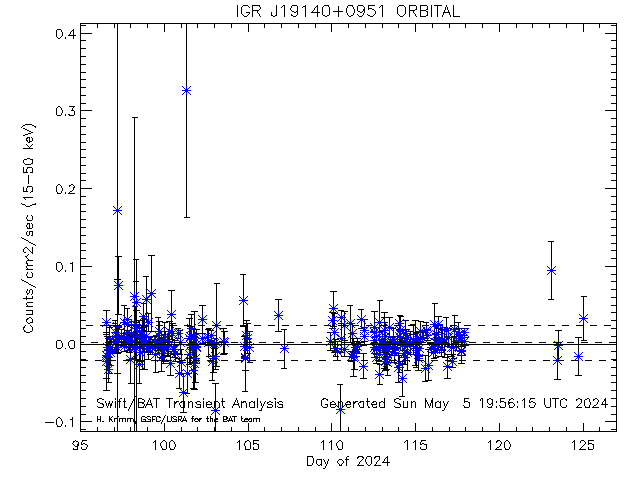
Dashed lines show average rate (and +/- 1 sigma standard deviation) for this source (derived from this plot)
[20008] IGR J19140+0951 RA= 288.518 degs; Dec= 9.88300 degs
Daily light curves: FITS version ASCII version
Orbit light curves: FITS version ASCII version
Full mission light curve
-------------------------------------------------------------------------------------------------------------------------------------------------------------------
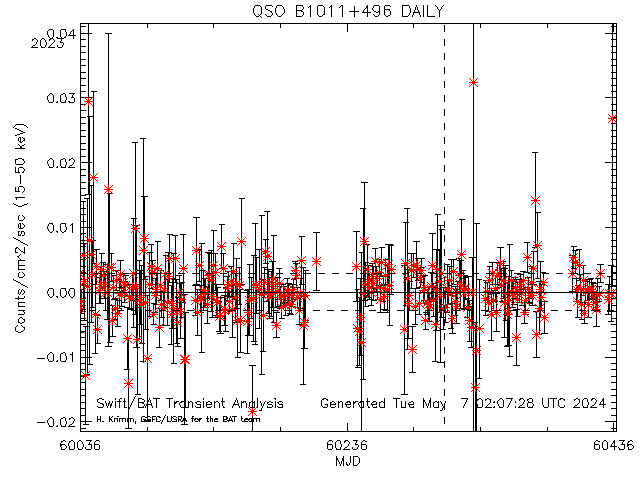
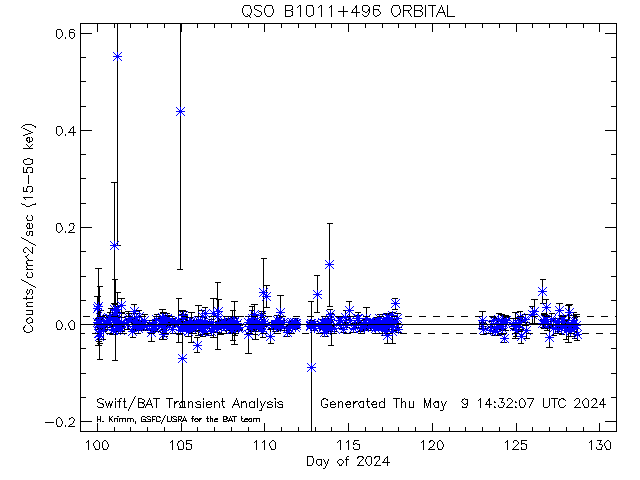
Dashed lines show average rate (and +/- 1 sigma standard deviation) for this source (derived from this plot)
[20045] QSO B1011+496 RA= 153.767 degs; Dec= 49.4335 degs
Daily light curves: FITS version ASCII version
Orbit light curves: FITS version ASCII version
Full mission light curve
-------------------------------------------------------------------------------------------------------------------------------------------------------------------
Dashed lines show average rate (and +/- 1 sigma standard deviation) for this source (derived from this plot)
[30200] IM Peg RA= 343.260 degs; Dec= 16.8411 degs
Daily light curves: FITS version ASCII version
Orbit light curves: FITS version ASCII version
Full mission light curve
-------------------------------------------------------------------------------------------------------------------------------------------------------------------
Dashed lines show average rate (and +/- 1 sigma standard deviation) for this source (derived from this plot)
[10304] Ser X-1 RA= 279.990 degs; Dec= 5.03600 degs
Daily light curves: FITS version ASCII version
Orbit light curves: FITS version ASCII version
Full mission light curve
-------------------------------------------------------------------------------------------------------------------------------------------------------------------
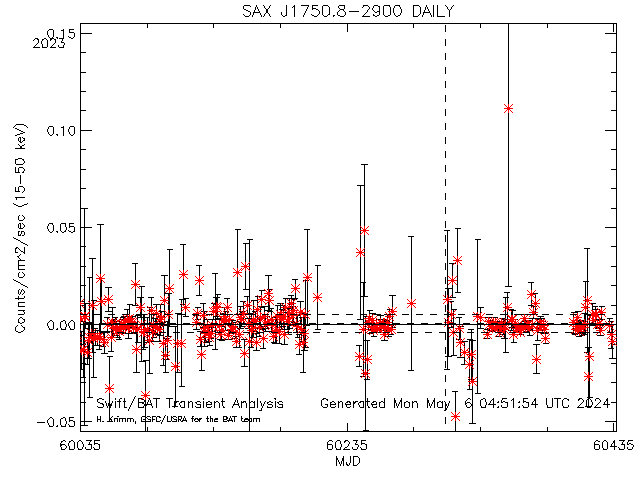
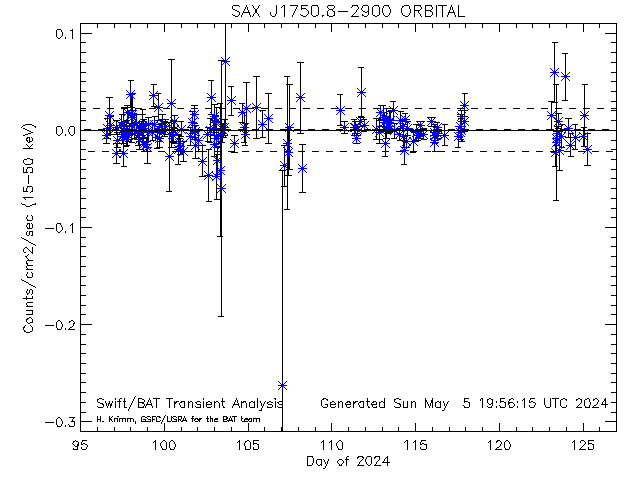
Dashed lines show average rate (and +/- 1 sigma standard deviation) for this source (derived from this plot)
[10343] SAX J1750.8-2900 RA= 267.602 degs; Dec= -29.0380 degs
Daily light curves: FITS version ASCII version
Orbit light curves: FITS version ASCII version
Full mission light curve
-------------------------------------------------------------------------------------------------------------------------------------------------------------------
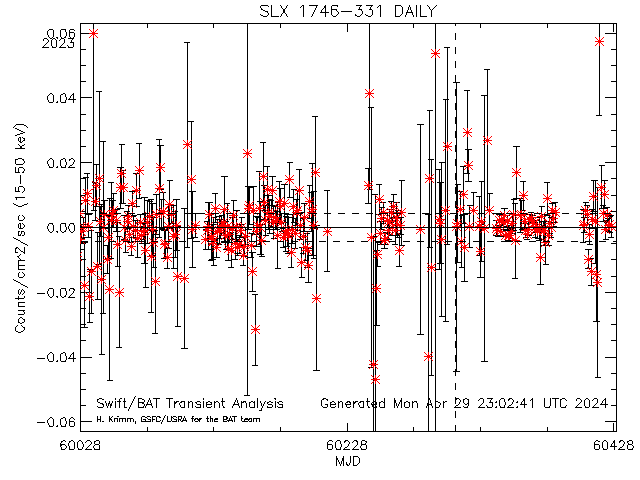
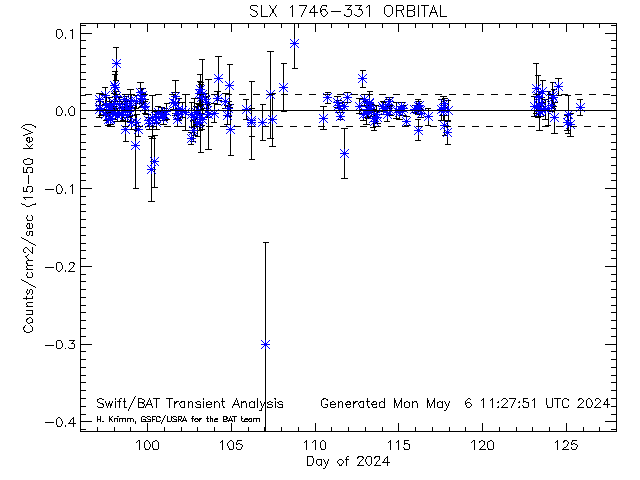
Dashed lines show average rate (and +/- 1 sigma standard deviation) for this source (derived from this plot)
[33617] SLX 1746-331 RA= 267.452 degs; Dec= -33.2051 degs
Daily light curves: FITS version ASCII version
Orbit light curves: FITS version ASCII version
Full mission light curve
-------------------------------------------------------------------------------------------------------------------------------------------------------------------
Dashed lines show average rate (and +/- 1 sigma standard deviation) for this source (derived from this plot)
[10342] RX J1718.4-4029 RA= 259.601 degs; Dec= -40.4930 degs
Daily light curves: FITS version ASCII version
Orbit light curves: FITS version ASCII version
Full mission light curve
-------------------------------------------------------------------------------------------------------------------------------------------------------------------
Dashed lines show average rate (and +/- 1 sigma standard deviation) for this source (derived from this plot)
[10048] GRS 1758-258 RA= 270.302 degs; Dec= -25.7430 degs
Daily light curves: FITS version ASCII version
Orbit light curves: FITS version ASCII version
Full mission light curve
-------------------------------------------------------------------------------------------------------------------------------------------------------------------
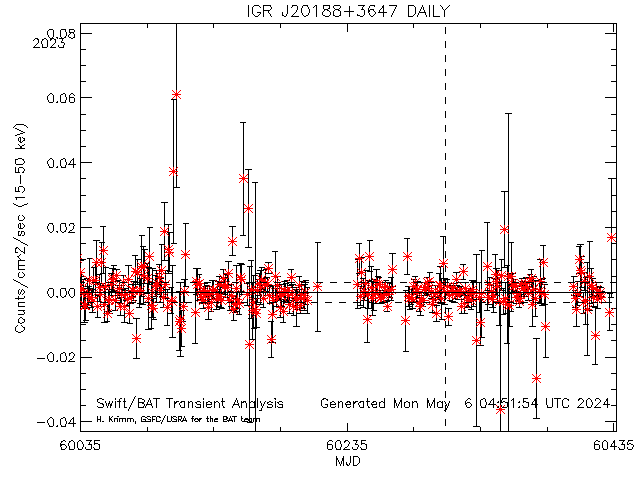
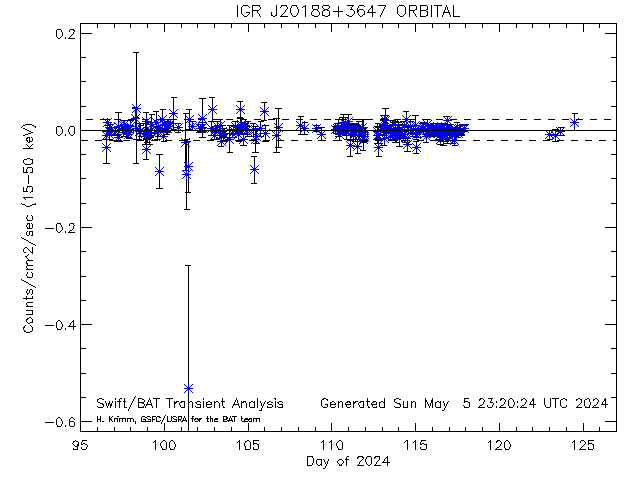
Dashed lines show average rate (and +/- 1 sigma standard deviation) for this source (derived from this plot)
[30125] IGR J20188+3647 RA= 304.700 degs; Dec= 36.7920 degs
Daily light curves: FITS version ASCII version
Orbit light curves: FITS version ASCII version
Full mission light curve
-------------------------------------------------------------------------------------------------------------------------------------------------------------------
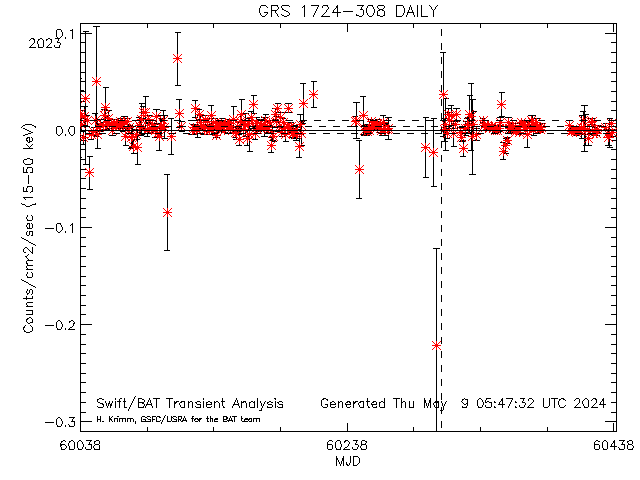
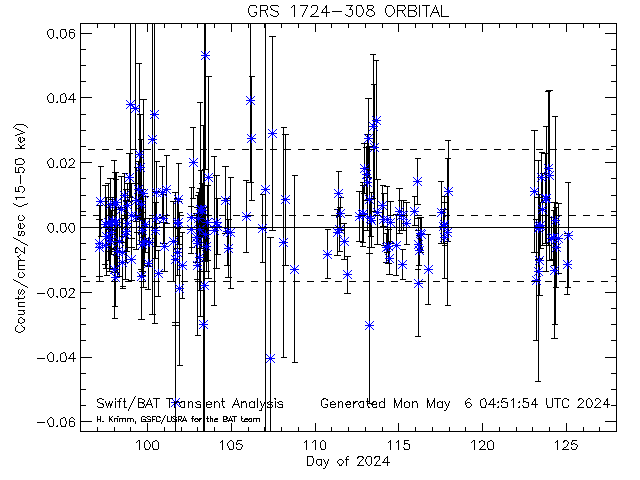
Dashed lines show average rate (and +/- 1 sigma standard deviation) for this source (derived from this plot)
[10045] GRS 1724-308 RA= 261.889 degs; Dec= -30.8020 degs
Daily light curves: FITS version ASCII version
Orbit light curves: FITS version ASCII version
Full mission light curve
-------------------------------------------------------------------------------------------------------------------------------------------------------------------
Dashed lines show average rate (and +/- 1 sigma standard deviation) for this source (derived from this plot)
[10011] 2CG 036+01 RA= 283.120 degs; Dec= 3.86700 degs
Daily light curves: FITS version ASCII version
Orbit light curves: FITS version ASCII version
Full mission light curve
-------------------------------------------------------------------------------------------------------------------------------------------------------------------
Dashed lines show average rate (and +/- 1 sigma standard deviation) for this source (derived from this plot)
[33670] 1A1744-361 RA= 267.080 degs; Dec= -36.1210 degs
Daily light curves: FITS version ASCII version
Orbit light curves: FITS version ASCII version
Full mission light curve
-------------------------------------------------------------------------------------------------------------------------------------------------------------------
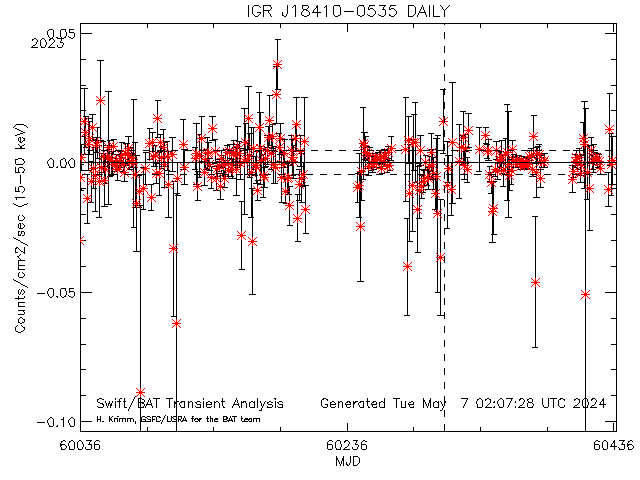
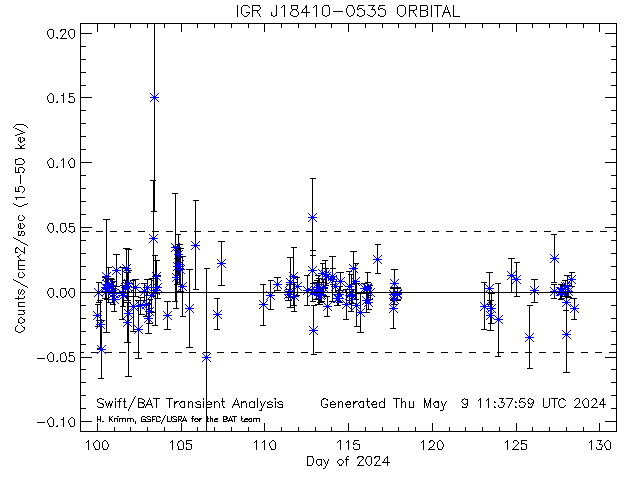
Dashed lines show average rate (and +/- 1 sigma standard deviation) for this source (derived from this plot)
[10661] IGR J18410-0535 RA= 280.252 degs; Dec= -5.59600 degs
Daily light curves: FITS version ASCII version
Orbit light curves: FITS version ASCII version
Full mission light curve
This page was last modified on Mon Mar 16 00:04:22 UTC 2026
The BAT Transient Monitor contacts are:
Tyler Parsotan,
tyler.parsotan@nasa.gov,
Amy Lien,
amy.y.lien@nasa.gov,
301.286.3624

- Curator: J.D. Myers
- NASA Official & Swift PI: Brad Cenko
- PAO Contact: Francis Reddy
- Questions/Comments/Feedback
- › Privacy Policy and Important Notices
- › Accessibility
- › Contact NASA
- › Page Last Updated: Sun, Mar 15, 2026