
Swift/BAT Hard X-ray Transient Monitor
Please Read Before Using These Results:README
Main page New! Red text indicates that the source has been detected in the BAT transient monitor.
Sources are considered detected under the following circumstances:
Data current through 21:33 UT, March 12 (DOY 71), 2026
This page combines BAT Transient Monitor light curves for all known Black Hole sources, Black Hole candidates and galactic binaries for which the nature of the compact object is still unknown.
The source list comes from the following sources:
(a) the monitoring list of the JACPOT XRB project: JACPOT XRB sources
(b) the list of Twenty confirmed black holes and twenty black-hole candidates from Remillard and McClintock, 2006, Annu. Rev. Astroph. 44:49-92
(c) Sources listed in the Astronomers Telegram with the black hole keyword, which have not been shown to be a pulsar or AGN
There are also four neutron star sources and one white dwarf which are included in the JACPOT XRB program.
All sources are identified in the Notes column as BH: confirmed black hole; BHC: black hole candidate; NS = neutron star; WD = white dwarf; ?? = unknown compact object
If you find any classifications incorrect or outdated or have any other questions or suggestions for this page please contact Tyler Parsotan; Amy Lien;
Hans Krimm
Swift/BAT monitoring of Black Hole sources
| Source Name | JACPOT XRB Name (if different) | RA J2000 Degs | Dec J2000 Degs | Alternate Name | Source Type | Today# | Yesterday# | Tenday# | Mean* | Peak* | Days* | Last Day* | |
|---|---|---|---|---|---|---|---|---|---|---|---|---|---|
| 1 | GRO J0422+32 | 65.4250 | 32.9170 | V518 Per | LMXB/BH | - | - | 9 ( 2.0) | 0 | 0 | 4 | 1 ( 0) | |
| 2 | LMC X-3 | 84.7342 | -64.0823 | 4U 0538-64 | BH | - | - | 6 ( 2.5) | 0 | - | - | - | |
| 3 | LMC X-1 | 84.9120 | -69.7430 | 4U 0540-69 | BH | - | - | - | 1 | 0 | 2 | 1 ( 0) | |
| 4 | IGR J05414-6858 | 85.3580 | -68.9730 | X-ray transient | - | - | - | 0 | 0 | 1 | 1 ( 0) | ||
| 5 | IGR J06074+2205 | 91.8500 | 22.0830 | 2MASS J06072661+2205477 | HMXB | - | - | - | 0 | 0 | 3 | 1 ( 0) | |
| 6 | 1A 0620-00 | 95.6750 | -0.350000 | V616 Mon | LMXB/BH | - | - | - | 0 | - | - | - | |
| 7 | GRS 1009-45 | 153.401 | -45.0750 | MM Vel | LMXB/BH | - | - | - | 0 | - | - | - | |
| 8 | XTE J1118+480 | 169.545 | 48.0370 | KV UMa | LMXB/BH | - | - | - | 0 | - | - | - | |
| 9 | Nova Mus 1991 | 171.600 | -68.6830 | GU Mus | LMXB/BH | - | - | - | 0 | 0 | 1 | 1 ( 0) | |
| 10 | MAXI J1305-704 | 196.735 | -70.4510 | NULL | XRB/BHC | - | - | - | 0 | 51 | 17 | 56024 ( 4157) | |
| 11 | SWIFT J1357.2-0933 | 209.320 | -9.54400 | LMXB/BHC | - | - | - | 0 | 43 | 7 | 55594 ( 4587) | ||
| 12 | Ginga 1354-645 | 209.541 | -64.7350 | BW Cir | LMXB/BH | - | - | - | 1 | 269 | 100 | 57223 ( 2958) | |
| 13 | TrA X-1 | 232.075 | -61.8830 | KY Tra | LMXB/BHC | - | - | - | 1 | - | - | - | |
| 14 | MAXI J1535-571 | 233.832 | -57.2300 | NULL | NULL | - | - | - | 0 | 0 | 1 | 1 ( 0) | |
| 15 | SWIFT J1539.2-6227 | 234.800 | -62.4670 | LMXB/BHC | - | - | - | 0 | - | - | - | ||
| 16 | MAXI J1543-564 | 235.822 | -56.4140 | NULL | XRB/BHC | - | - | - | 0 | - | - | - | |
| 17 | 4U 1543-47 | 236.786 | -47.6690 | IL Lup | LMXB/BH | - | - | - | 7 | 140 | 27 | 59382 ( 799) | |
| 18 | XTE J1550-564 | 237.757 | -56.4580 | V381 Nor | LMXB/BH | - | - | - | 0 | 0 | 1 | 1 ( 0) | |
| 19 | 4U 1630-472 | 248.504 | -47.3930 | Nor X-1 | LMXB/BHC | 185 ( 2.4) | 111 ( 4.6) | 91 (15.3) | 29 | 830 | 103 | 60033 ( 148) | |
| 20 | XTE J1637-498 | 249.262 | -49.8600 | X-ray transient | - | - | - | 0 | 0 | 1 | 1 ( 0) | ||
| 21 | XTE J1650-500 | 252.500 | -50.0000 | [GHJ2008] 3 | LMXB/BH | - | - | - | 0 | - | - | - | |
| 22 | XTE J1652-453 | 253.085 | -45.3440 | XRB/BHC | - | - | - | 0 | - | - | - | ||
| 23 | GRO J1655-40 | 253.501 | -39.8333 | V1033 Sco | LMXB/BH | 78 ( 2.2) | - | - | 1 | 795 | 62 | 53509 ( 6672) | |
| 24 | MAXI J1659-152 | 254.757 | -15.2580 | LMXB/BHC | - | - | - | 0 | 241 | 50 | 55465 ( 4716) | ||
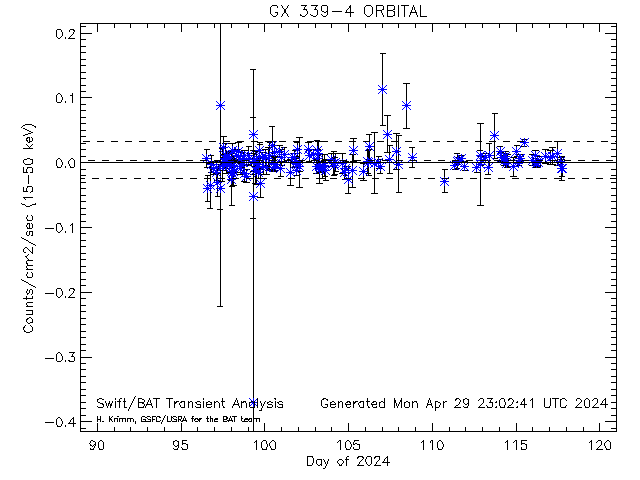
| 25 | GX 339-4 | 255.706 | -48.7900 | V821 Ara | LMXB/BH | - | - | - | 13 | 720 | 1034 | 54131 ( 6050) | |
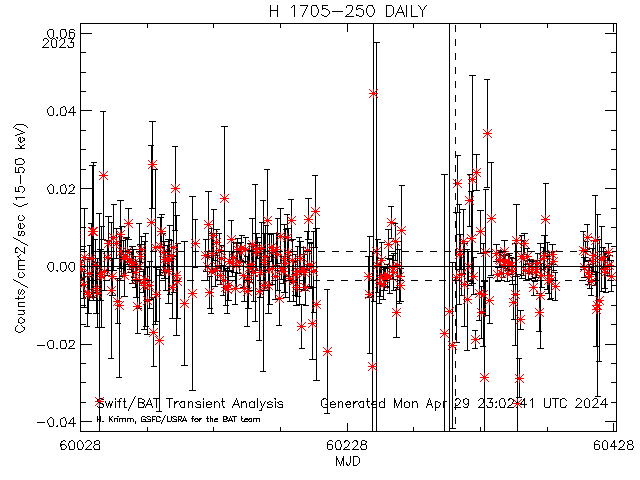
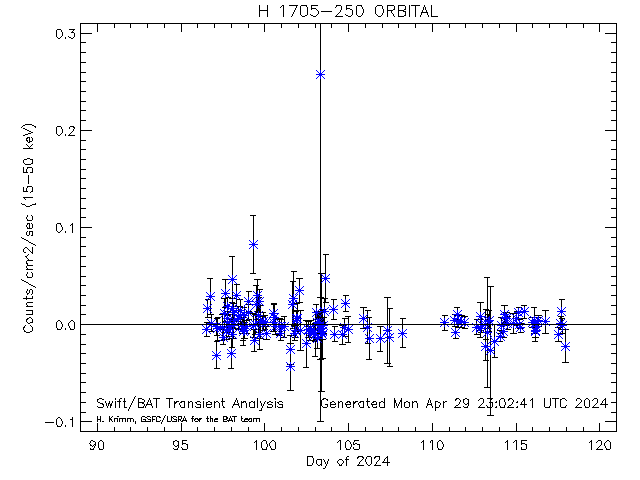
| 26 | H 1705-250 | 257.050 | -25.0830 | V2107 Oph | LMXB/BH | - | - | - | 0 | - | - | - | |
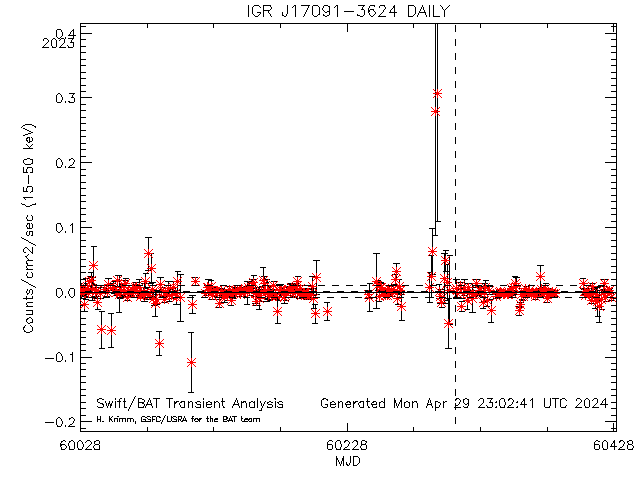
| 27 | IGR J17091-3624 | 257.282 | -36.4070 | SAX J1709.1-3624 | LMXB/BHC | - | - | - | 5 | 122 | 124 | 55607 ( 4574) | |
| 28 | IGR J17098-3628 | 257.441 | -36.4660 | 2MASS J17094612-362757 | BHC | - | - | - | 1 | 42 | 2 | 53553 ( 6628) | |
| 29 | SAX J1711.6-3808 | 257.900 | -38.1420 | BHC | - | - | - | 0 | - | - | - | ||
| 30 | XMMSL1 J171900.4-353217 | 259.752 | -35.5380 | X-ray transient | - | - | - | 0 | 0 | 2 | 1 ( 0) | ||
| 31 | XTE J1719-291 | 259.821 | -29.0690 | X-ray source | - | - | - | 0 | 0 | 5 | 1 ( 0) | ||
| 32 | Granat 1716-249 | GRS 1716-249 | 259.904 | -25.0180 | GRS 1716-249 | BHC | - | - | - | 2 | 625 | 250 | 57763 ( 2418) |
| 33 | XTE J1720-318 | 259.978 | -31.7480 | V1228 Sco | LMXB/BHC | - | - | - | 0 | 0 | 3 | 1 ( 0) | |
| 34 | IGR J17285-2922 | 262.171 | -29.3820 | [KRL2007b] 241 | XRB | - | - | - | 0 | 0 | 3 | 1 ( 0) | |
| 35 | Rapid Burster | MXB 1730-335 | 263.353 | -33.3880 | MXB 1730-335 | LMXB/NS | - | - | 16 ( 2.4) | 2 | 61 | 79 | 54264 ( 5917) |
| 36 | GRS 1730-312 | KS 1730-312 | 263.380 | -31.2200 | KS 1730-312 | BHC | - | - | - | 0 | 0 | 1 | 1 ( 0) |
| 37 | IGR J17354-3255 | 263.854 | -32.9380 | SSTGLMC G355.4576-00.2730 | SRC/gamma | - | - | - | 1 | - | - | - | |
| 38 | IGR J17379-3747 | 264.495 | -37.7720 | X-ray source | - | - | - | 0 | 0 | 1 | 1 ( 0) | ||
| 39 | AX J1740.1-3102 | GRS 1737-31 | 265.038 | -31.0400 | GRS 1737-31 | BHC | - | - | - | 0 | 0 | 1 | 1 ( 0) |
| 40 | GRS 1739-278 | 265.670 | -27.7600 | V2606 Oph | BHC | - | - | - | 3 | 333 | 145 | 56777 ( 3404) | |
| 41 | 1E 1740.7-2942 | 265.978 | -29.7450 | GREAT ANNIHILATOR | LMXB/BHC | - | - | 19 ( 2.6) | 44 | 124 | 165 | 59855 ( 326) | |
| 42 | Swift J1745.1-2624 | 266.295 | -26.4030 | Swift J174510.8-262411 | LMXB/BHC | - | - | - | 4 | 909 | 163 | 56188 ( 3993) | |
| 43 | IGR J17464-3213 | H 1743-322 | 266.565 | -32.2340 | H 1743-322 | LMXB/BHC | - | - | - | 7 | 215 | 533 | 55195 ( 4986) |
| 44 | XTE J1748-288 | 267.021 | -28.4740 | AX J1748.0-2829 | LMXB/BHC | - | - | - | 0 | 125 | 3 | 59734 ( 447) | |
| 45 | 1A1744-361 | 267.080 | -36.1210 | [KRL2007b] 281 | LMXB | - | - | 14 ( 2.2) | 0 | 0 | 9 | 1 ( 0) | |
| 46 | IGR J17497-2821 | 267.409 | -28.3547 | LMXB/BHC | - | - | - | 0 | 99 | 37 | 54001 ( 6180) | ||
| 47 | SLX 1746-331 | 267.452 | -33.2051 | RX J1749.8-3312 | LMXB | - | - | 20 ( 3.0) | 0 | 0 | 1 | 1 ( 0) | |
| 48 | XTE J1752-223 | 268.063 | -22.3420 | LMXB/BHC | - | - | - | 1 | 818 | 141 | 55198 ( 4983) | ||
| 49 | SWIFT J1753.5-0127 | 268.368 | -1.45260 | LMXB/BHC | - | - | - | 36 | 409 | 2515 | 53563 ( 6618) | ||
| 50 | XTE J1755-324 | 268.870 | -32.4780 | INTREF 866 | LMXB/BHC | - | - | - | 0 | 62 | 2 | 59855 ( 326) | |
| 51 | IGR J17586-2129 | 269.644 | -21.3890 | CXOU J175834.5-212321 | HMXB | - | - | 17 ( 2.4) | 2 | 51 | 51 | 55150 ( 5031) | |
| 52 | H 1755-338 | Ginga 1755-338 | 269.675 | -33.8170 | Ginga 1755-338 | BHC | - | - | - | 0 | 0 | 1 | 1 ( 0) |
| 53 | GRS 1758-258 | 270.302 | -25.7430 | 1RXS J180112.6-254435 | LMXB/BHC | - | 112 ( 4.2) | 83 (13.0) | 60 | 150 | 331 | 60018 ( 163) | |
| 54 | XTE J1812-182 | 273.116 | -18.2090 | XMMU J181227.8-181234 | X-ray transient | - | - | - | 0 | 0 | 4 | 1 ( 0) | |
| 55 | IGR J18175-1530 | 274.393 | -15.5110 | XTE J1817-155 | X-ray source | - | - | - | 0 | 0 | 2 | 1 ( 0) | |
| 56 | XTE J1817-330 | 274.431 | -33.0190 | LMXB/BHC | - | - | - | 0 | 151 | 39 | 53766 ( 6415) | ||
| 57 | XTE J1818-245 | 274.603 | -24.5380 | [KRL2007b] 312 | LMXB/BHC | - | - | - | 0 | 73 | 2 | 53595 ( 6586) | |
| 58 | SAX J1819.3-2525 | 274.840 | -25.4070 | V4641 Sgr | LMXB/BH | - | - | - | 0 | 158 | 3 | 53541 ( 6640) | |
| 59 | H 1820-303 | 4U 1820-30 | 275.919 | -30.3610 | 4U 1820-30 | LMXB/NS | - | - | 49 ( 8.4) | 55 | 168 | 4156 | 54986 ( 5195) |
| 60 | SWIFT J1842.5-1124 | 280.573 | -11.4180 | BHC | - | 38 ( 2.2) | - | 1 | 96 | 78 | 54725 ( 5456) | ||
| 61 | EXO 1846-031 | 282.321 | -3.06200 | LMXB/BHC | - | - | - | 0 | 379 | 33 | 58697 ( 1484) | ||
| 62 | XTE J1856+053 | 284.163 | 5.33000 | INTREF 948 | LMXB/BHC | - | - | 15 ( 2.2) | 0 | 69 | 17 | 54253 ( 5928) | |
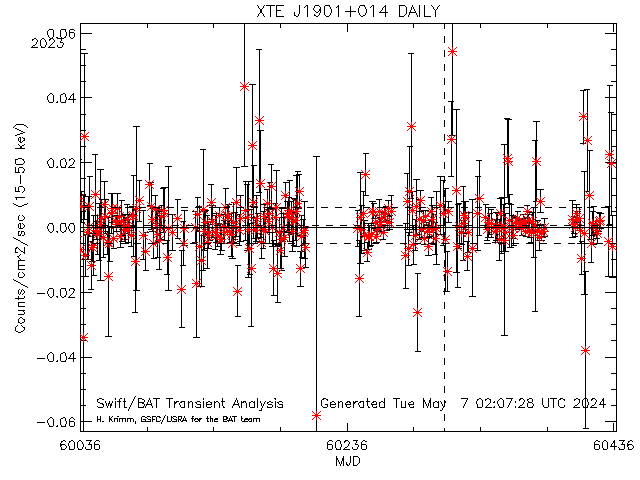
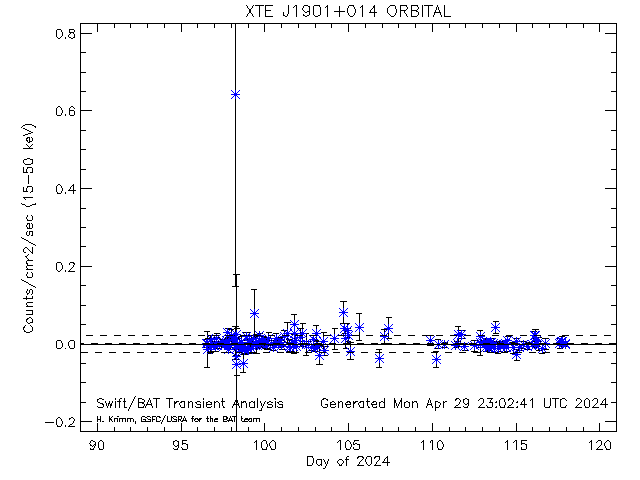
| 63 | XTE J1859+226 | 284.673 | 22.6580 | V406 Vul | LMXB/BH | - | - | - | 0 | 0 | 1 | 1 ( 0) | |
| 64 | XTE J1901+014 | 285.421 | 1.43800 | [KRL2007b] 350 | XRB | - | - | - | 2 | - | - | - | |
| 65 | XTE J1908+094 | 287.221 | 9.38500 | [KRL2007b] 353 | HMXB/BHC | - | - | - | 0 | 121 | 12 | 56595 ( 3586) | |
| 66 | Aql X-1 | 287.817 | 0.585000 | V1333 Aql | LMXB/NS | - | 41 ( 2.6) | 39 ( 6.0) | 6 | 212 | 454 | 56457 ( 3724) | |
| 67 | SS 433 | 287.956 | 4.98300 | V1343 Aql | uQUASAR | - | - | - | 7 | 32 | 107 | 54710 ( 5471) | |
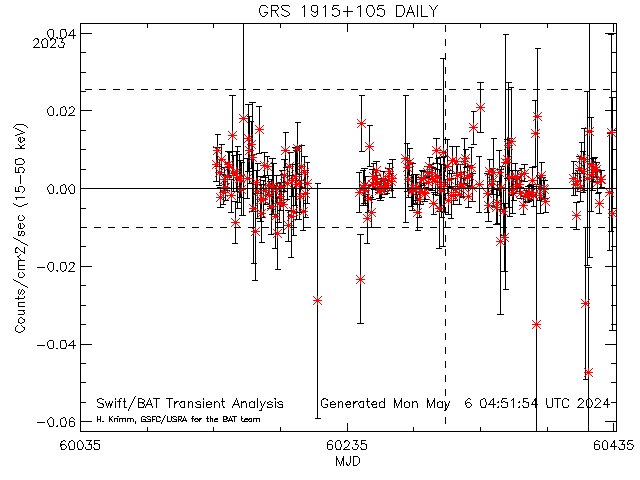
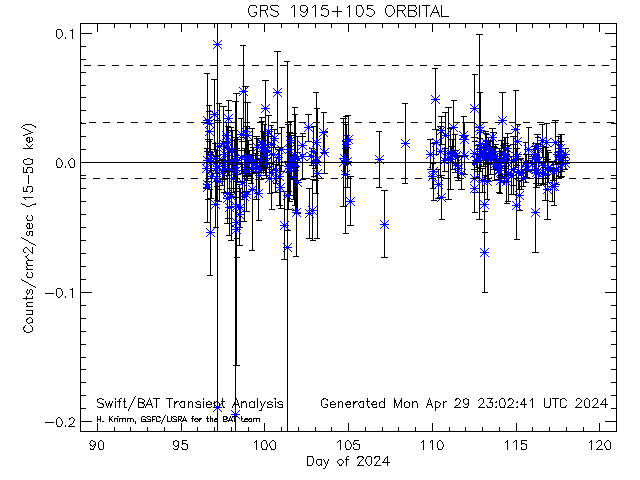
| 68 | GRS 1915+105 | 288.798 | 10.9460 | V1487 Aql | LMXB/BH | - | - | - | 120 | 955 | 4687 | 58995 ( 1186) | |
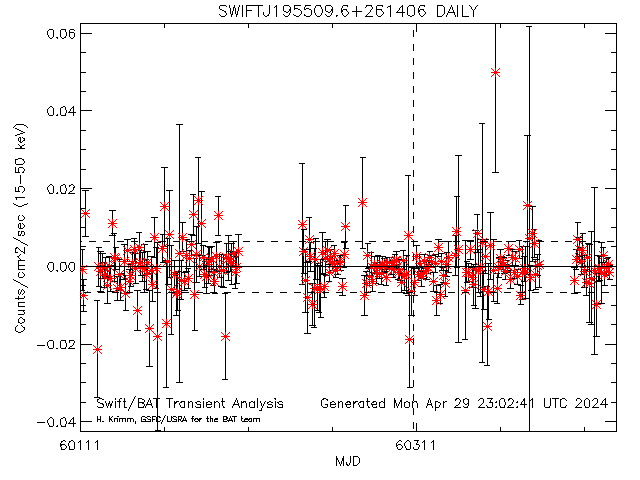
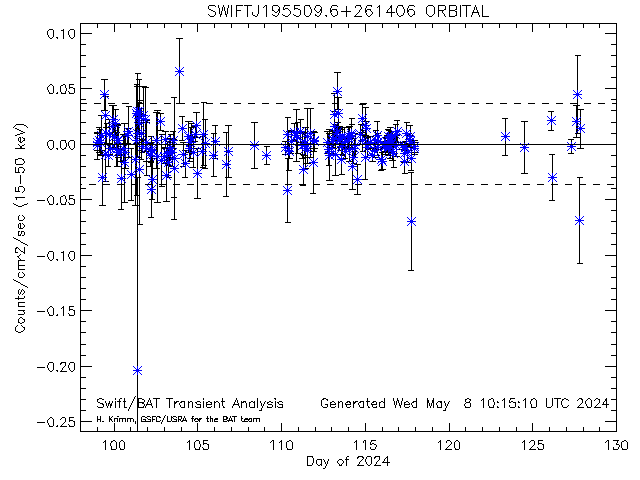
| 69 | SWIFTJ195509.6+261406 | 298.790 | 26.2352 | X-ray source | - | 26 ( 2.1) | - | 0 | - | - | - | ||
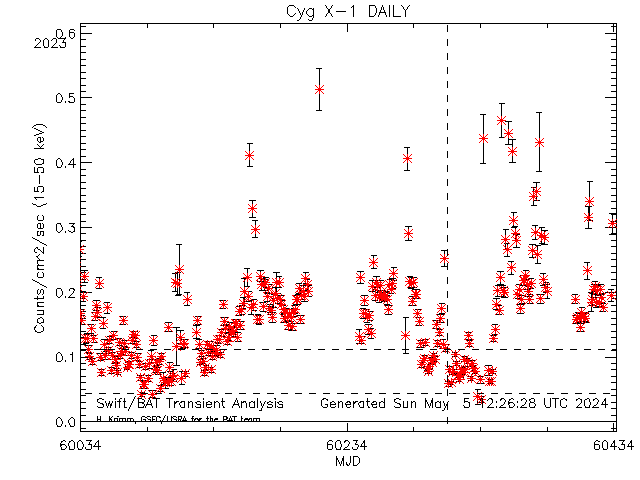
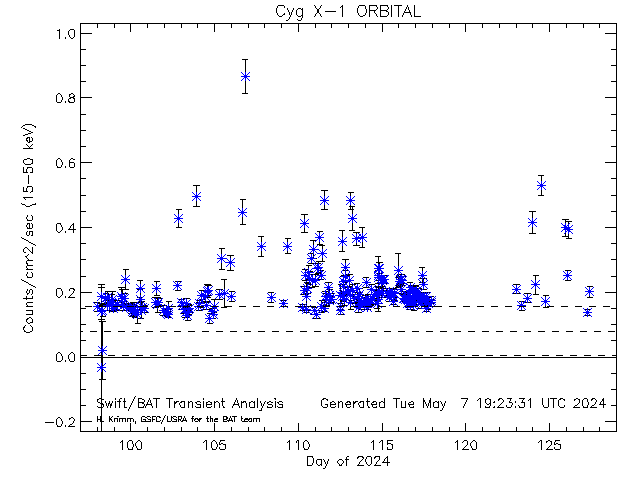
| 70 | Cyg X-1 | 299.591 | 35.2020 | V1357 Cyg | HMXB/BH | 675 (11.4) | 800 (26.0) | 864 (82.4) | 203 | 1918 | 6272 | 60161 ( 20) | |
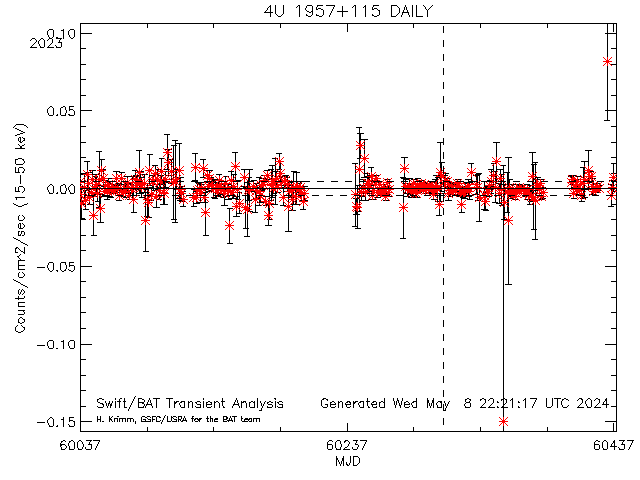
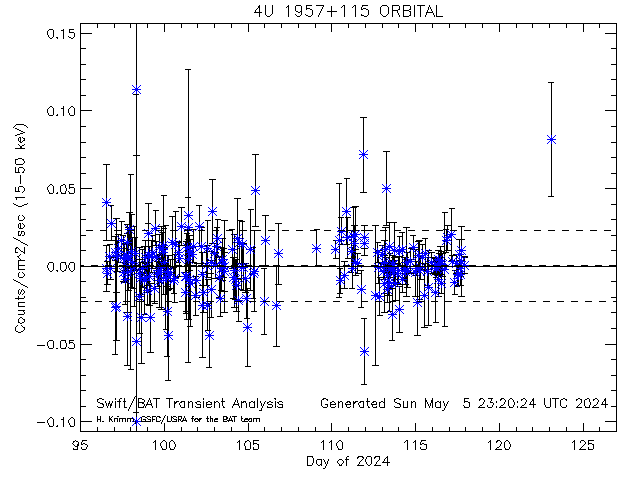
| 71 | 4U 1957+115 | 299.851 | 11.7090 | V1408 Aql | LMXB | - | 40 ( 2.9) | - | 1 | 32 | 6 | 55636 ( 4545) | |
| 72 | Ginga 2000+251 | GS 2000+251 | 300.707 | 25.2360 | GS 2000+251 | LMXB/BH | - | - | - | 0 | 0 | 2 | 1 ( 0) |
| 73 | XTE J2012+381 | 303.158 | 38.1840 | INTREF 1012 | LMXB/BHC | - | - | - | 0 | 0 | 3 | 1 ( 0) | |
| 74 | V404 Cyg | 306.016 | 33.8680 | LMXB/BH | - | - | - | 0 | 2760 | 14 | 57199 ( 2982) | ||
| 75 | Cyg X-3 | 308.107 | 40.9580 | V1521 Cyg | HMXB | - | 132 (11.0) | 116 (33.1) | 118 | 393 | 5449 | 60104 ( 77) | |
| 76 | 1H 2140+433 | SS Cyg | 325.678 | 43.5860 | SS Cyg | CV/Dwarf N | - | 39 ( 3.3) | - | 4 | 70 | 94 | 59257 ( 924) | Source Name | RA J2000 Degs | Dec J2000 Degs | Alternate Name | Source Type | Today# | Yesterday# | Tenday# | Mean* | Peak* | Days* | Last Day* |
* Explanation of last four table headings:
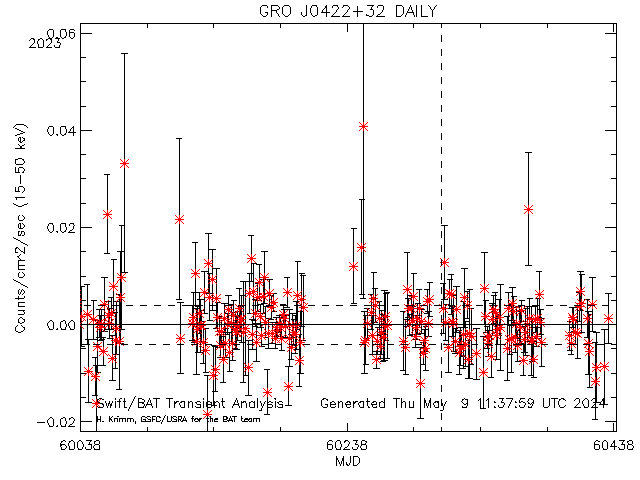
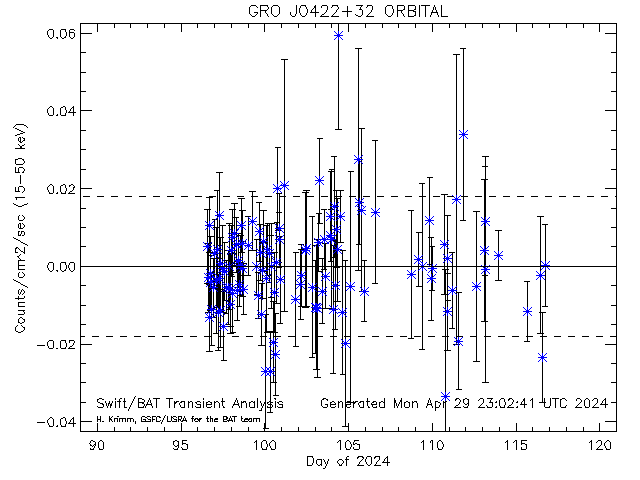
Dashed lines show average rate (and +/- 1 sigma standard deviation) for this source (derived from this plot)
[10043] GRO J0422+32 RA= 65.4250 degs; Dec= 32.9170 degs
Daily light curves: FITS version ASCII version
Orbit light curves: FITS version ASCII version
Full mission light curve
-------------------------------------------------------------------------------------------------------------------------------------------------------------------
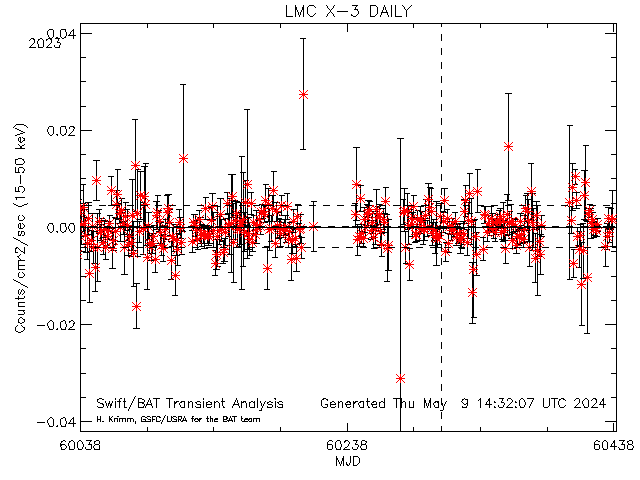
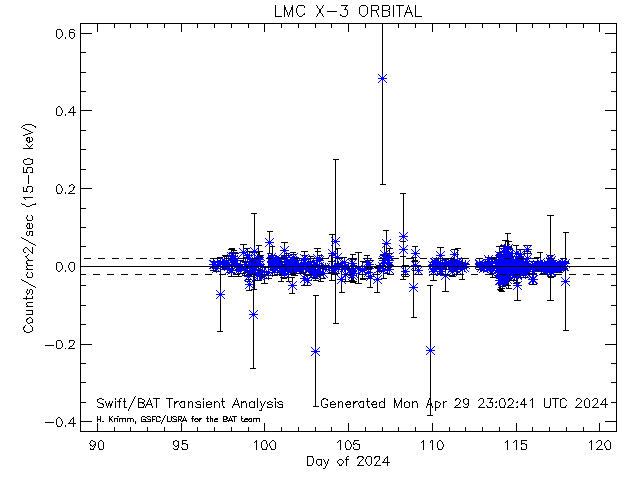
Dashed lines show average rate (and +/- 1 sigma standard deviation) for this source (derived from this plot)
[20099] LMC X-3 RA= 84.7342 degs; Dec= -64.0823 degs
Daily light curves: FITS version ASCII version
Orbit light curves: FITS version ASCII version
Full mission light curve
-------------------------------------------------------------------------------------------------------------------------------------------------------------------
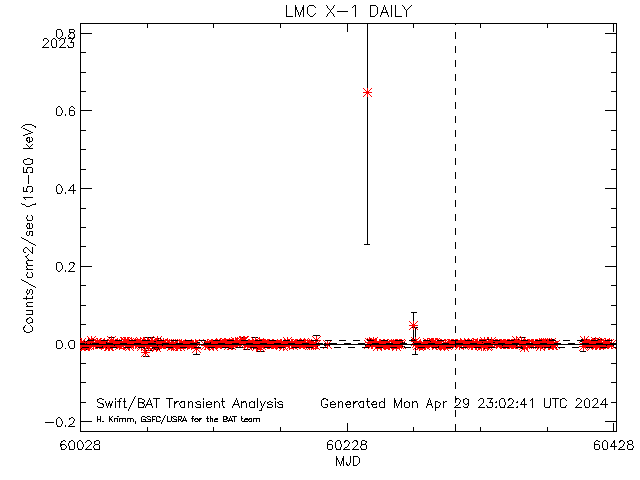
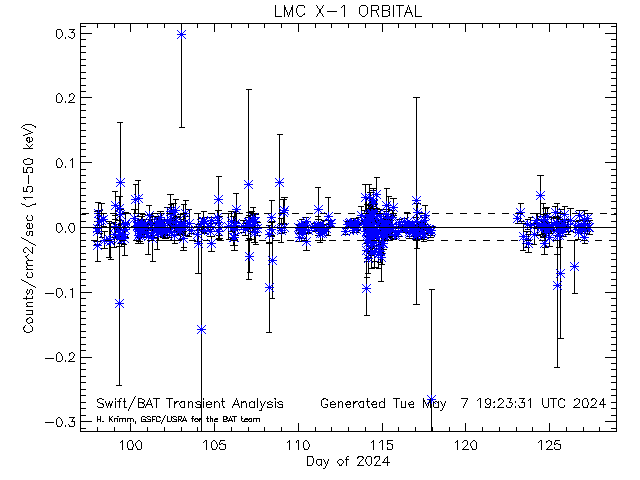
Dashed lines show average rate (and +/- 1 sigma standard deviation) for this source (derived from this plot)
[33887] LMC X-1 RA= 84.9120 degs; Dec= -69.7430 degs
Daily light curves: FITS version ASCII version
Orbit light curves: FITS version ASCII version
Full mission light curve
-------------------------------------------------------------------------------------------------------------------------------------------------------------------
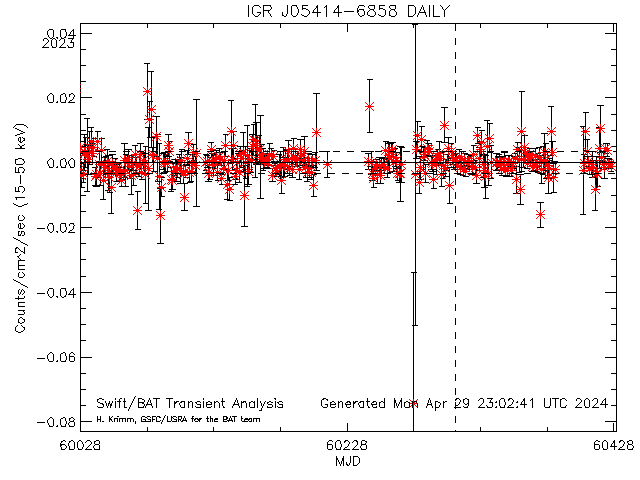
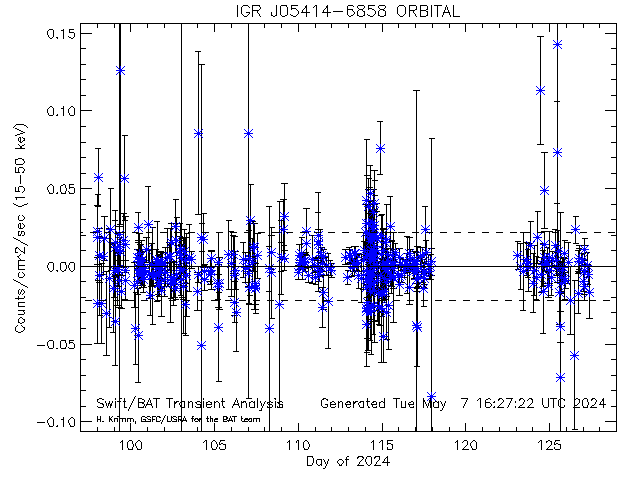
Dashed lines show average rate (and +/- 1 sigma standard deviation) for this source (derived from this plot)
[33945] IGR J05414-6858 RA= 85.3580 degs; Dec= -68.9730 degs
Daily light curves: FITS version ASCII version
Orbit light curves: FITS version ASCII version
Full mission light curve
-------------------------------------------------------------------------------------------------------------------------------------------------------------------
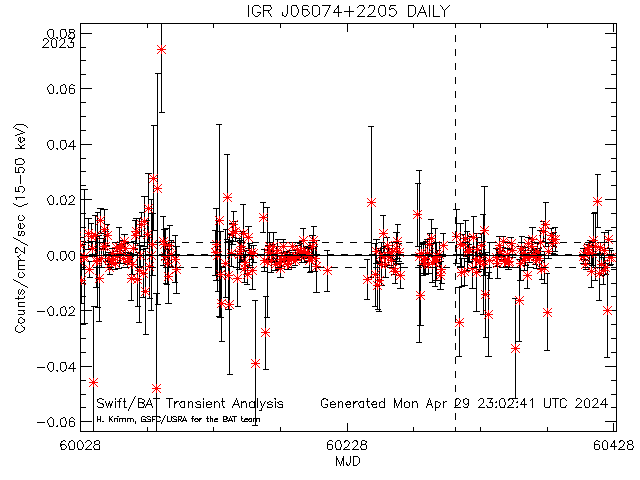
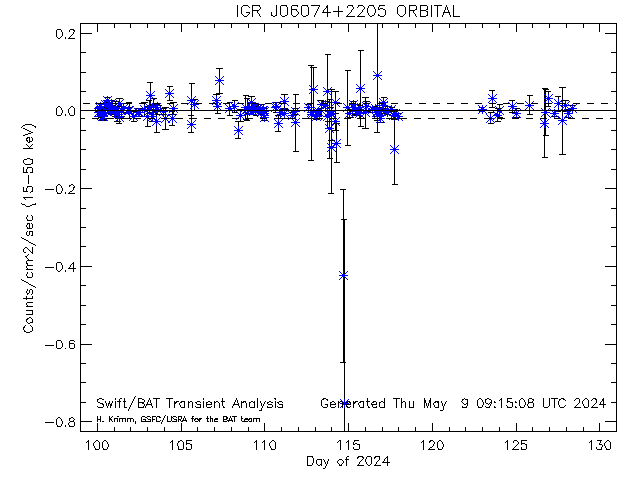
Dashed lines show average rate (and +/- 1 sigma standard deviation) for this source (derived from this plot)
[10602] IGR J06074+2205 RA= 91.8500 degs; Dec= 22.0830 degs
Daily light curves: FITS version ASCII version
Orbit light curves: FITS version ASCII version
Full mission light curve
-------------------------------------------------------------------------------------------------------------------------------------------------------------------
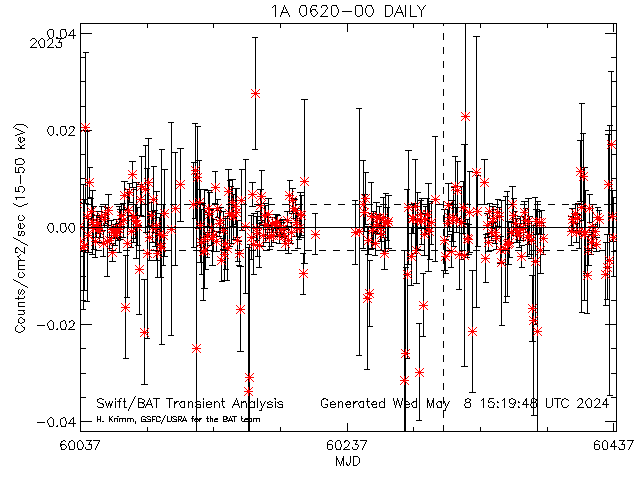
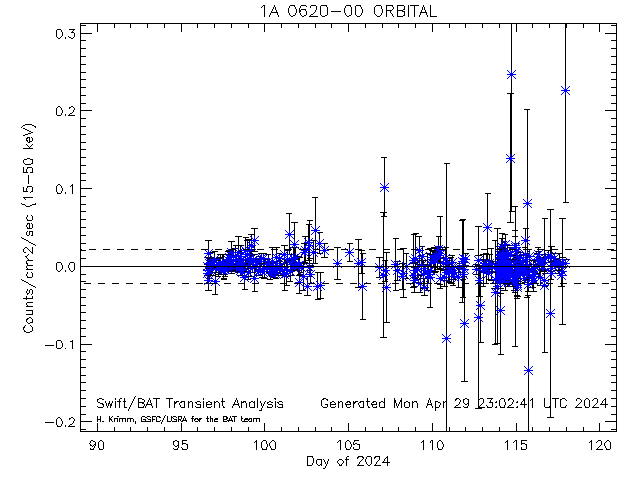
Dashed lines show average rate (and +/- 1 sigma standard deviation) for this source (derived from this plot)
[10030] 1A 0620-00 RA= 95.6750 degs; Dec= -0.350000 degs
Daily light curves: FITS version ASCII version
Orbit light curves: FITS version ASCII version
Full mission light curve
-------------------------------------------------------------------------------------------------------------------------------------------------------------------
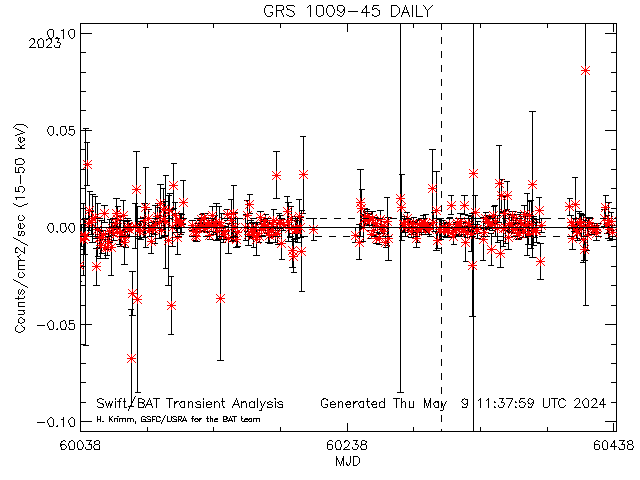
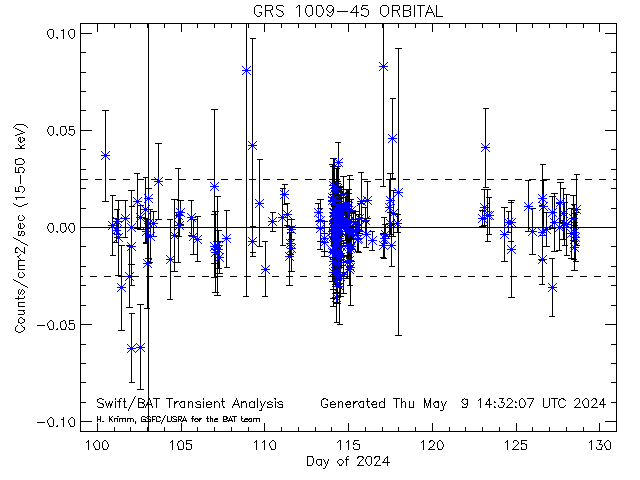
Dashed lines show average rate (and +/- 1 sigma standard deviation) for this source (derived from this plot)
[33959] GRS 1009-45 RA= 153.401 degs; Dec= -45.0750 degs
Daily light curves: FITS version ASCII version
Orbit light curves: FITS version ASCII version
Full mission light curve
-------------------------------------------------------------------------------------------------------------------------------------------------------------------
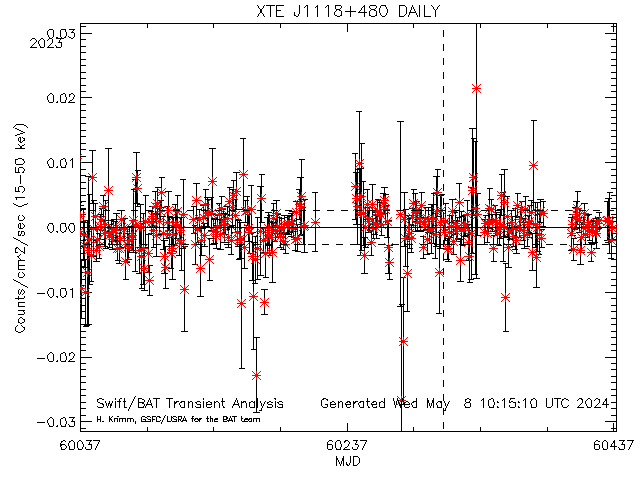
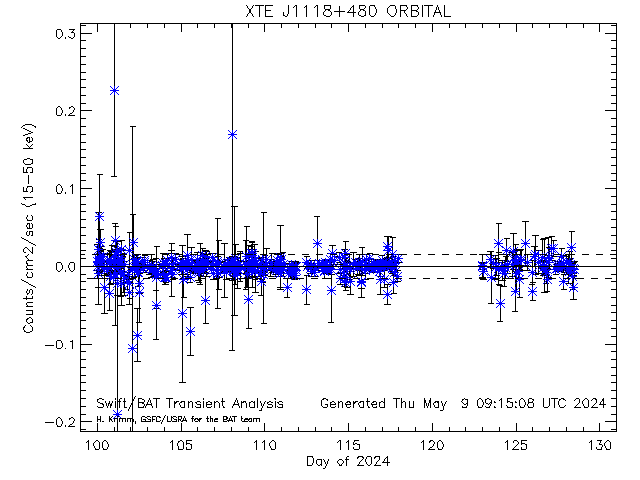
Dashed lines show average rate (and +/- 1 sigma standard deviation) for this source (derived from this plot)
[20014] XTE J1118+480 RA= 169.545 degs; Dec= 48.0370 degs
Daily light curves: FITS version ASCII version
Orbit light curves: FITS version ASCII version
Full mission light curve
-------------------------------------------------------------------------------------------------------------------------------------------------------------------
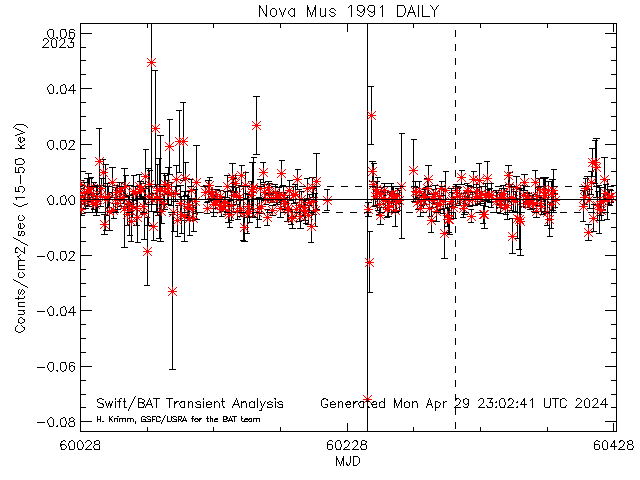
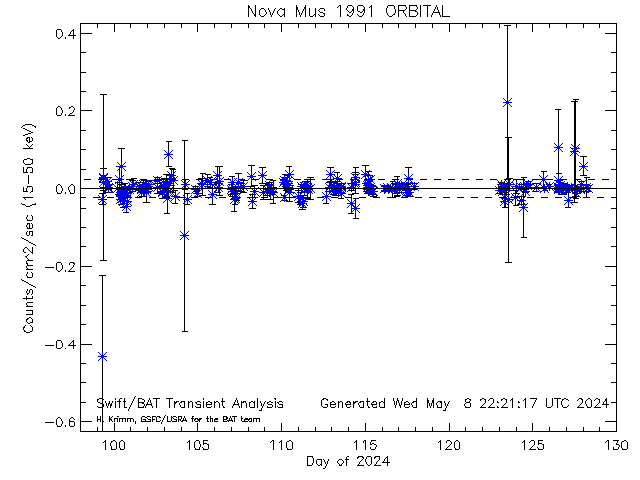
Dashed lines show average rate (and +/- 1 sigma standard deviation) for this source (derived from this plot)
[10099] Nova Mus 1991 RA= 171.600 degs; Dec= -68.6830 degs
Daily light curves: FITS version ASCII version
Orbit light curves: FITS version ASCII version
Full mission light curve
-------------------------------------------------------------------------------------------------------------------------------------------------------------------
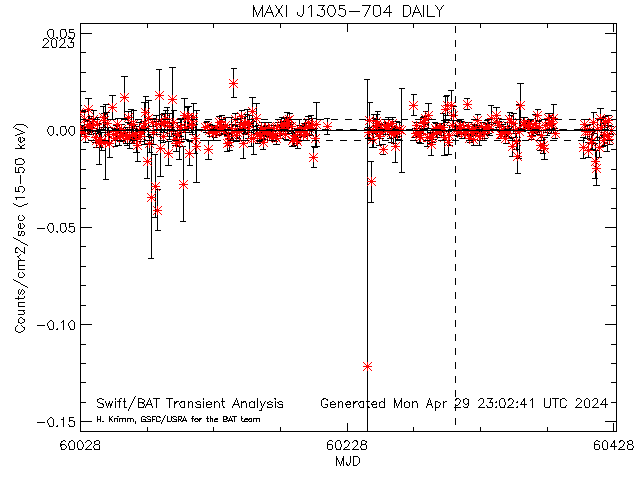
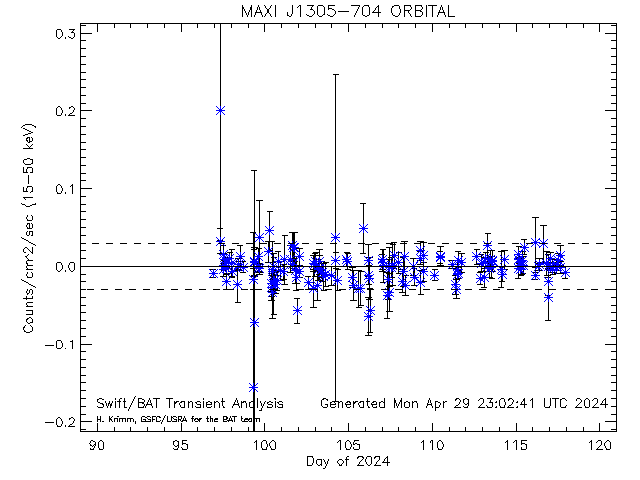
Dashed lines show average rate (and +/- 1 sigma standard deviation) for this source (derived from this plot)
[34048] MAXI J1305-704 RA= 196.735 degs; Dec= -70.4510 degs
Daily light curves: FITS version ASCII version
Orbit light curves: FITS version ASCII version
Full mission light curve
-------------------------------------------------------------------------------------------------------------------------------------------------------------------
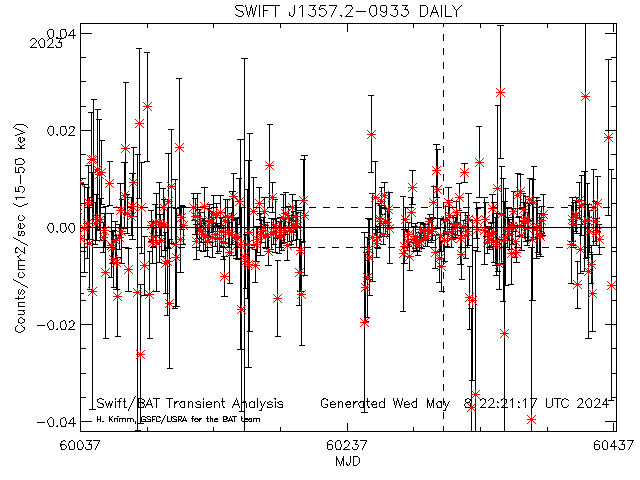
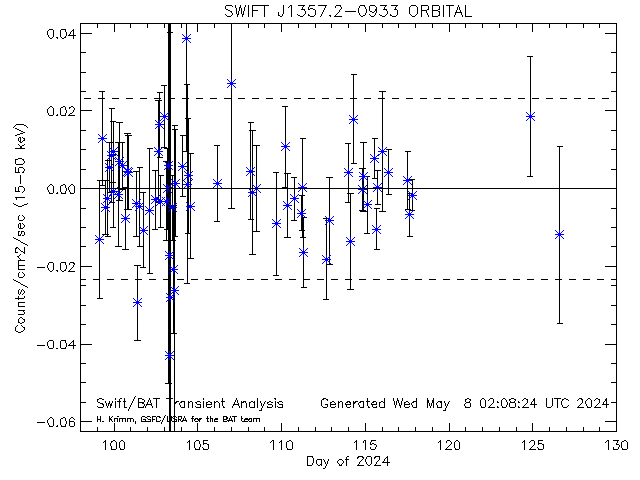
Dashed lines show average rate (and +/- 1 sigma standard deviation) for this source (derived from this plot)
[33993] SWIFT J1357.2-0933 RA= 209.320 degs; Dec= -9.54400 degs
Daily light curves: FITS version ASCII version
Orbit light curves: FITS version ASCII version
Full mission light curve
-------------------------------------------------------------------------------------------------------------------------------------------------------------------
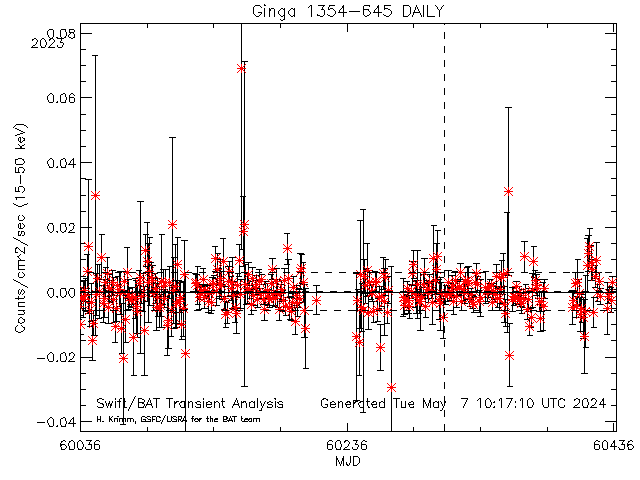
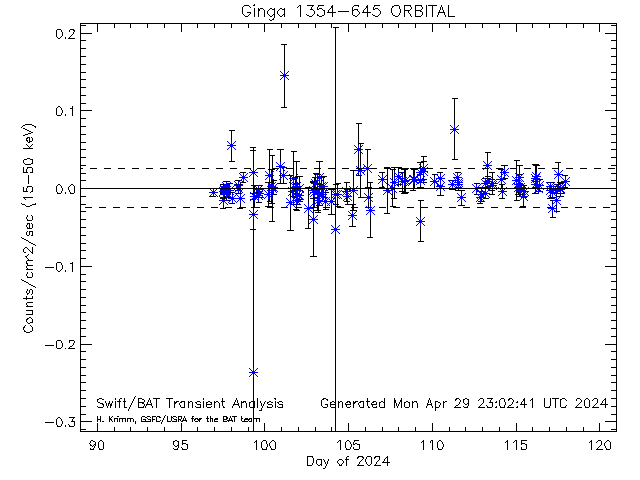
Dashed lines show average rate (and +/- 1 sigma standard deviation) for this source (derived from this plot)
[33886] Ginga 1354-645 RA= 209.541 degs; Dec= -64.7350 degs
Daily light curves: FITS version ASCII version
Orbit light curves: FITS version ASCII version
Full mission light curve
-------------------------------------------------------------------------------------------------------------------------------------------------------------------
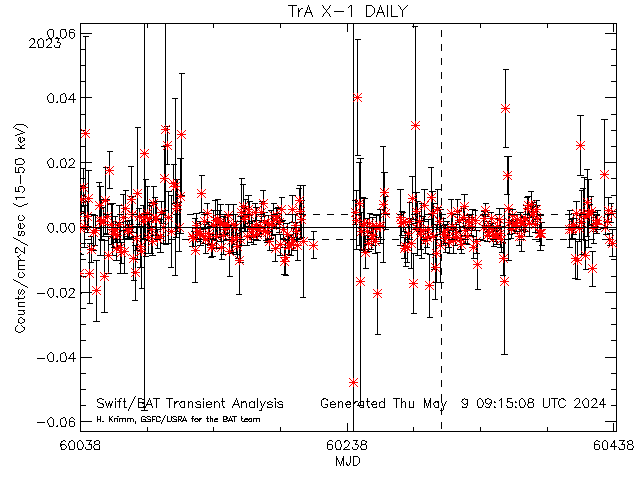
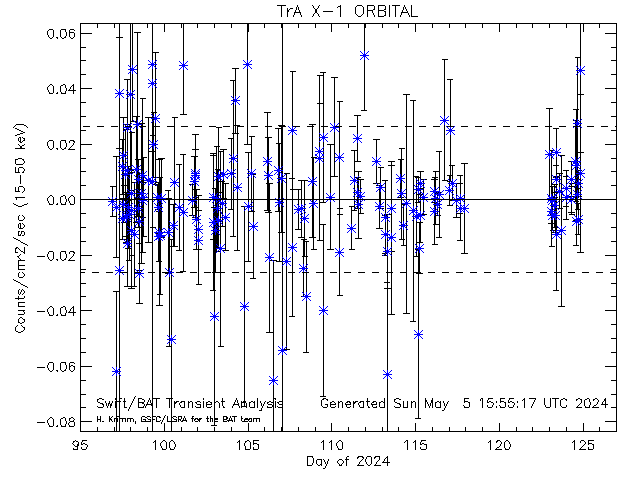
Dashed lines show average rate (and +/- 1 sigma standard deviation) for this source (derived from this plot)
[10118] TrA X-1 RA= 232.075 degs; Dec= -61.8830 degs
Daily light curves: FITS version ASCII version
Orbit light curves: FITS version ASCII version
Full mission light curve
-------------------------------------------------------------------------------------------------------------------------------------------------------------------
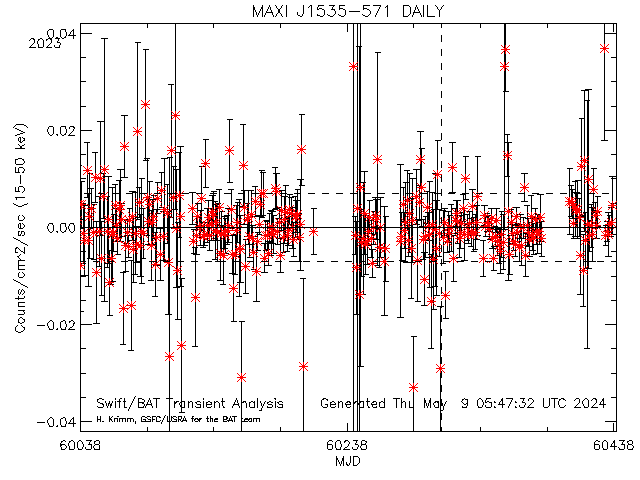
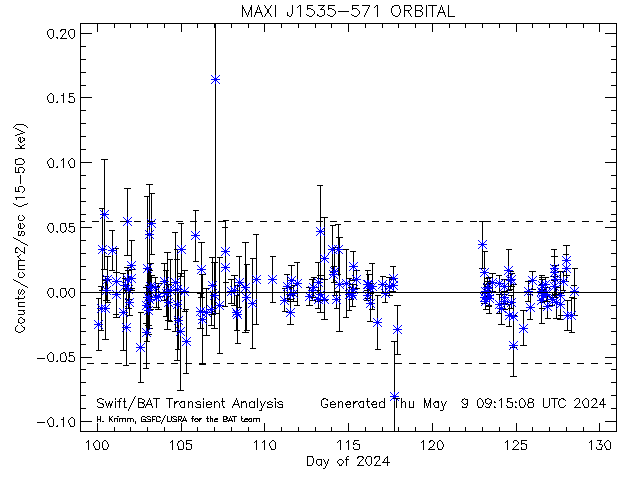
Dashed lines show average rate (and +/- 1 sigma standard deviation) for this source (derived from this plot)
[34119] MAXI J1535-571 RA= 233.832 degs; Dec= -57.2300 degs
Daily light curves: FITS version ASCII version
Orbit light curves: FITS version ASCII version
Full mission light curve
-------------------------------------------------------------------------------------------------------------------------------------------------------------------
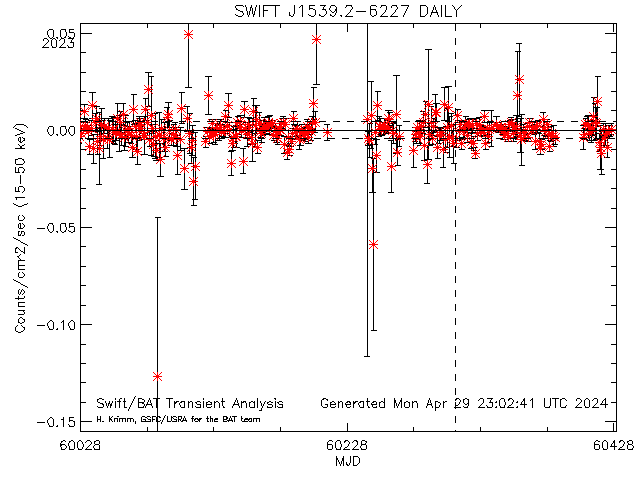
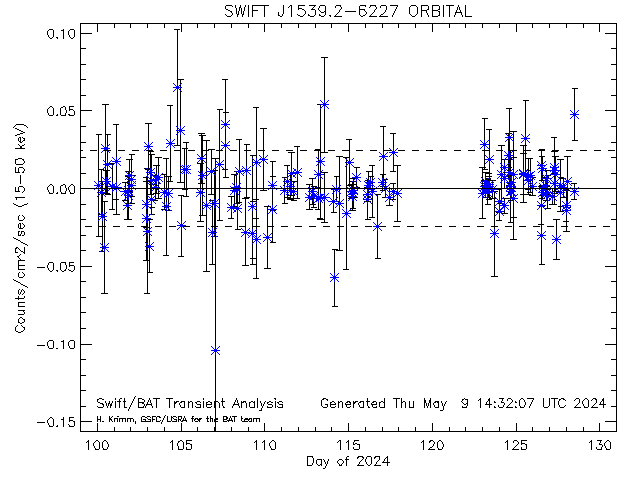
Dashed lines show average rate (and +/- 1 sigma standard deviation) for this source (derived from this plot)
[33715] SWIFT J1539.2-6227 RA= 234.800 degs; Dec= -62.4670 degs
Daily light curves: FITS version ASCII version
Orbit light curves: FITS version ASCII version
Full mission light curve
-------------------------------------------------------------------------------------------------------------------------------------------------------------------
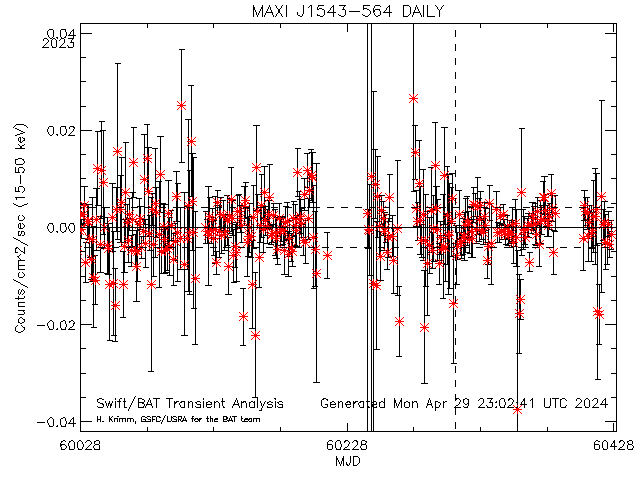
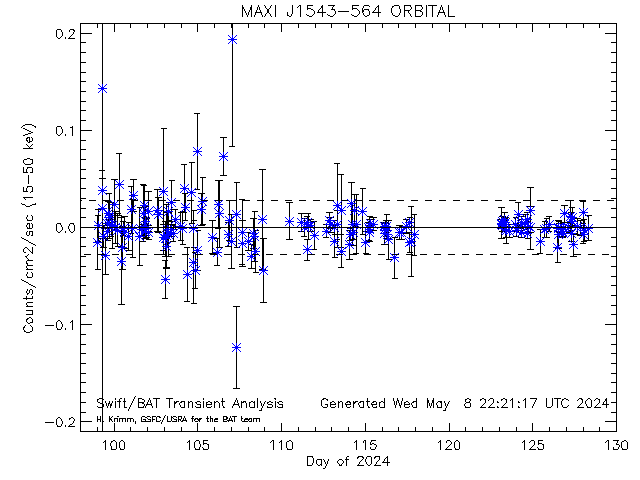
Dashed lines show average rate (and +/- 1 sigma standard deviation) for this source (derived from this plot)
[34013] MAXI J1543-564 RA= 235.822 degs; Dec= -56.4140 degs
Daily light curves: FITS version ASCII version
Orbit light curves: FITS version ASCII version
Full mission light curve
-------------------------------------------------------------------------------------------------------------------------------------------------------------------
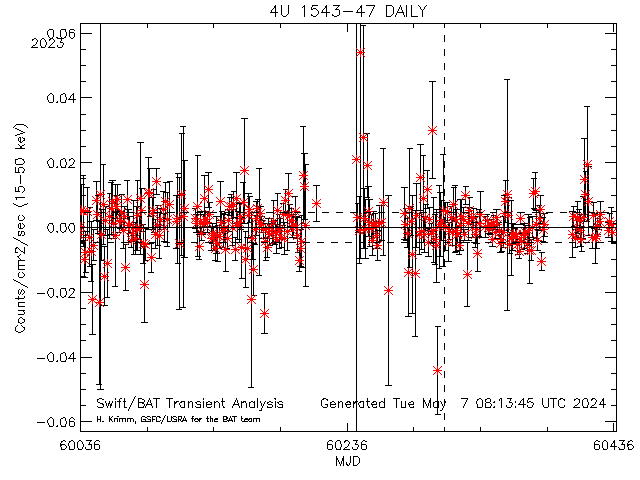
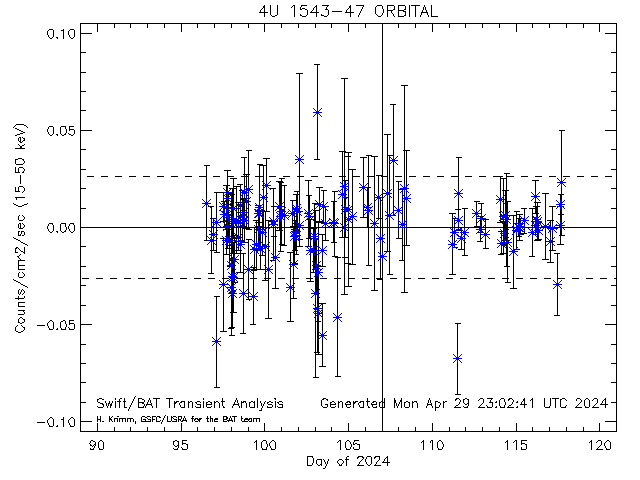
Dashed lines show average rate (and +/- 1 sigma standard deviation) for this source (derived from this plot)
[33936] 4U 1543-47 RA= 236.786 degs; Dec= -47.6690 degs
Daily light curves: FITS version ASCII version
Orbit light curves: FITS version ASCII version
Full mission light curve
-------------------------------------------------------------------------------------------------------------------------------------------------------------------
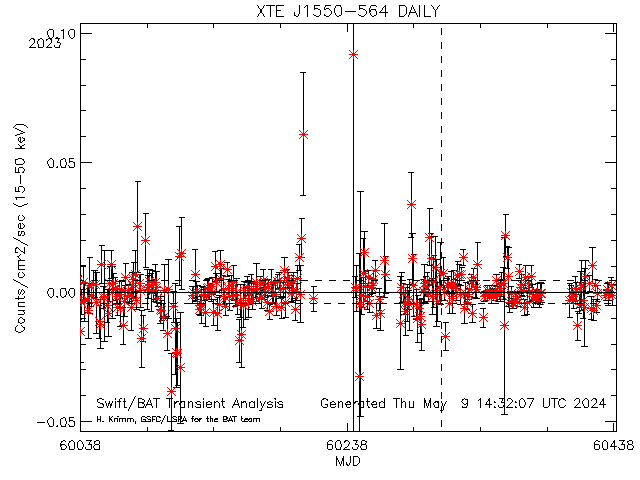
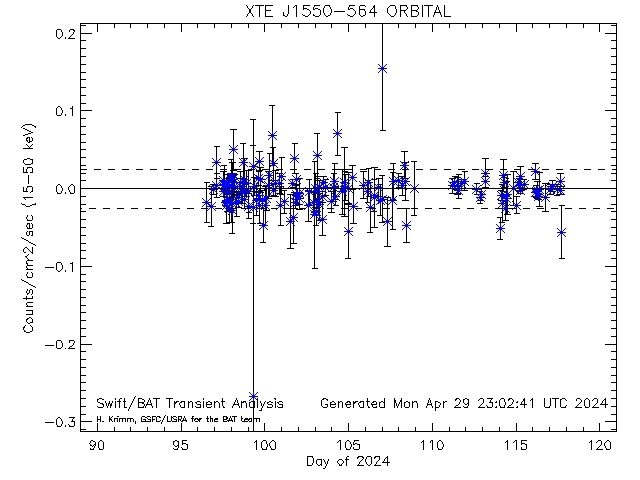
Dashed lines show average rate (and +/- 1 sigma standard deviation) for this source (derived from this plot)
[10575] XTE J1550-564 RA= 237.757 degs; Dec= -56.4580 degs
Daily light curves: FITS version ASCII version
Orbit light curves: FITS version ASCII version
Full mission light curve
-------------------------------------------------------------------------------------------------------------------------------------------------------------------
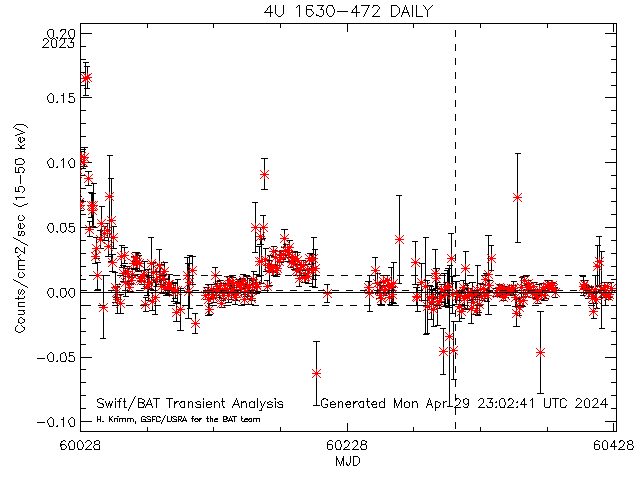
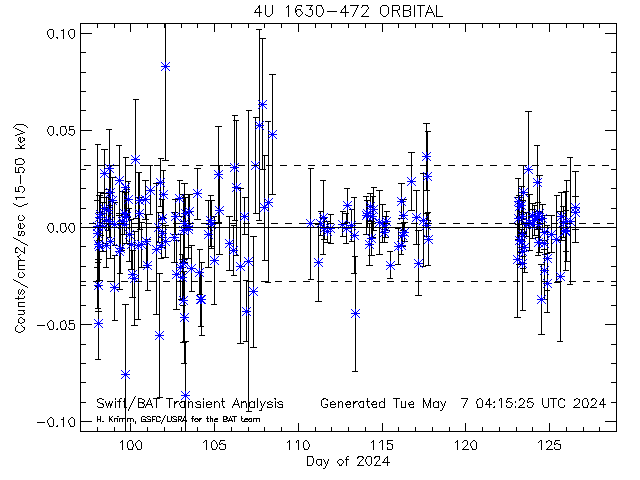
Dashed lines show average rate (and +/- 1 sigma standard deviation) for this source (derived from this plot)
[10022] 4U 1630-472 RA= 248.504 degs; Dec= -47.3930 degs
Daily light curves: FITS version ASCII version
Orbit light curves: FITS version ASCII version
Full mission light curve
-------------------------------------------------------------------------------------------------------------------------------------------------------------------

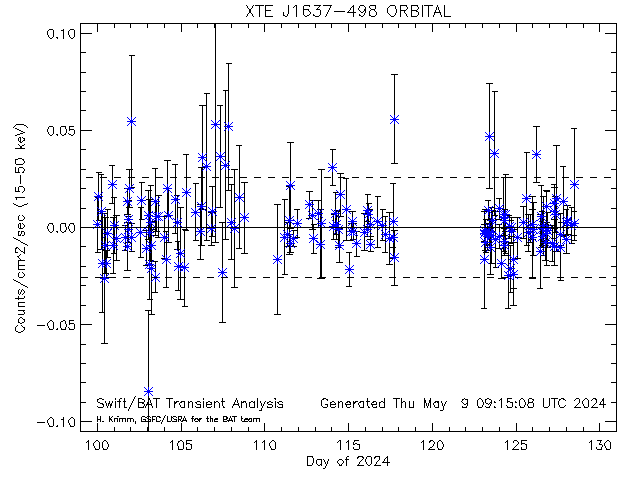
Dashed lines show average rate (and +/- 1 sigma standard deviation) for this source (derived from this plot)
[33696] XTE J1637-498 RA= 249.262 degs; Dec= -49.8600 degs
Daily light curves: FITS version ASCII version
Orbit light curves: FITS version ASCII version
Full mission light curve
-------------------------------------------------------------------------------------------------------------------------------------------------------------------
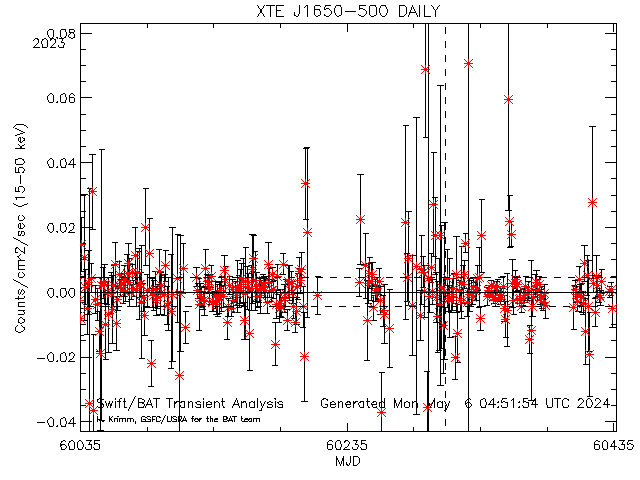
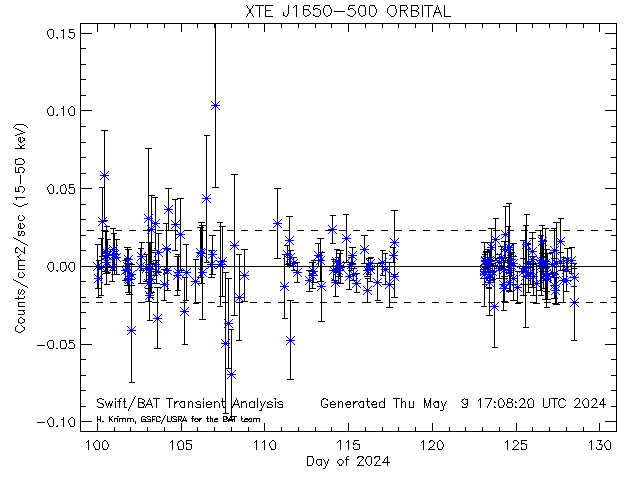
Dashed lines show average rate (and +/- 1 sigma standard deviation) for this source (derived from this plot)
[10123] XTE J1650-500 RA= 252.500 degs; Dec= -50.0000 degs
Daily light curves: FITS version ASCII version
Orbit light curves: FITS version ASCII version
Full mission light curve
-------------------------------------------------------------------------------------------------------------------------------------------------------------------
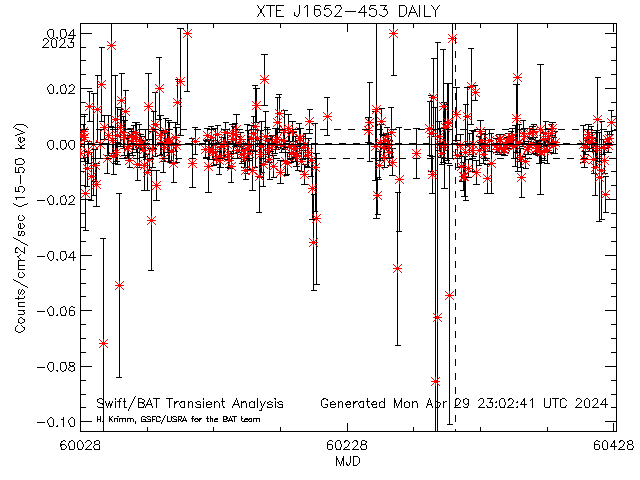
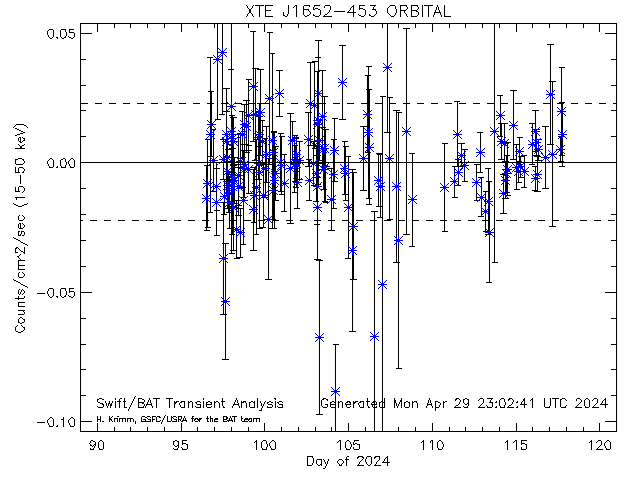
Dashed lines show average rate (and +/- 1 sigma standard deviation) for this source (derived from this plot)
[33882] XTE J1652-453 RA= 253.085 degs; Dec= -45.3440 degs
Daily light curves: FITS version ASCII version
Orbit light curves: FITS version ASCII version
Full mission light curve
-------------------------------------------------------------------------------------------------------------------------------------------------------------------
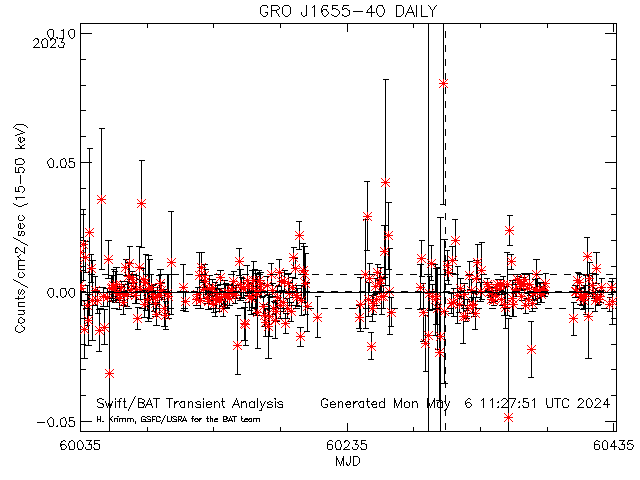
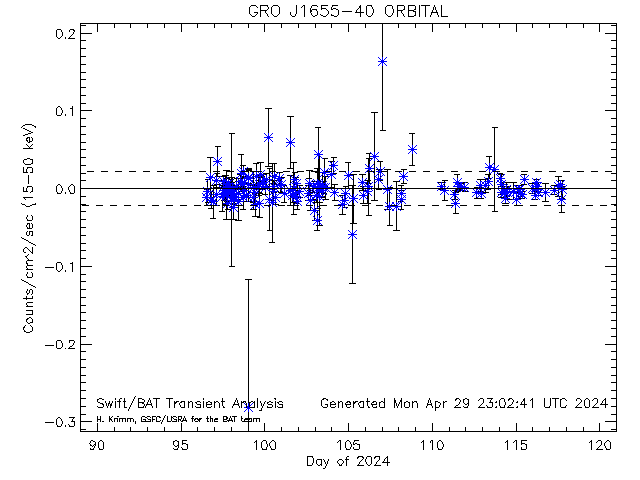
Dashed lines show average rate (and +/- 1 sigma standard deviation) for this source (derived from this plot)
[20001] GRO J1655-40 RA= 253.501 degs; Dec= -39.8333 degs
Daily light curves: FITS version ASCII version
Orbit light curves: FITS version ASCII version
Full mission light curve
-------------------------------------------------------------------------------------------------------------------------------------------------------------------
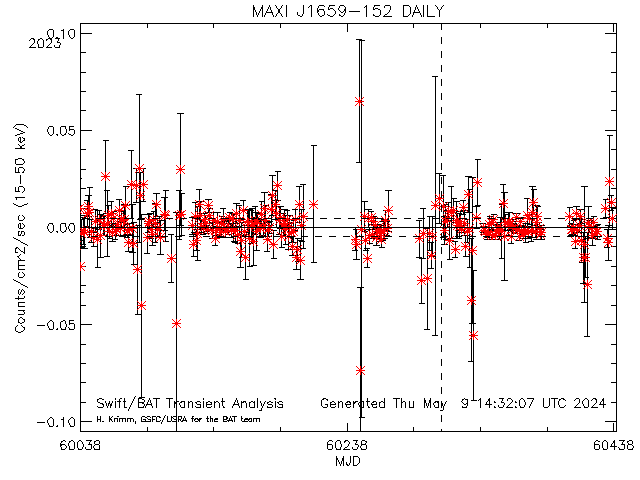
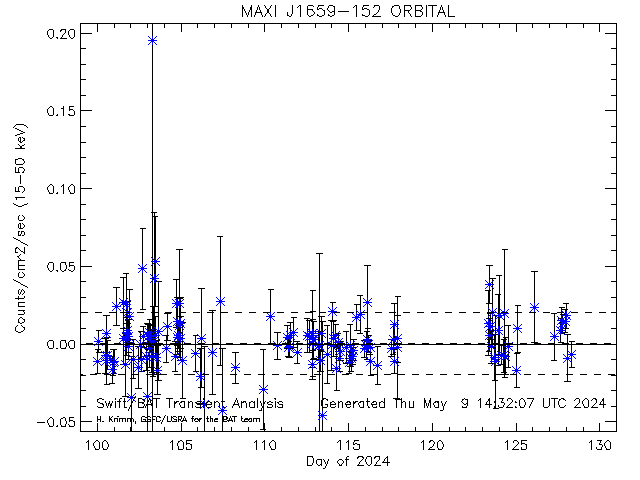
Dashed lines show average rate (and +/- 1 sigma standard deviation) for this source (derived from this plot)
[33953] MAXI J1659-152 RA= 254.757 degs; Dec= -15.2580 degs
Daily light curves: FITS version ASCII version
Orbit light curves: FITS version ASCII version
Full mission light curve
-------------------------------------------------------------------------------------------------------------------------------------------------------------------
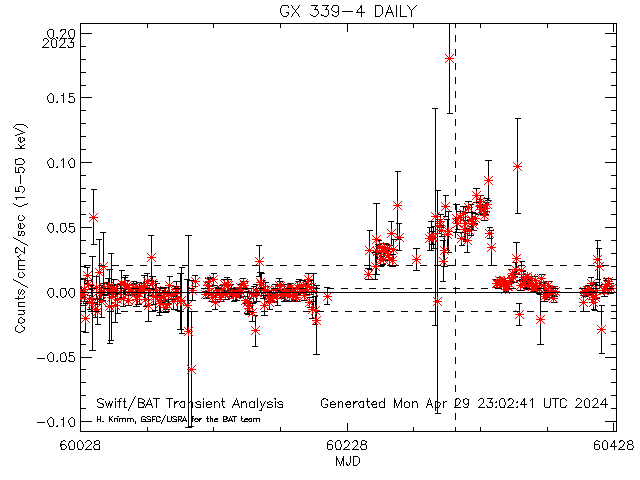
Dashed lines show average rate (and +/- 1 sigma standard deviation) for this source (derived from this plot)
[10053] GX 339-4 RA= 255.706 degs; Dec= -48.7900 degs
Daily light curves: FITS version ASCII version
Orbit light curves: FITS version ASCII version
Full mission light curve
-------------------------------------------------------------------------------------------------------------------------------------------------------------------
Dashed lines show average rate (and +/- 1 sigma standard deviation) for this source (derived from this plot)
[10071] H 1705-250 RA= 257.050 degs; Dec= -25.0830 degs
Daily light curves: FITS version ASCII version
Orbit light curves: FITS version ASCII version
Full mission light curve
-------------------------------------------------------------------------------------------------------------------------------------------------------------------
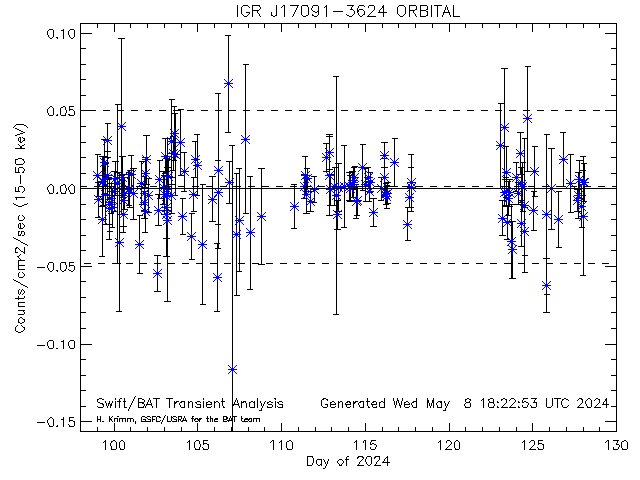
Dashed lines show average rate (and +/- 1 sigma standard deviation) for this source (derived from this plot)
[10638] IGR J17091-3624 RA= 257.282 degs; Dec= -36.4070 degs
Daily light curves: FITS version ASCII version
Orbit light curves: FITS version ASCII version
Full mission light curve
-------------------------------------------------------------------------------------------------------------------------------------------------------------------
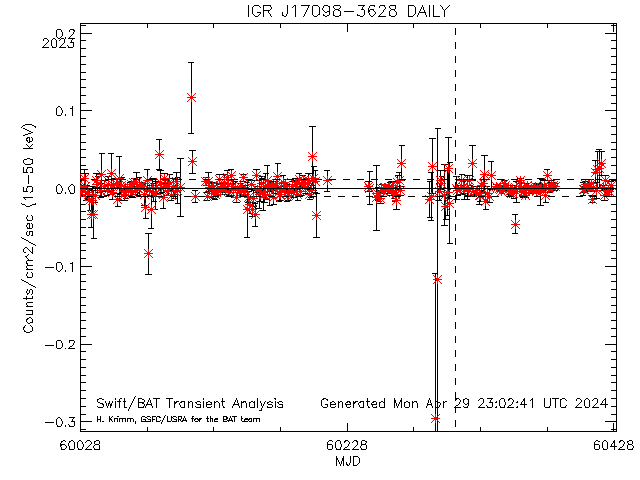
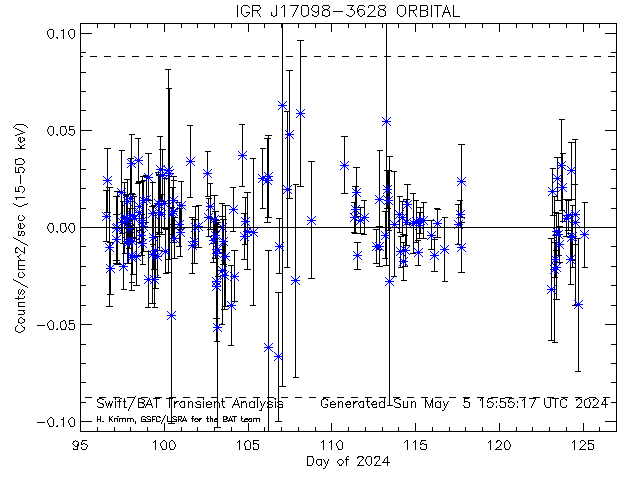
Dashed lines show average rate (and +/- 1 sigma standard deviation) for this source (derived from this plot)
[33960] IGR J17098-3628 RA= 257.441 degs; Dec= -36.4660 degs
Daily light curves: FITS version ASCII version
Orbit light curves: FITS version ASCII version
Full mission light curve
-------------------------------------------------------------------------------------------------------------------------------------------------------------------
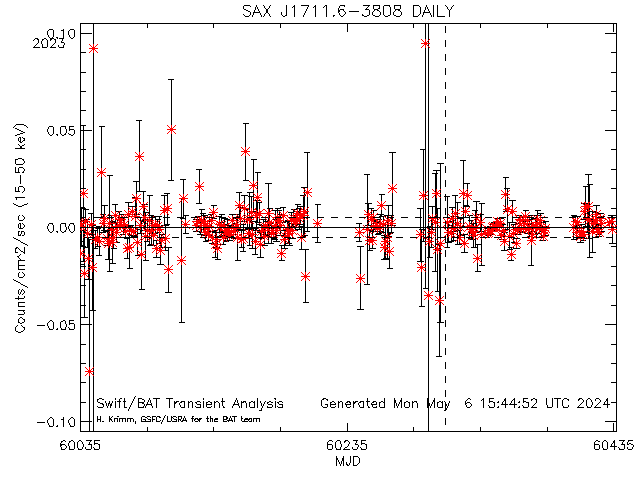
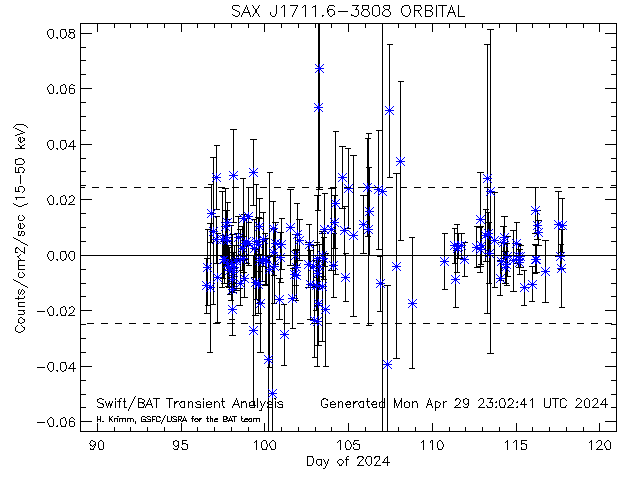
Dashed lines show average rate (and +/- 1 sigma standard deviation) for this source (derived from this plot)
[33870] SAX J1711.6-3808 RA= 257.900 degs; Dec= -38.1420 degs
Daily light curves: FITS version ASCII version
Orbit light curves: FITS version ASCII version
Full mission light curve
-------------------------------------------------------------------------------------------------------------------------------------------------------------------
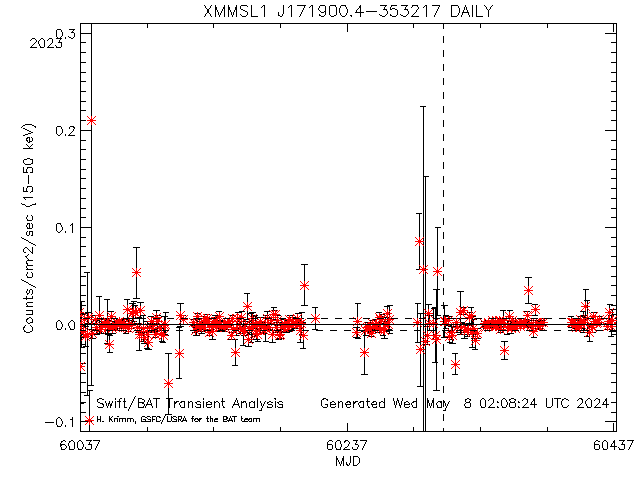
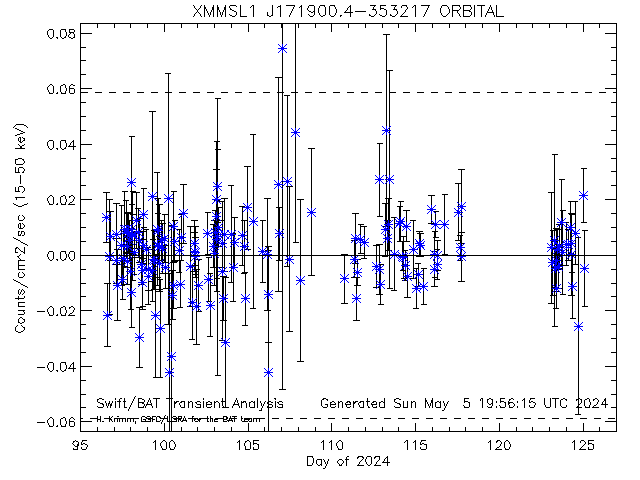
Dashed lines show average rate (and +/- 1 sigma standard deviation) for this source (derived from this plot)
[33942] XMMSL1 J171900.4-353217 RA= 259.752 degs; Dec= -35.5380 degs
Daily light curves: FITS version ASCII version
Orbit light curves: FITS version ASCII version
Full mission light curve
-------------------------------------------------------------------------------------------------------------------------------------------------------------------
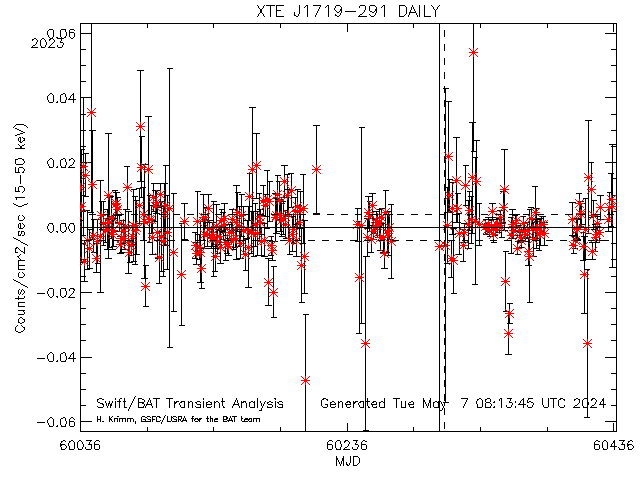
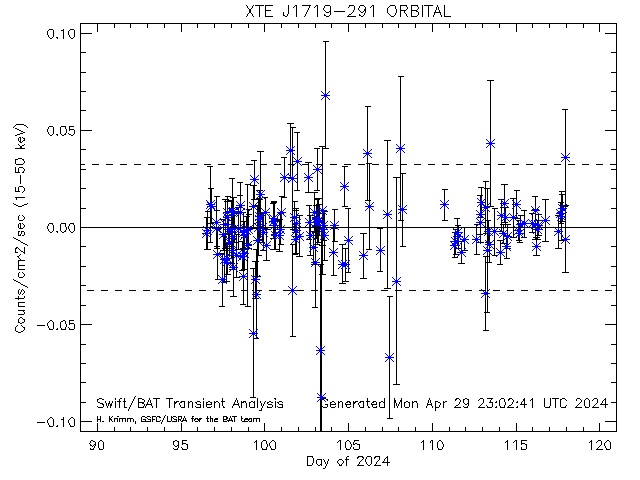
Dashed lines show average rate (and +/- 1 sigma standard deviation) for this source (derived from this plot)
[33646] XTE J1719-291 RA= 259.821 degs; Dec= -29.0690 degs
Daily light curves: FITS version ASCII version
Orbit light curves: FITS version ASCII version
Full mission light curve
-------------------------------------------------------------------------------------------------------------------------------------------------------------------
JACPOT name: GRS 1716-249
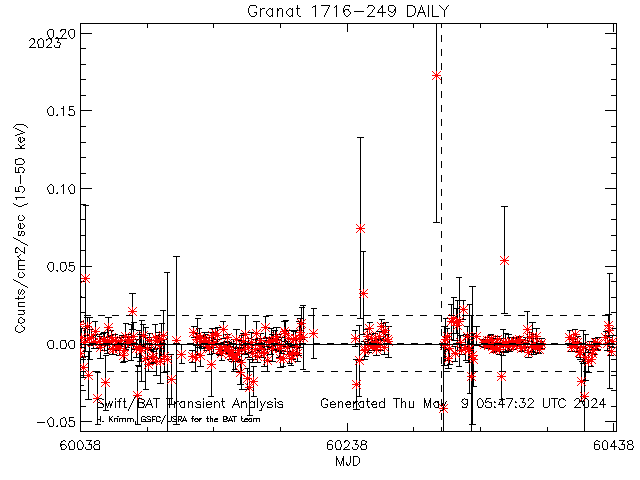
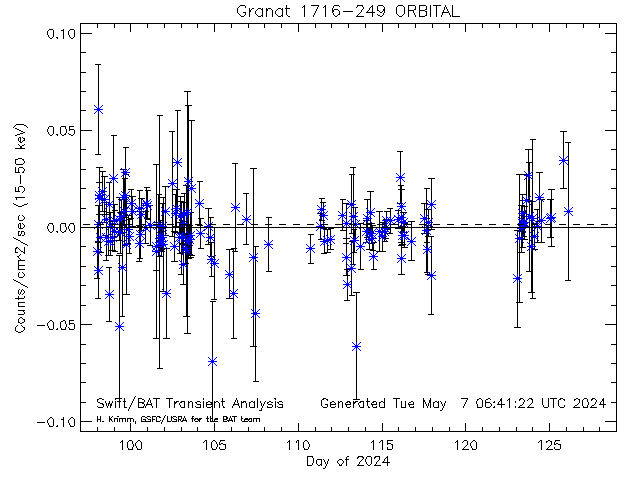
Dashed lines show average rate (and +/- 1 sigma standard deviation) for this source (derived from this plot)
JACPOT name: GRS 1716-249 [33871] Granat 1716-249 RA= 259.904 degs; Dec= -25.0180 degs
Daily light curves: FITS version ASCII version
Orbit light curves: FITS version ASCII version
Full mission light curve
-------------------------------------------------------------------------------------------------------------------------------------------------------------------
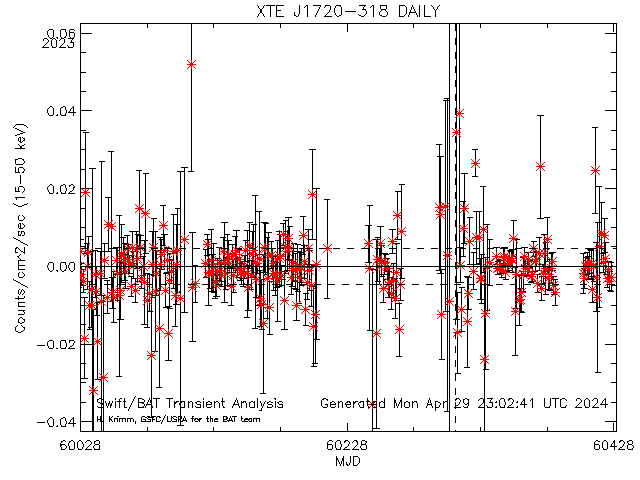
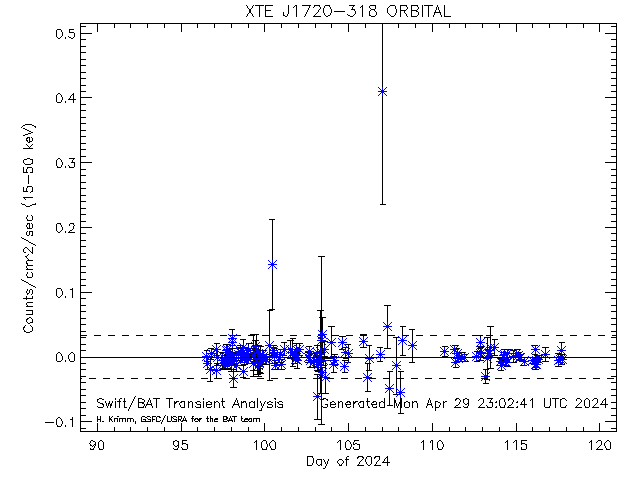
Dashed lines show average rate (and +/- 1 sigma standard deviation) for this source (derived from this plot)
[10585] XTE J1720-318 RA= 259.978 degs; Dec= -31.7480 degs
Daily light curves: FITS version ASCII version
Orbit light curves: FITS version ASCII version
Full mission light curve
-------------------------------------------------------------------------------------------------------------------------------------------------------------------
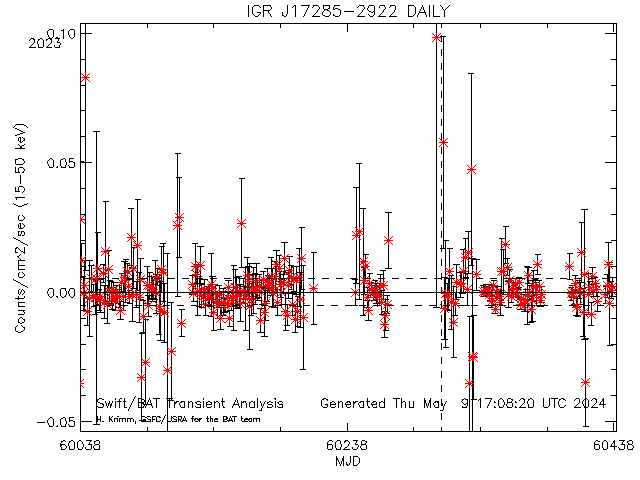
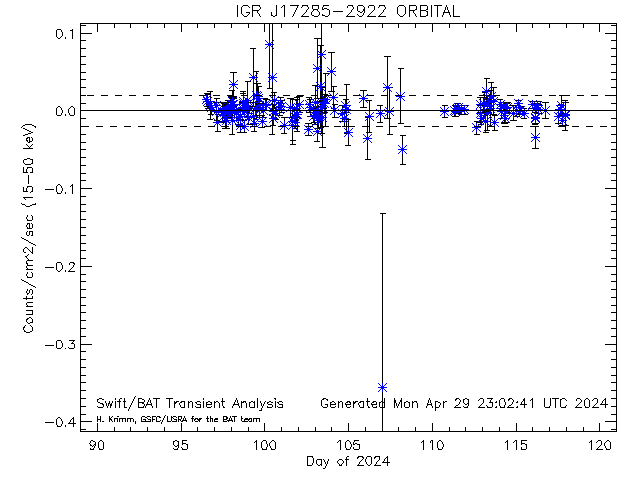
Dashed lines show average rate (and +/- 1 sigma standard deviation) for this source (derived from this plot)
[10643] IGR J17285-2922 RA= 262.171 degs; Dec= -29.3820 degs
Daily light curves: FITS version ASCII version
Orbit light curves: FITS version ASCII version
Full mission light curve
-------------------------------------------------------------------------------------------------------------------------------------------------------------------
JACPOT name: MXB 1730-335
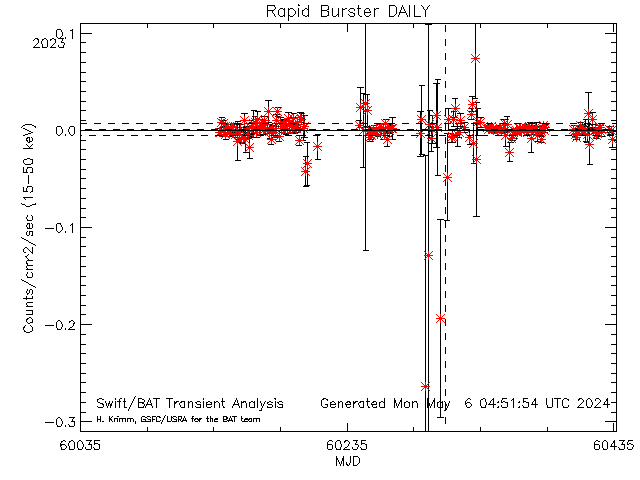
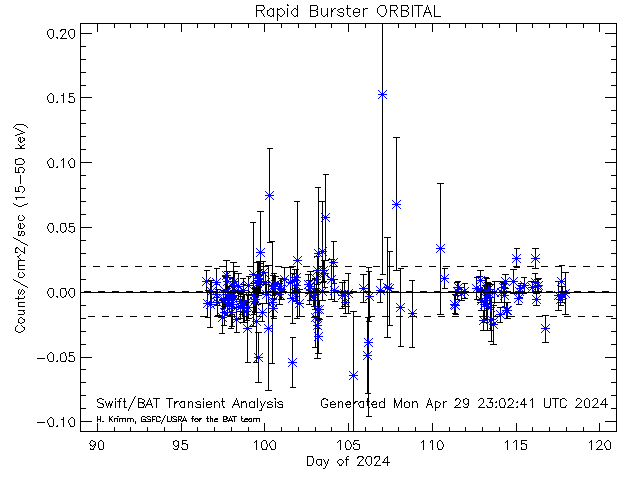
Dashed lines show average rate (and +/- 1 sigma standard deviation) for this source (derived from this plot)
JACPOT name: MXB 1730-335 [10354] Rapid Burster RA= 263.353 degs; Dec= -33.3880 degs
Daily light curves: FITS version ASCII version
Orbit light curves: FITS version ASCII version
Full mission light curve
-------------------------------------------------------------------------------------------------------------------------------------------------------------------
JACPOT name: KS 1730-312
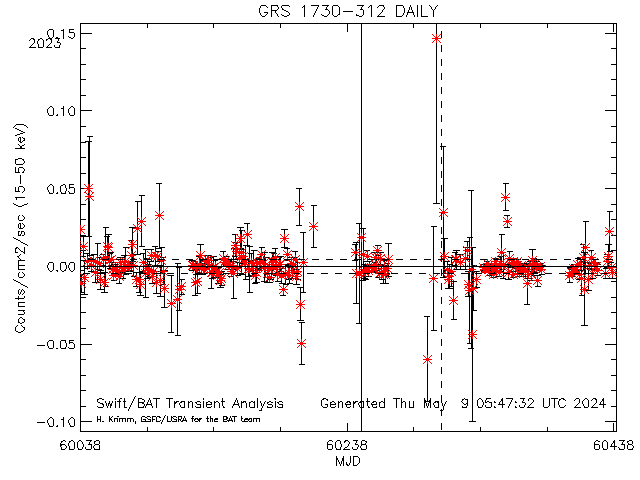
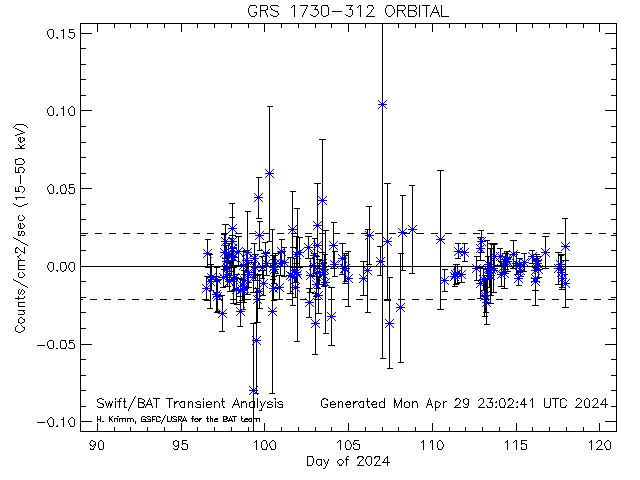
Dashed lines show average rate (and +/- 1 sigma standard deviation) for this source (derived from this plot)
JACPOT name: KS 1730-312 [10046] GRS 1730-312 RA= 263.380 degs; Dec= -31.2200 degs
Daily light curves: FITS version ASCII version
Orbit light curves: FITS version ASCII version
Full mission light curve
-------------------------------------------------------------------------------------------------------------------------------------------------------------------
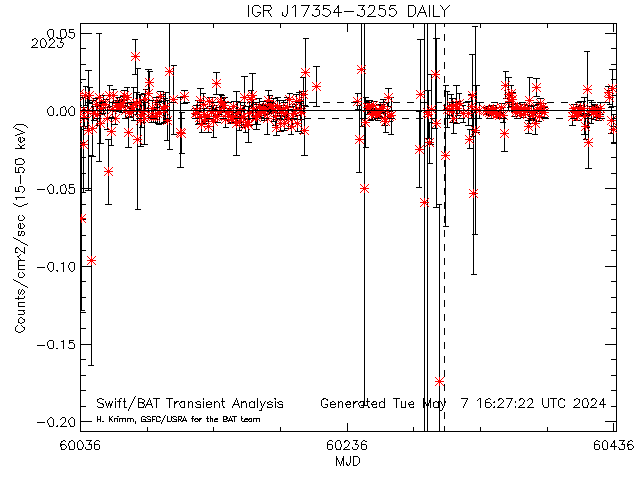
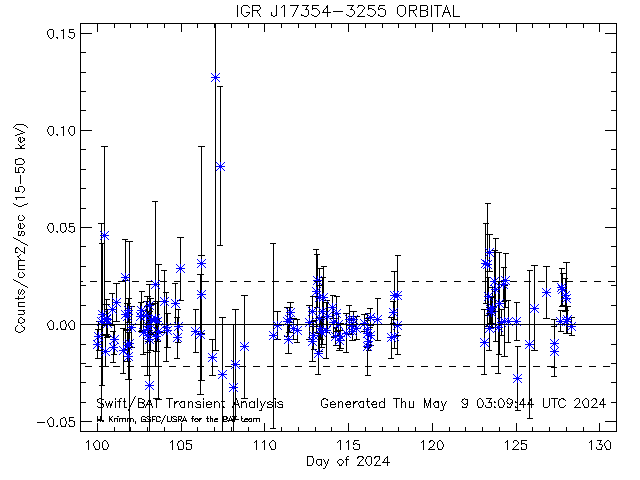
Dashed lines show average rate (and +/- 1 sigma standard deviation) for this source (derived from this plot)
[33853] IGR J17354-3255 RA= 263.854 degs; Dec= -32.9380 degs
Daily light curves: FITS version ASCII version
Orbit light curves: FITS version ASCII version
Full mission light curve
-------------------------------------------------------------------------------------------------------------------------------------------------------------------
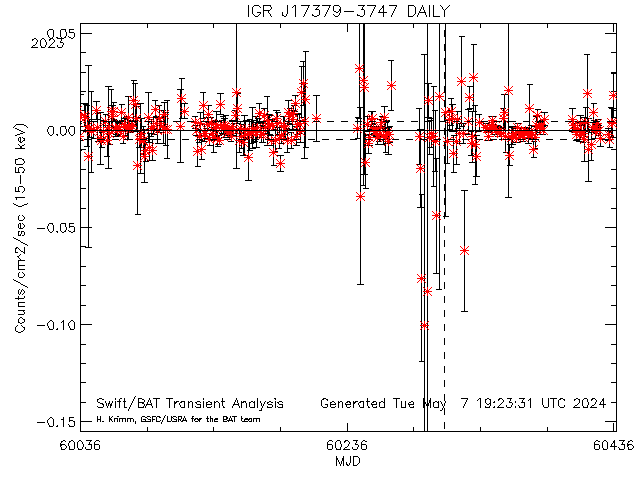
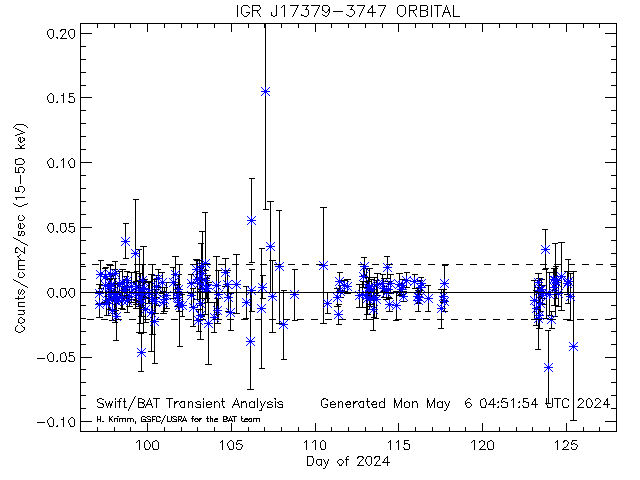
Dashed lines show average rate (and +/- 1 sigma standard deviation) for this source (derived from this plot)
[33698] IGR J17379-3747 RA= 264.495 degs; Dec= -37.7720 degs
Daily light curves: FITS version ASCII version
Orbit light curves: FITS version ASCII version
Full mission light curve
-------------------------------------------------------------------------------------------------------------------------------------------------------------------
JACPOT name: GRS 1737-31
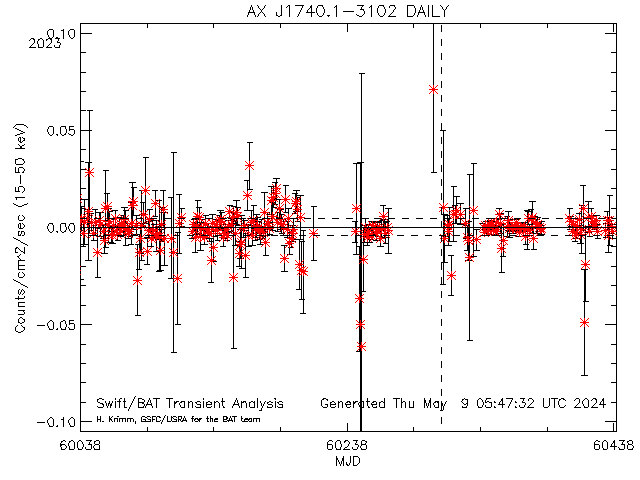
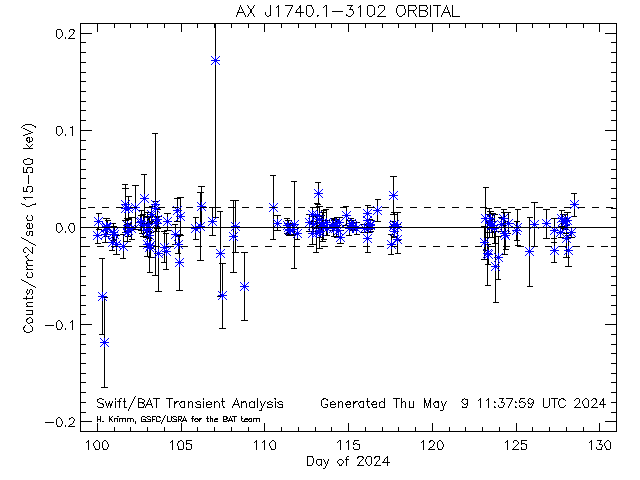
Dashed lines show average rate (and +/- 1 sigma standard deviation) for this source (derived from this plot)
JACPOT name: GRS 1737-31 [33872] AX J1740.1-3102 RA= 265.038 degs; Dec= -31.0400 degs
Daily light curves: FITS version ASCII version
Orbit light curves: FITS version ASCII version
Full mission light curve
-------------------------------------------------------------------------------------------------------------------------------------------------------------------
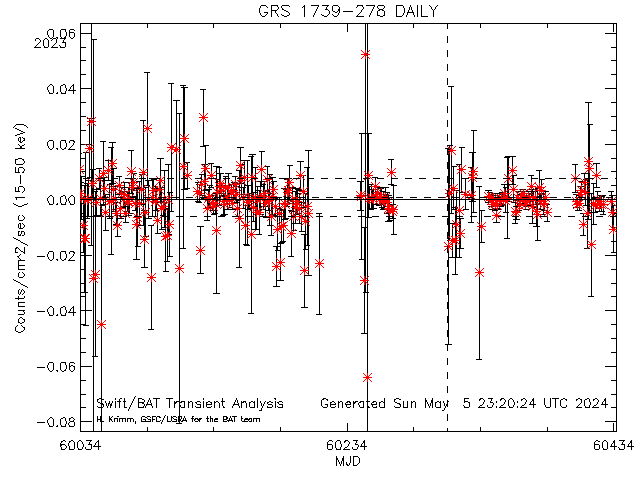
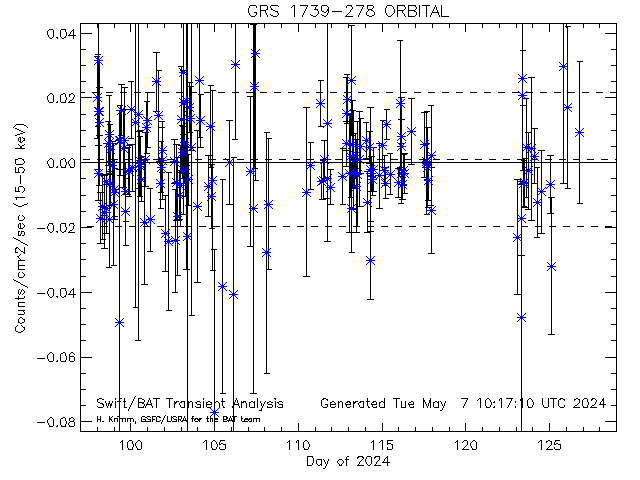
Dashed lines show average rate (and +/- 1 sigma standard deviation) for this source (derived from this plot)
[10047] GRS 1739-278 RA= 265.670 degs; Dec= -27.7600 degs
Daily light curves: FITS version ASCII version
Orbit light curves: FITS version ASCII version
Full mission light curve
-------------------------------------------------------------------------------------------------------------------------------------------------------------------
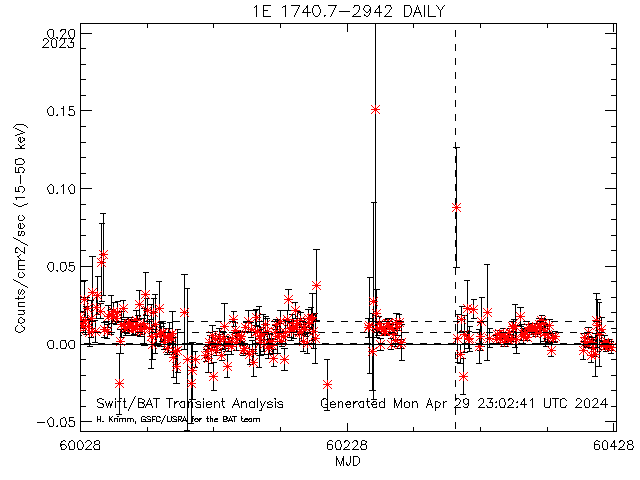
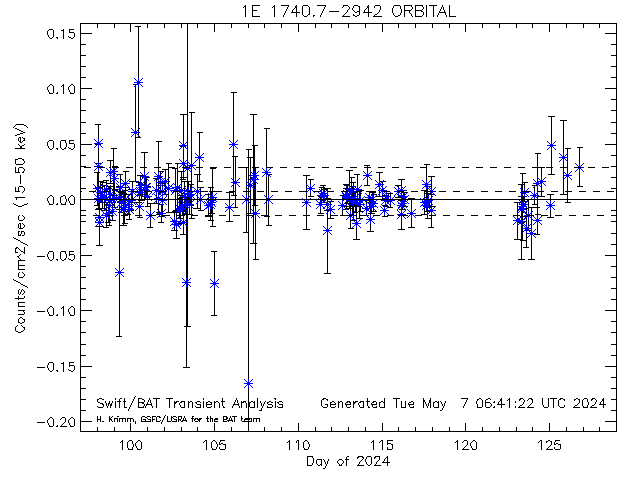
Dashed lines show average rate (and +/- 1 sigma standard deviation) for this source (derived from this plot)
[10006] 1E 1740.7-2942 RA= 265.978 degs; Dec= -29.7450 degs
Daily light curves: FITS version ASCII version
Orbit light curves: FITS version ASCII version
Full mission light curve
-------------------------------------------------------------------------------------------------------------------------------------------------------------------
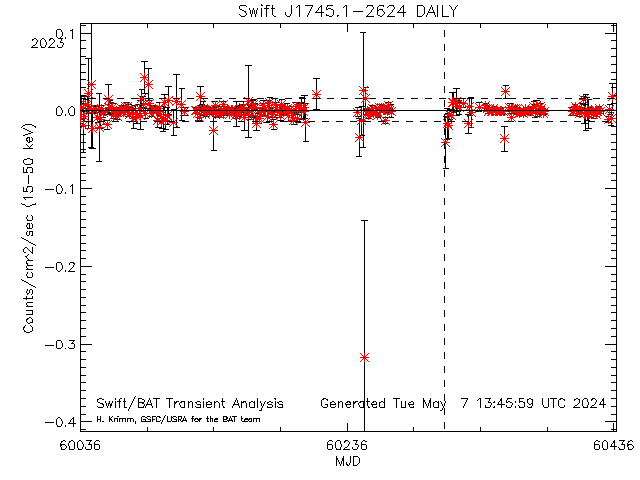
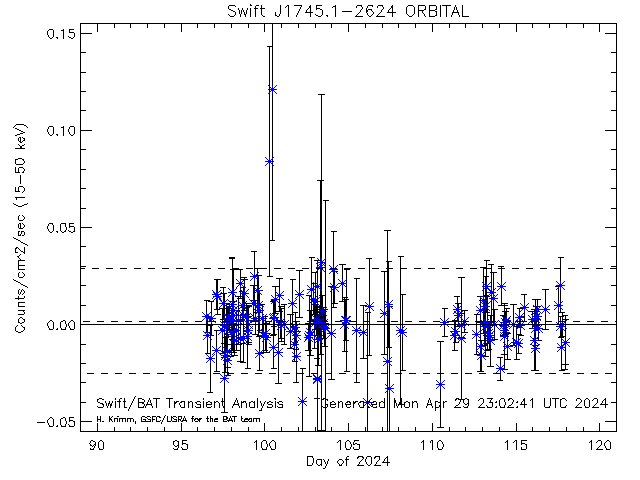
Dashed lines show average rate (and +/- 1 sigma standard deviation) for this source (derived from this plot)
[34060] Swift J1745.1-2624 RA= 266.295 degs; Dec= -26.4030 degs
Daily light curves: FITS version ASCII version
Orbit light curves: FITS version ASCII version
Full mission light curve
-------------------------------------------------------------------------------------------------------------------------------------------------------------------
JACPOT name: H 1743-322
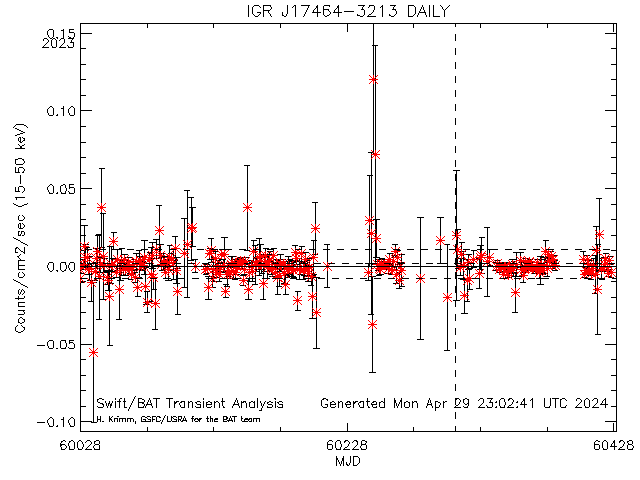
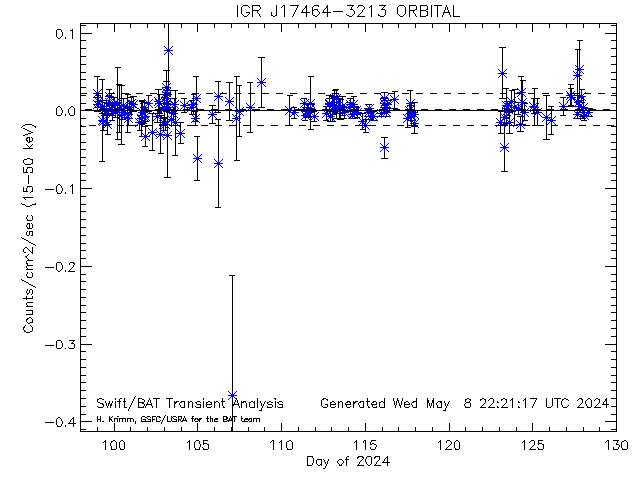
Dashed lines show average rate (and +/- 1 sigma standard deviation) for this source (derived from this plot)
JACPOT name: H 1743-322 [10650] IGR J17464-3213 RA= 266.565 degs; Dec= -32.2340 degs
Daily light curves: FITS version ASCII version
Orbit light curves: FITS version ASCII version
Full mission light curve
-------------------------------------------------------------------------------------------------------------------------------------------------------------------
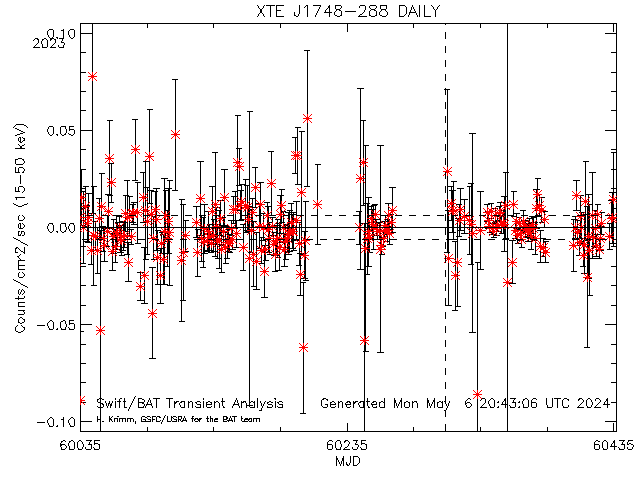
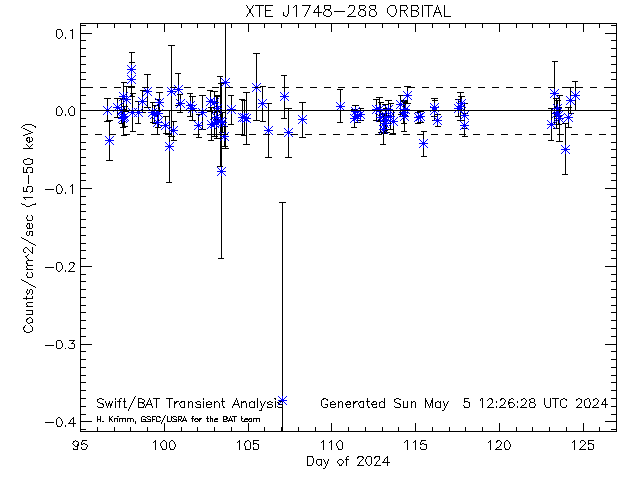
Dashed lines show average rate (and +/- 1 sigma standard deviation) for this source (derived from this plot)
[33866] XTE J1748-288 RA= 267.021 degs; Dec= -28.4740 degs
Daily light curves: FITS version ASCII version
Orbit light curves: FITS version ASCII version
Full mission light curve
-------------------------------------------------------------------------------------------------------------------------------------------------------------------
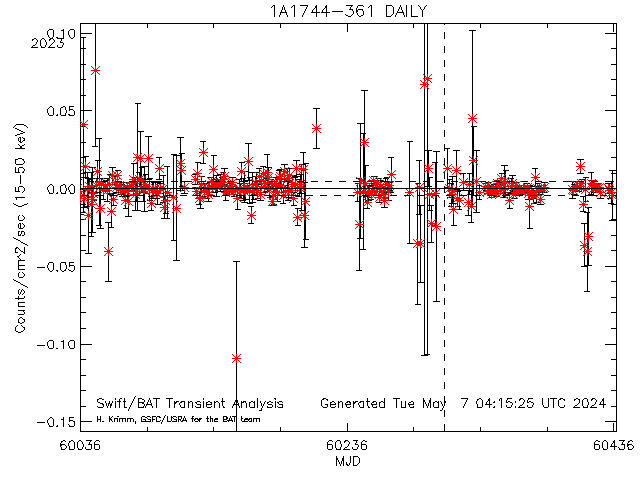
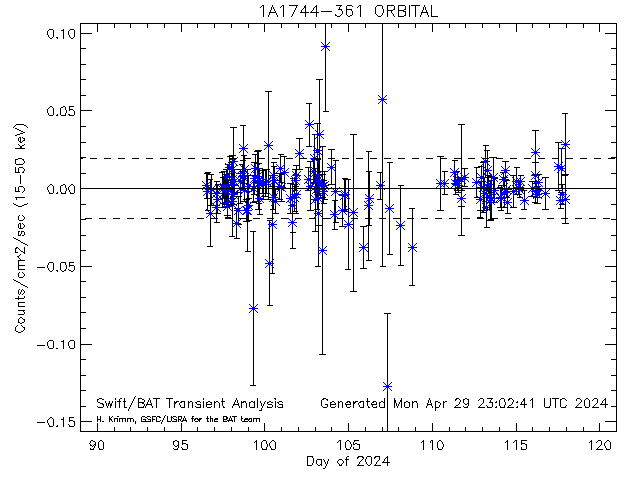
Dashed lines show average rate (and +/- 1 sigma standard deviation) for this source (derived from this plot)
[33670] 1A1744-361 RA= 267.080 degs; Dec= -36.1210 degs
Daily light curves: FITS version ASCII version
Orbit light curves: FITS version ASCII version
Full mission light curve
-------------------------------------------------------------------------------------------------------------------------------------------------------------------
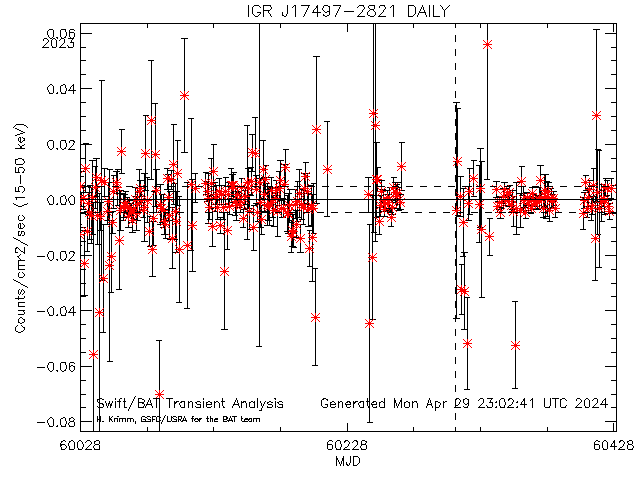
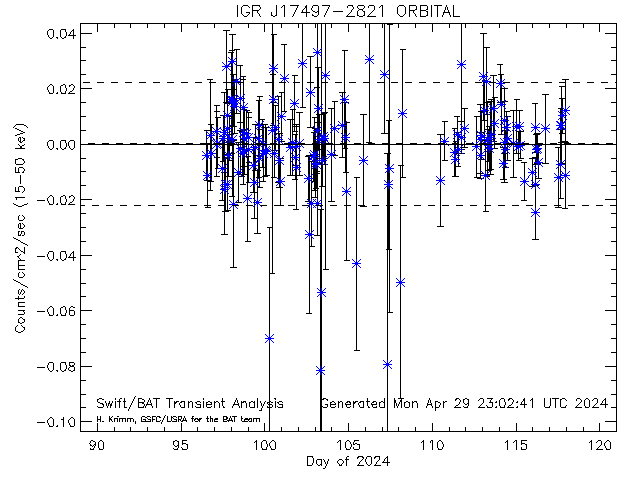
Dashed lines show average rate (and +/- 1 sigma standard deviation) for this source (derived from this plot)
[30130] IGR J17497-2821 RA= 267.409 degs; Dec= -28.3547 degs
Daily light curves: FITS version ASCII version
Orbit light curves: FITS version ASCII version
Full mission light curve
-------------------------------------------------------------------------------------------------------------------------------------------------------------------
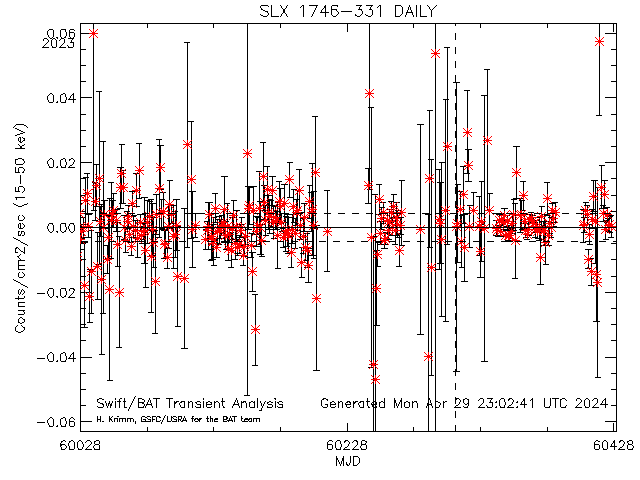
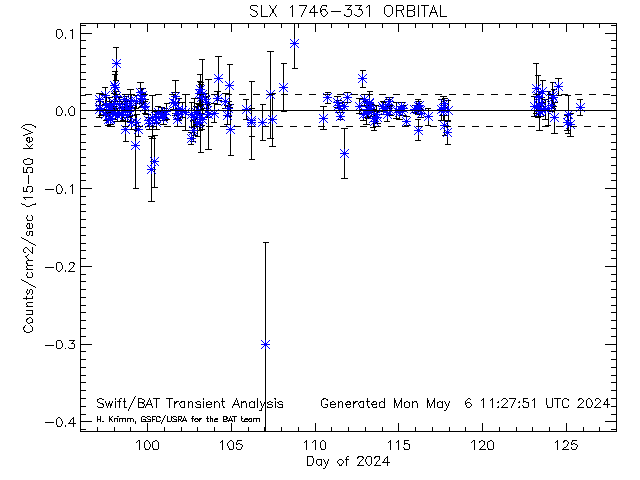
Dashed lines show average rate (and +/- 1 sigma standard deviation) for this source (derived from this plot)
[33617] SLX 1746-331 RA= 267.452 degs; Dec= -33.2051 degs
Daily light curves: FITS version ASCII version
Orbit light curves: FITS version ASCII version
Full mission light curve
-------------------------------------------------------------------------------------------------------------------------------------------------------------------
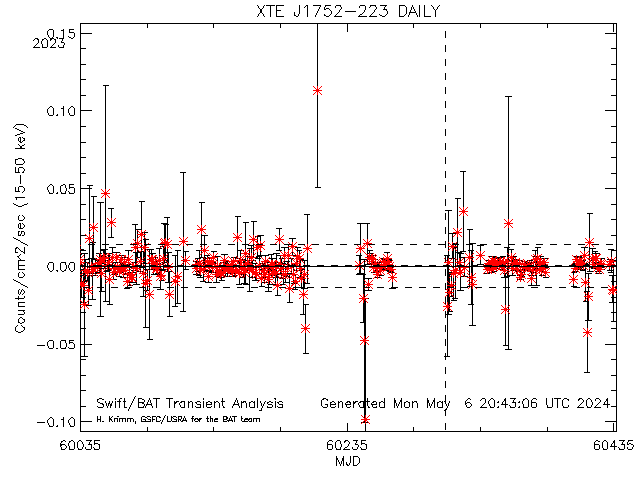
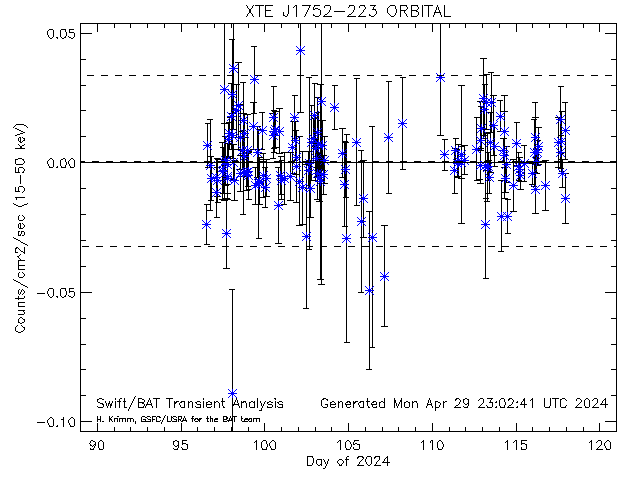
Dashed lines show average rate (and +/- 1 sigma standard deviation) for this source (derived from this plot)
[33906] XTE J1752-223 RA= 268.063 degs; Dec= -22.3420 degs
Daily light curves: FITS version ASCII version
Orbit light curves: FITS version ASCII version
Full mission light curve
-------------------------------------------------------------------------------------------------------------------------------------------------------------------
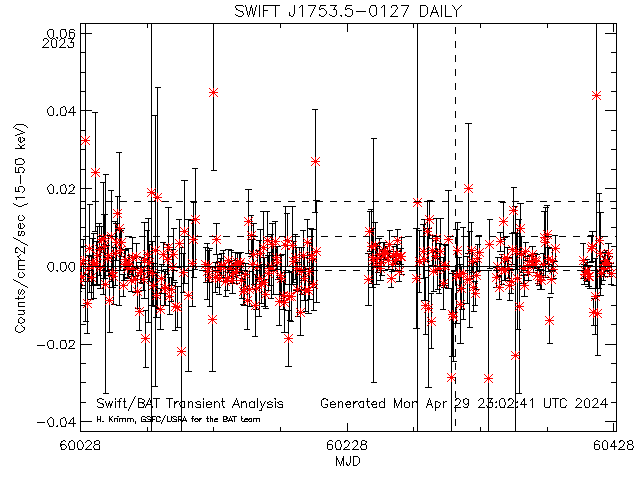
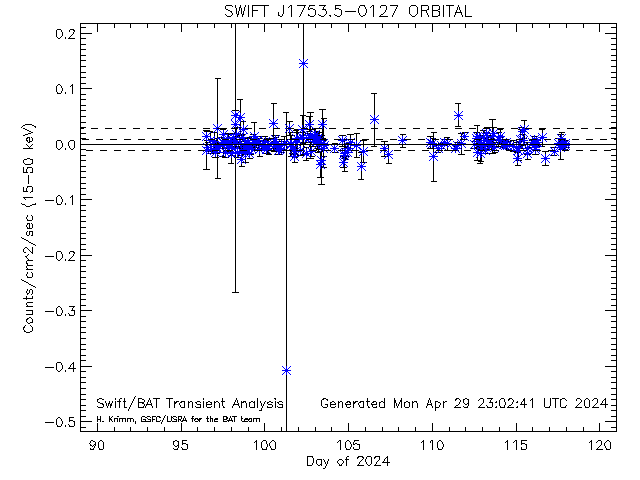
Dashed lines show average rate (and +/- 1 sigma standard deviation) for this source (derived from this plot)
[20009] SWIFT J1753.5-0127 RA= 268.368 degs; Dec= -1.45260 degs
Daily light curves: FITS version ASCII version
Orbit light curves: FITS version ASCII version
Full mission light curve
-------------------------------------------------------------------------------------------------------------------------------------------------------------------
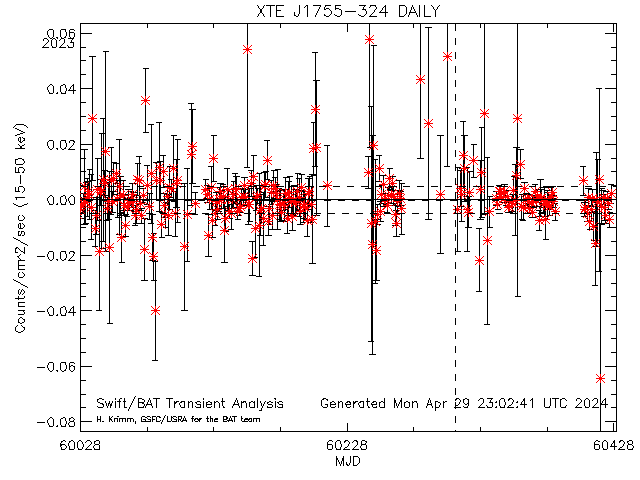
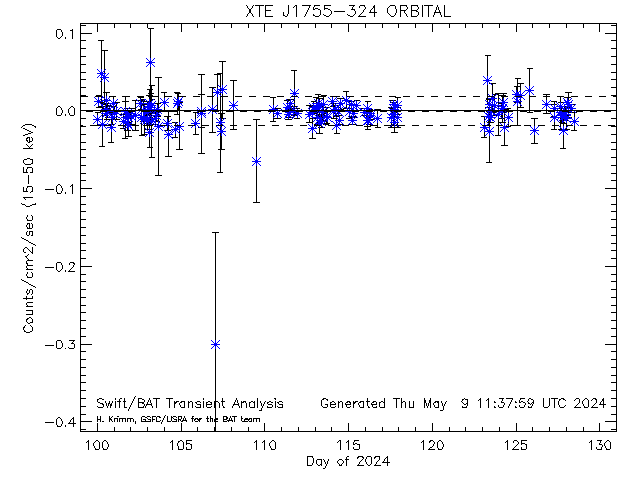
Dashed lines show average rate (and +/- 1 sigma standard deviation) for this source (derived from this plot)
[33873] XTE J1755-324 RA= 268.870 degs; Dec= -32.4780 degs
Daily light curves: FITS version ASCII version
Orbit light curves: FITS version ASCII version
Full mission light curve
-------------------------------------------------------------------------------------------------------------------------------------------------------------------
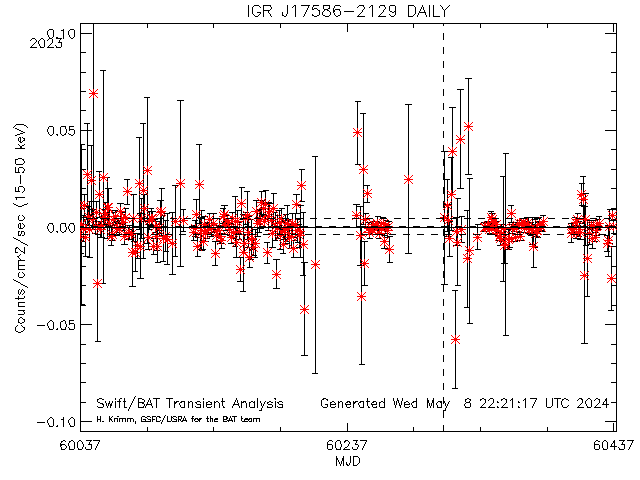

Dashed lines show average rate (and +/- 1 sigma standard deviation) for this source (derived from this plot)
[33880] IGR J17586-2129 RA= 269.644 degs; Dec= -21.3890 degs
Daily light curves: FITS version ASCII version
Orbit light curves: FITS version ASCII version
Full mission light curve
-------------------------------------------------------------------------------------------------------------------------------------------------------------------
JACPOT name: Ginga 1755-338
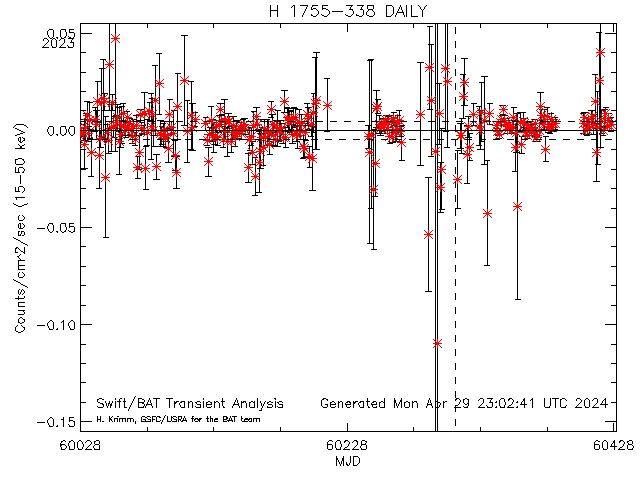
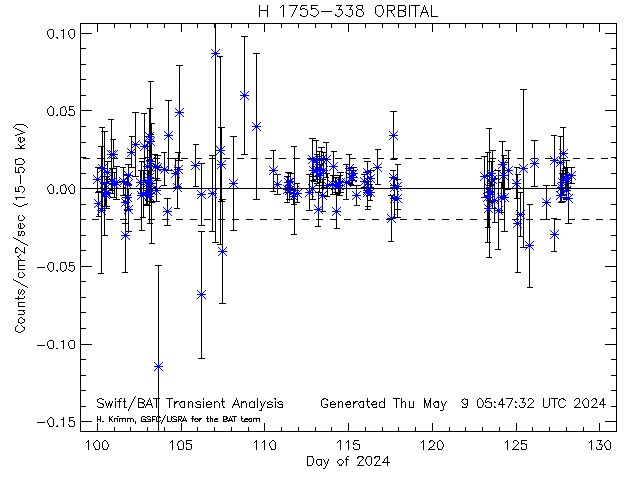
Dashed lines show average rate (and +/- 1 sigma standard deviation) for this source (derived from this plot)
JACPOT name: Ginga 1755-338 [10075] H 1755-338 RA= 269.675 degs; Dec= -33.8170 degs
Daily light curves: FITS version ASCII version
Orbit light curves: FITS version ASCII version
Full mission light curve
-------------------------------------------------------------------------------------------------------------------------------------------------------------------
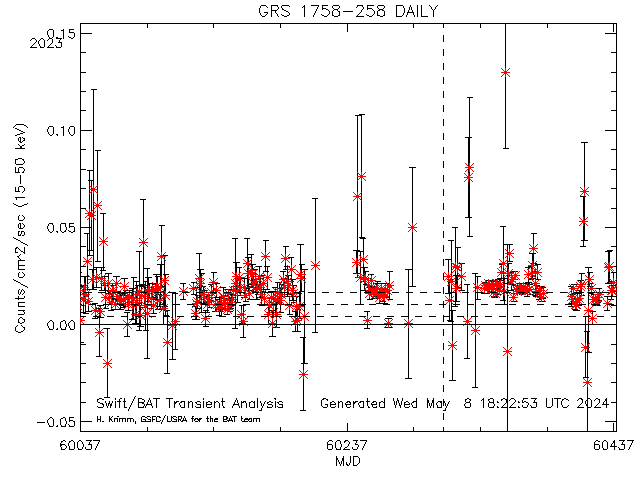
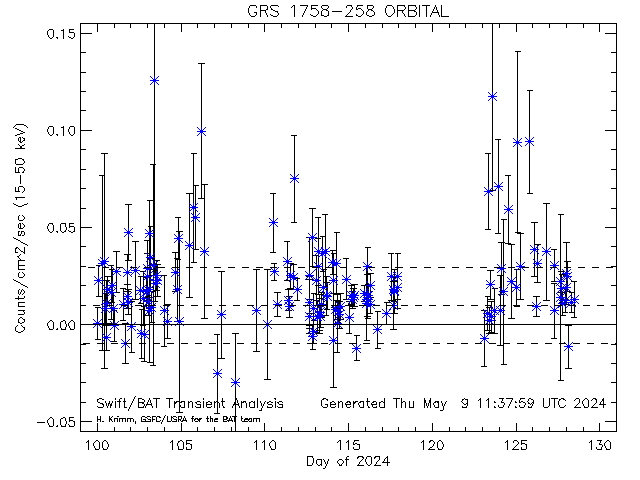
Dashed lines show average rate (and +/- 1 sigma standard deviation) for this source (derived from this plot)
[10048] GRS 1758-258 RA= 270.302 degs; Dec= -25.7430 degs
Daily light curves: FITS version ASCII version
Orbit light curves: FITS version ASCII version
Full mission light curve
-------------------------------------------------------------------------------------------------------------------------------------------------------------------
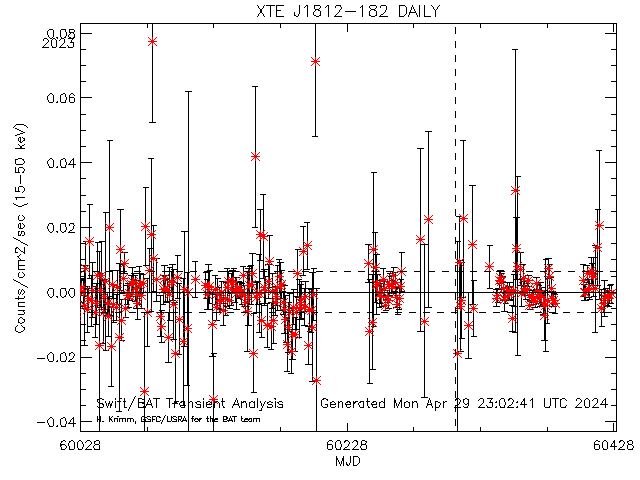
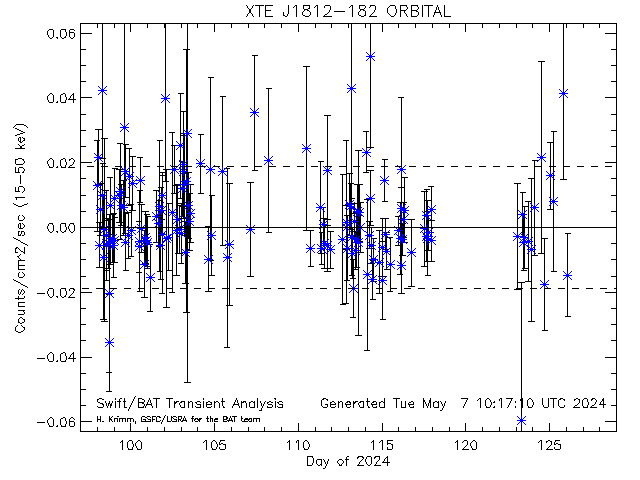
Dashed lines show average rate (and +/- 1 sigma standard deviation) for this source (derived from this plot)
[33693] XTE J1812-182 RA= 273.116 degs; Dec= -18.2090 degs
Daily light curves: FITS version ASCII version
Orbit light curves: FITS version ASCII version
Full mission light curve
-------------------------------------------------------------------------------------------------------------------------------------------------------------------
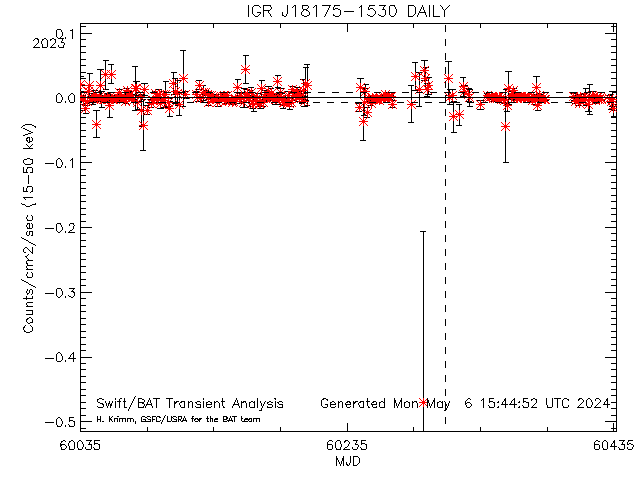
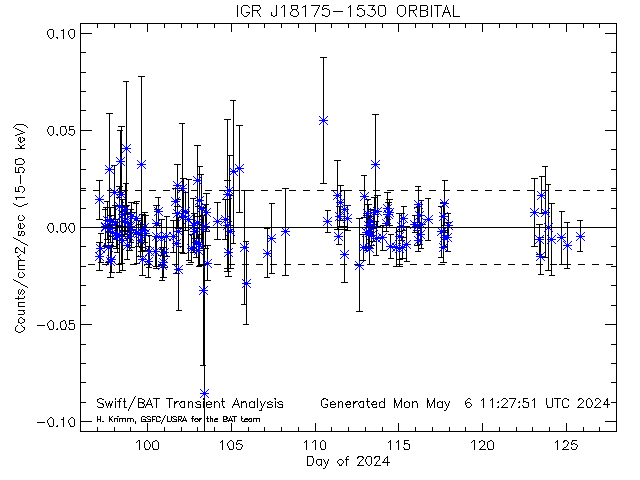
Dashed lines show average rate (and +/- 1 sigma standard deviation) for this source (derived from this plot)
[33729] IGR J18175-1530 RA= 274.393 degs; Dec= -15.5110 degs
Daily light curves: FITS version ASCII version
Orbit light curves: FITS version ASCII version
Full mission light curve
-------------------------------------------------------------------------------------------------------------------------------------------------------------------
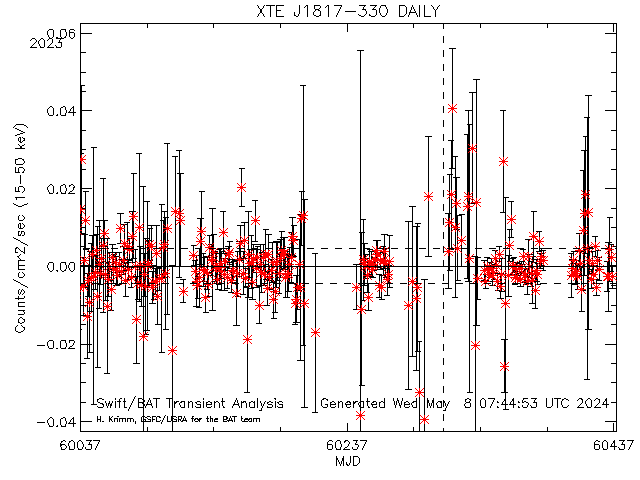
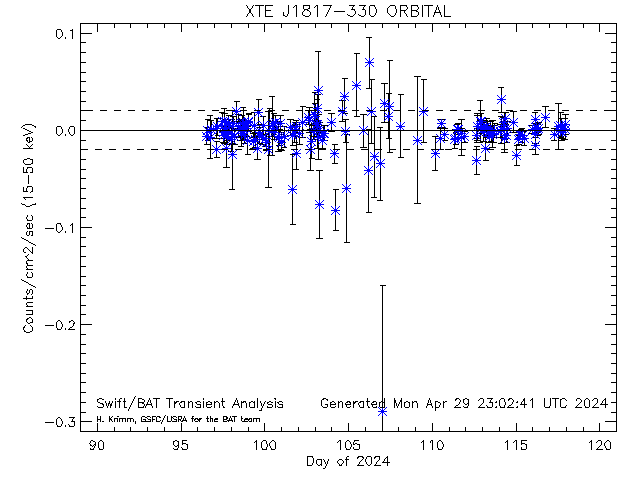
Dashed lines show average rate (and +/- 1 sigma standard deviation) for this source (derived from this plot)
[20017] XTE J1817-330 RA= 274.431 degs; Dec= -33.0190 degs
Daily light curves: FITS version ASCII version
Orbit light curves: FITS version ASCII version
Full mission light curve
-------------------------------------------------------------------------------------------------------------------------------------------------------------------
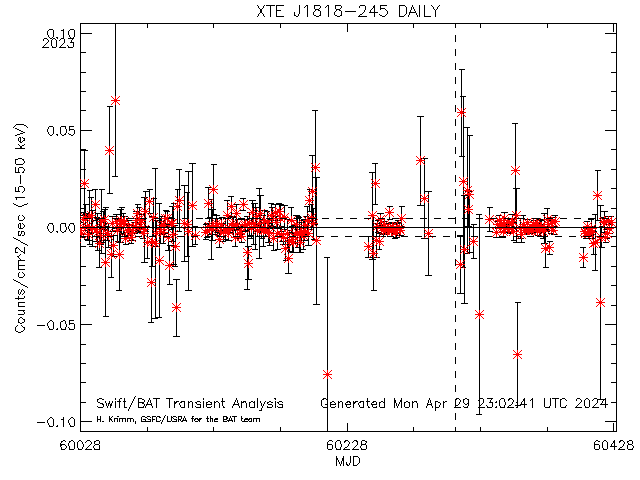
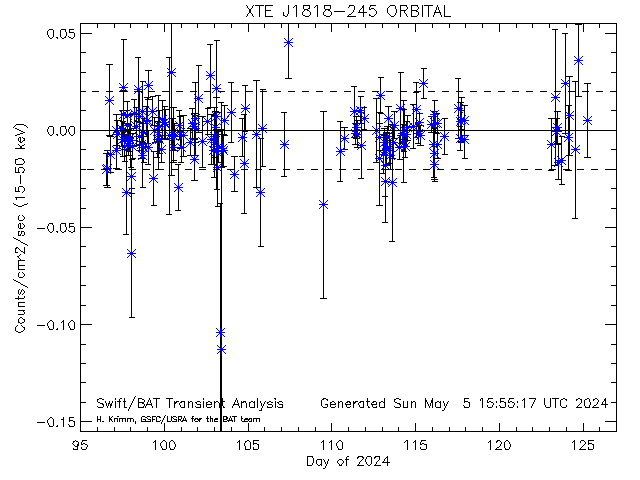
Dashed lines show average rate (and +/- 1 sigma standard deviation) for this source (derived from this plot)
[10558] XTE J1818-245 RA= 274.603 degs; Dec= -24.5380 degs
Daily light curves: FITS version ASCII version
Orbit light curves: FITS version ASCII version
Full mission light curve
-------------------------------------------------------------------------------------------------------------------------------------------------------------------
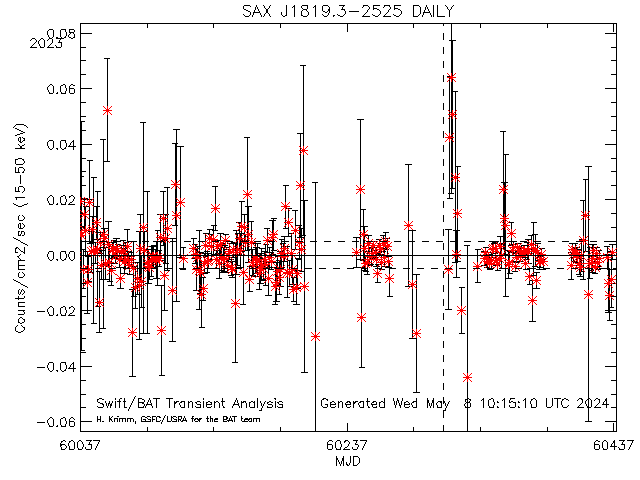
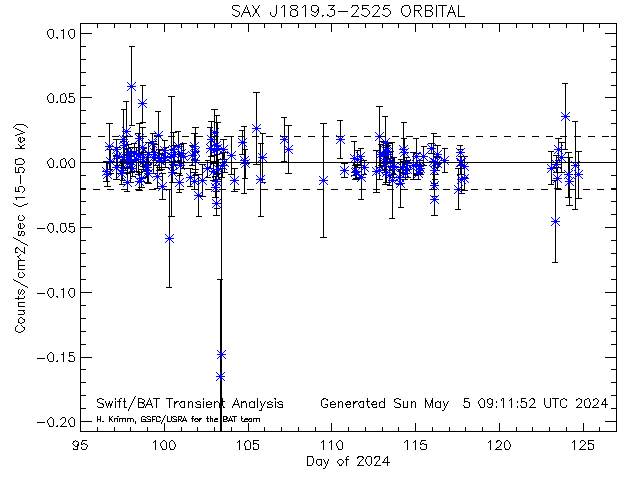
Dashed lines show average rate (and +/- 1 sigma standard deviation) for this source (derived from this plot)
[10112] SAX J1819.3-2525 RA= 274.840 degs; Dec= -25.4070 degs
Daily light curves: FITS version ASCII version
Orbit light curves: FITS version ASCII version
Full mission light curve
-------------------------------------------------------------------------------------------------------------------------------------------------------------------
JACPOT name: 4U 1820-30
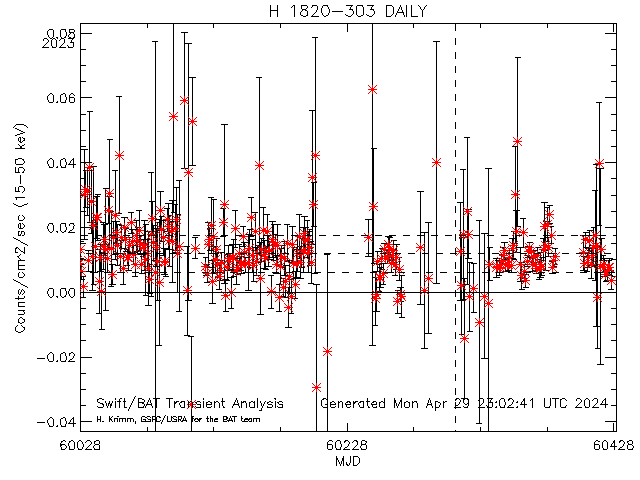
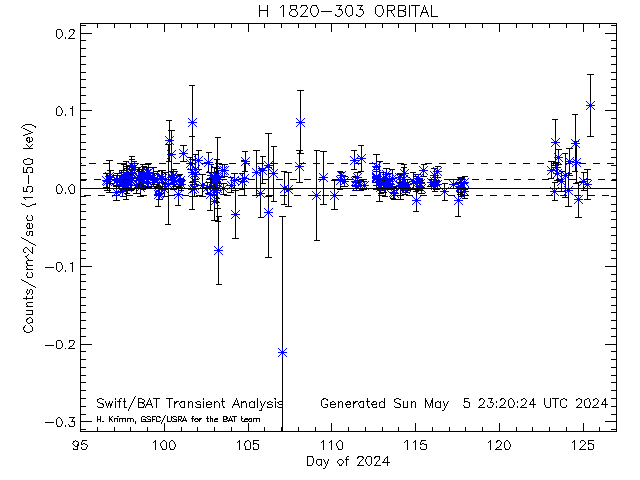
Dashed lines show average rate (and +/- 1 sigma standard deviation) for this source (derived from this plot)
JACPOT name: 4U 1820-30 [10076] H 1820-303 RA= 275.919 degs; Dec= -30.3610 degs
Daily light curves: FITS version ASCII version
Orbit light curves: FITS version ASCII version
Full mission light curve
-------------------------------------------------------------------------------------------------------------------------------------------------------------------
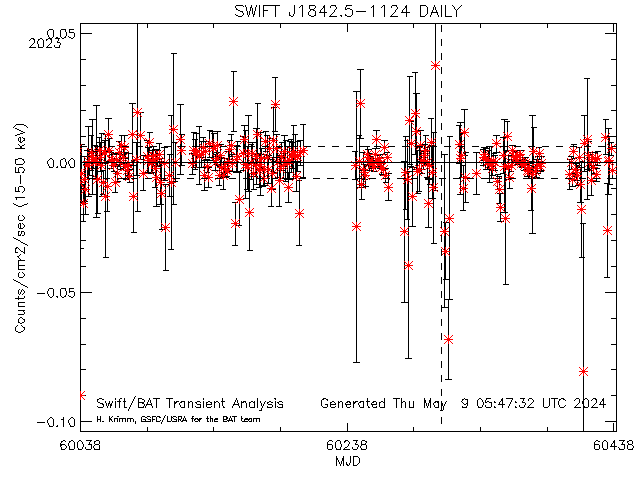
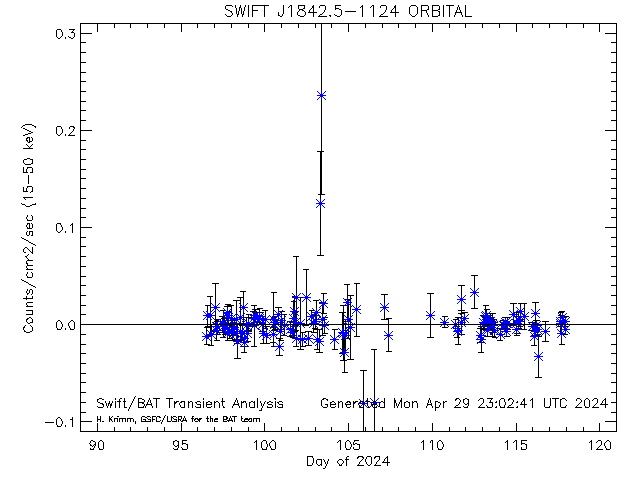
Dashed lines show average rate (and +/- 1 sigma standard deviation) for this source (derived from this plot)
[33673] SWIFT J1842.5-1124 RA= 280.573 degs; Dec= -11.4180 degs
Daily light curves: FITS version ASCII version
Orbit light curves: FITS version ASCII version
Full mission light curve
-------------------------------------------------------------------------------------------------------------------------------------------------------------------
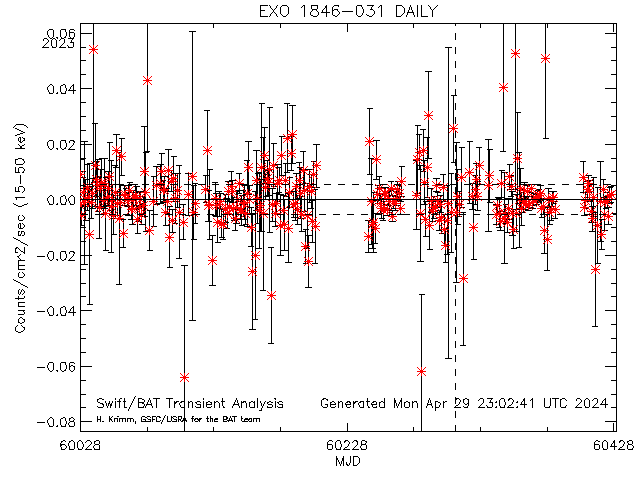
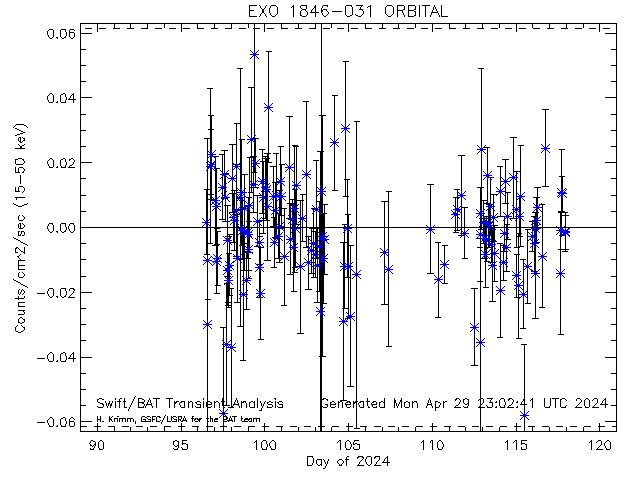
Dashed lines show average rate (and +/- 1 sigma standard deviation) for this source (derived from this plot)
[33868] EXO 1846-031 RA= 282.321 degs; Dec= -3.06200 degs
Daily light curves: FITS version ASCII version
Orbit light curves: FITS version ASCII version
Full mission light curve
-------------------------------------------------------------------------------------------------------------------------------------------------------------------
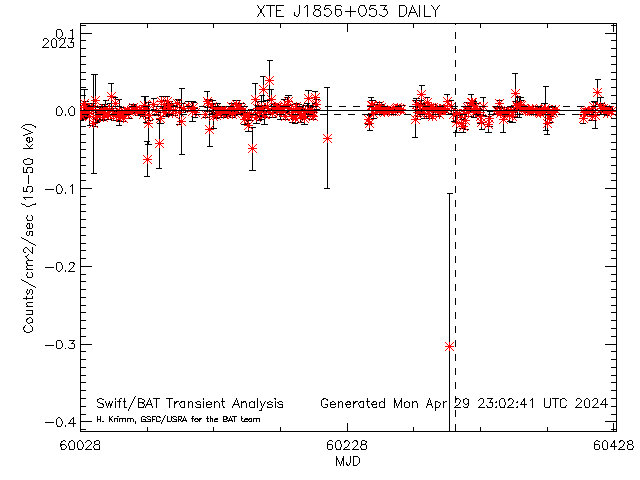
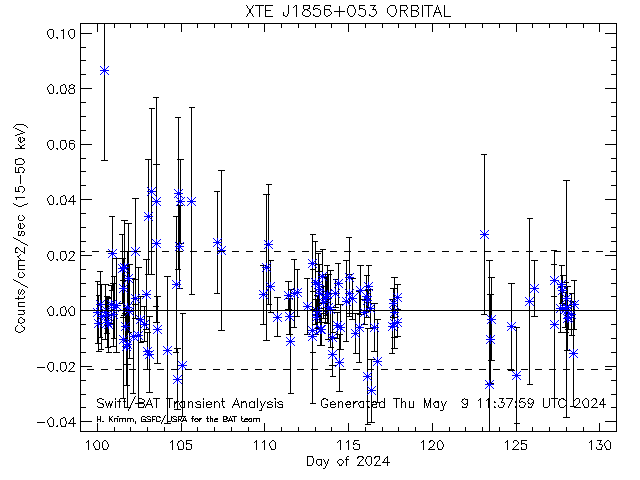
Dashed lines show average rate (and +/- 1 sigma standard deviation) for this source (derived from this plot)
[33592] XTE J1856+053 RA= 284.163 degs; Dec= 5.33000 degs
Daily light curves: FITS version ASCII version
Orbit light curves: FITS version ASCII version
Full mission light curve
-------------------------------------------------------------------------------------------------------------------------------------------------------------------
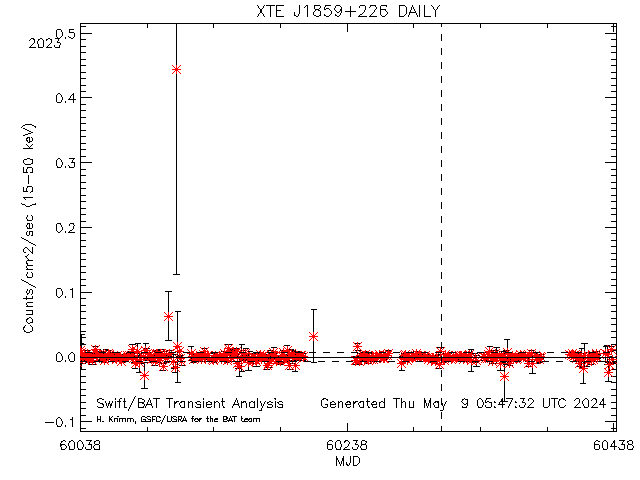
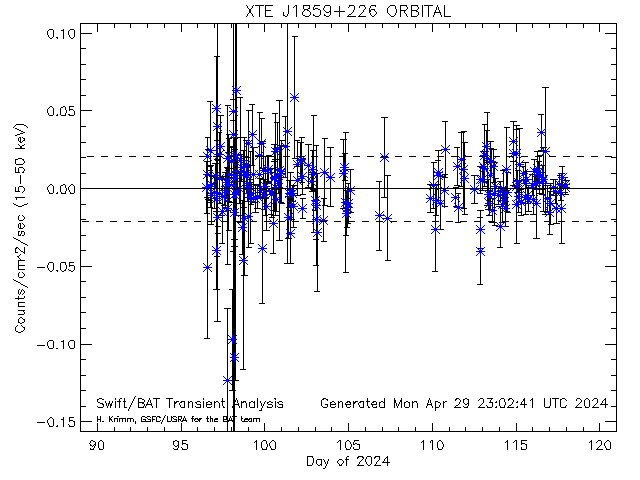
Dashed lines show average rate (and +/- 1 sigma standard deviation) for this source (derived from this plot)
[33639] XTE J1859+226 RA= 284.673 degs; Dec= 22.6580 degs
Daily light curves: FITS version ASCII version
Orbit light curves: FITS version ASCII version
Full mission light curve
-------------------------------------------------------------------------------------------------------------------------------------------------------------------
Dashed lines show average rate (and +/- 1 sigma standard deviation) for this source (derived from this plot)
[10567] XTE J1901+014 RA= 285.421 degs; Dec= 1.43800 degs
Daily light curves: FITS version ASCII version
Orbit light curves: FITS version ASCII version
Full mission light curve
-------------------------------------------------------------------------------------------------------------------------------------------------------------------
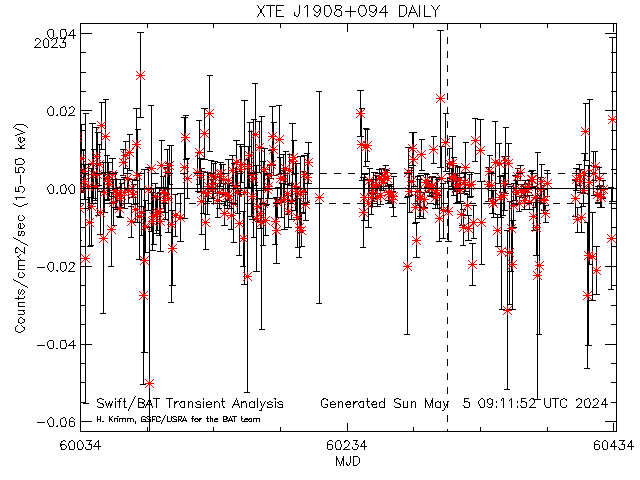
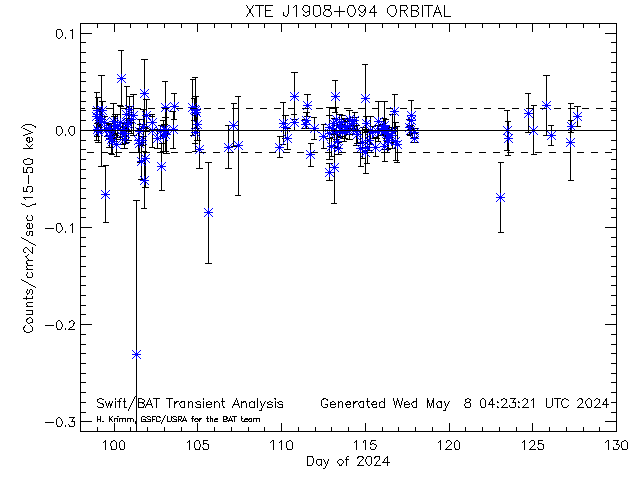
Dashed lines show average rate (and +/- 1 sigma standard deviation) for this source (derived from this plot)
[33869] XTE J1908+094 RA= 287.221 degs; Dec= 9.38500 degs
Daily light curves: FITS version ASCII version
Orbit light curves: FITS version ASCII version
Full mission light curve
-------------------------------------------------------------------------------------------------------------------------------------------------------------------
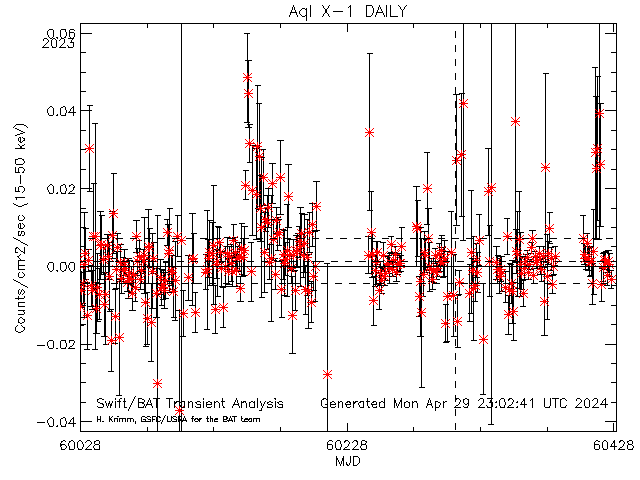
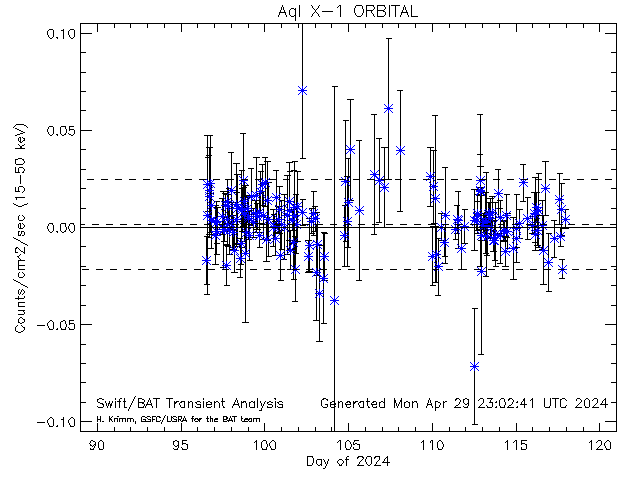
Dashed lines show average rate (and +/- 1 sigma standard deviation) for this source (derived from this plot)
[10031] Aql X-1 RA= 287.817 degs; Dec= 0.585000 degs
Daily light curves: FITS version ASCII version
Orbit light curves: FITS version ASCII version
Full mission light curve
-------------------------------------------------------------------------------------------------------------------------------------------------------------------
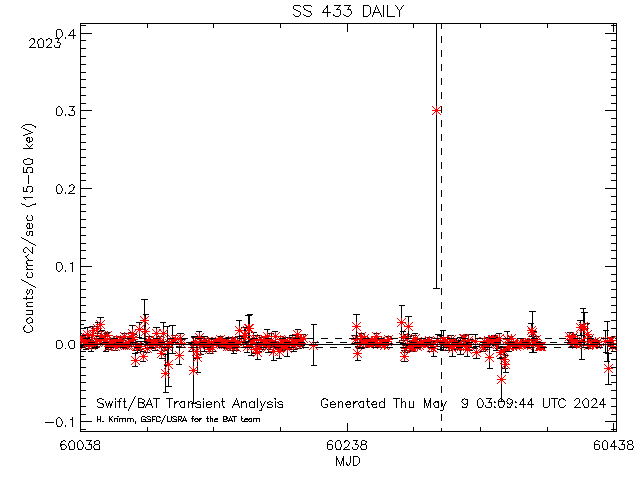
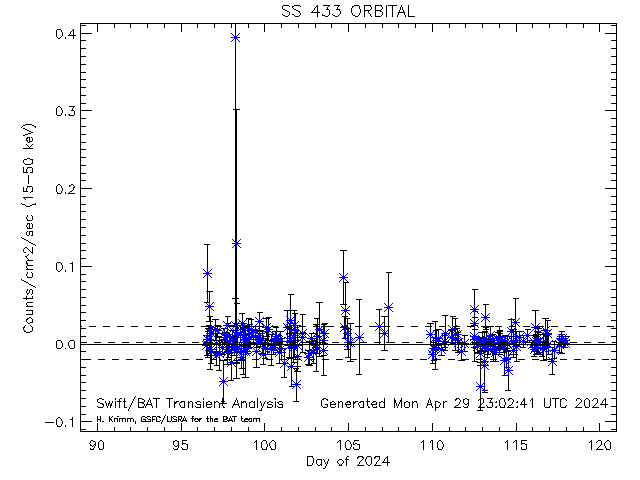
Dashed lines show average rate (and +/- 1 sigma standard deviation) for this source (derived from this plot)
[10569] SS 433 RA= 287.956 degs; Dec= 4.98300 degs
Daily light curves: FITS version ASCII version
Orbit light curves: FITS version ASCII version
Full mission light curve
-------------------------------------------------------------------------------------------------------------------------------------------------------------------
Dashed lines show average rate (and +/- 1 sigma standard deviation) for this source (derived from this plot)
[10007] GRS 1915+105 RA= 288.798 degs; Dec= 10.9460 degs
Daily light curves: FITS version ASCII version
Orbit light curves: FITS version ASCII version
Full mission light curve
-------------------------------------------------------------------------------------------------------------------------------------------------------------------
Dashed lines show average rate (and +/- 1 sigma standard deviation) for this source (derived from this plot)
[33593] SWIFTJ195509.6+261406 RA= 298.790 degs; Dec= 26.2352 degs
Daily light curves: FITS version ASCII version
Orbit light curves: FITS version ASCII version
Full mission light curve
-------------------------------------------------------------------------------------------------------------------------------------------------------------------
Dashed lines show average rate (and +/- 1 sigma standard deviation) for this source (derived from this plot)
[10002] Cyg X-1 RA= 299.591 degs; Dec= 35.2020 degs
Daily light curves: FITS version ASCII version
Orbit light curves: FITS version ASCII version
Full mission light curve
-------------------------------------------------------------------------------------------------------------------------------------------------------------------
Dashed lines show average rate (and +/- 1 sigma standard deviation) for this source (derived from this plot)
[33875] 4U 1957+115 RA= 299.851 degs; Dec= 11.7090 degs
Daily light curves: FITS version ASCII version
Orbit light curves: FITS version ASCII version
Full mission light curve
-------------------------------------------------------------------------------------------------------------------------------------------------------------------
JACPOT name: GS 2000+251
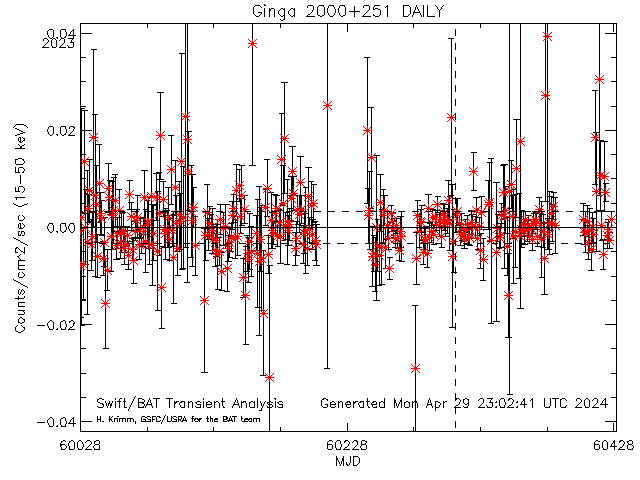
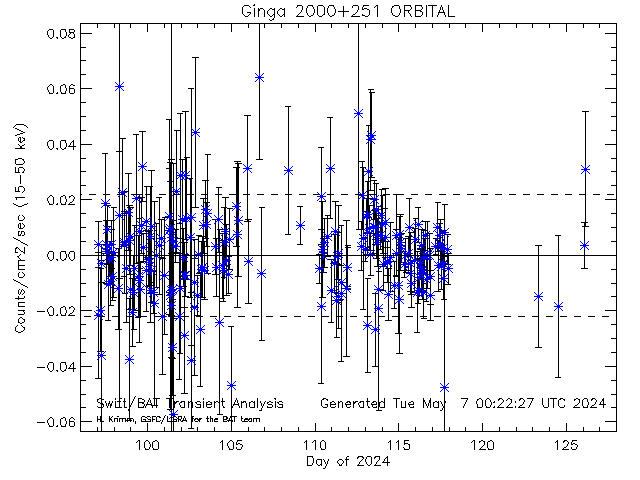
Dashed lines show average rate (and +/- 1 sigma standard deviation) for this source (derived from this plot)
JACPOT name: GS 2000+251 [33867] Ginga 2000+251 RA= 300.707 degs; Dec= 25.2360 degs
Daily light curves: FITS version ASCII version
Orbit light curves: FITS version ASCII version
Full mission light curve
-------------------------------------------------------------------------------------------------------------------------------------------------------------------
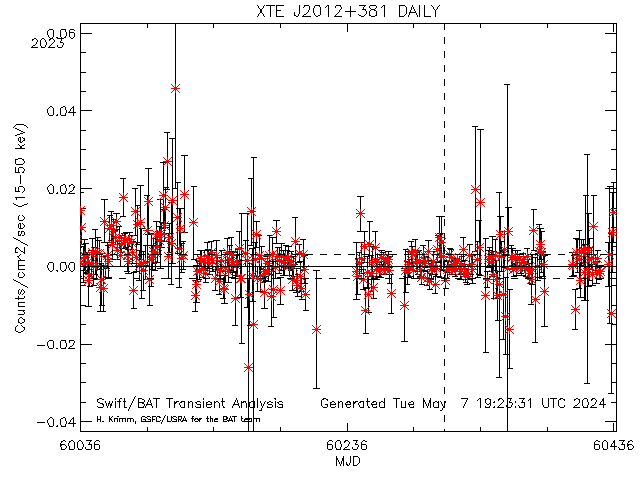
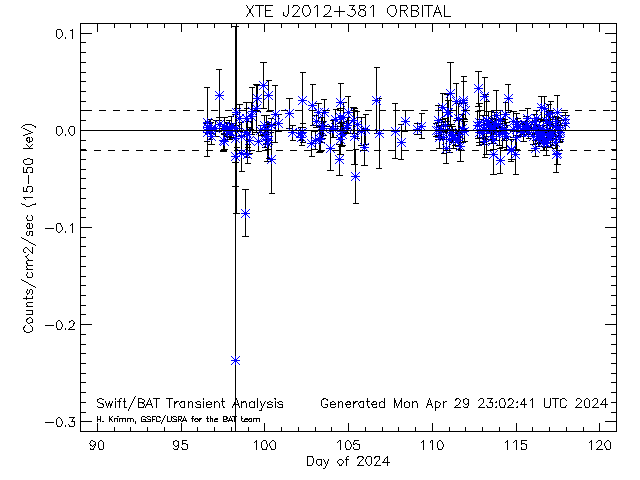
Dashed lines show average rate (and +/- 1 sigma standard deviation) for this source (derived from this plot)
[33874] XTE J2012+381 RA= 303.158 degs; Dec= 38.1840 degs
Daily light curves: FITS version ASCII version
Orbit light curves: FITS version ASCII version
Full mission light curve
-------------------------------------------------------------------------------------------------------------------------------------------------------------------
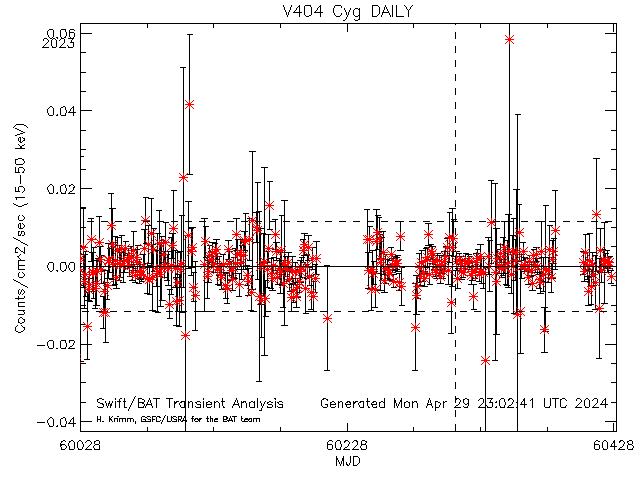
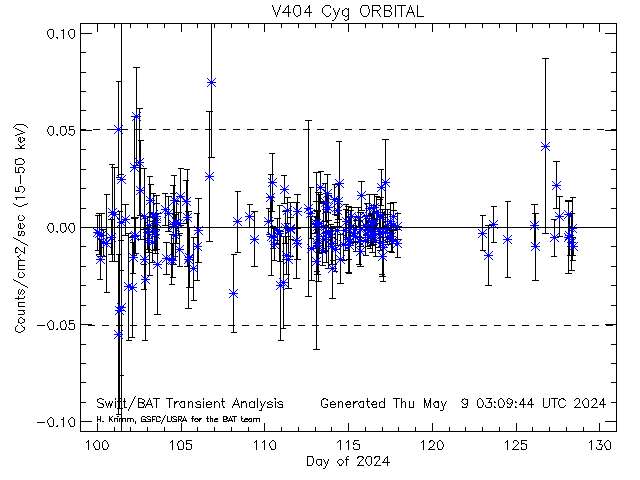
Dashed lines show average rate (and +/- 1 sigma standard deviation) for this source (derived from this plot)
[33671] V404 Cyg RA= 306.016 degs; Dec= 33.8680 degs
Daily light curves: FITS version ASCII version
Orbit light curves: FITS version ASCII version
Full mission light curve
-------------------------------------------------------------------------------------------------------------------------------------------------------------------
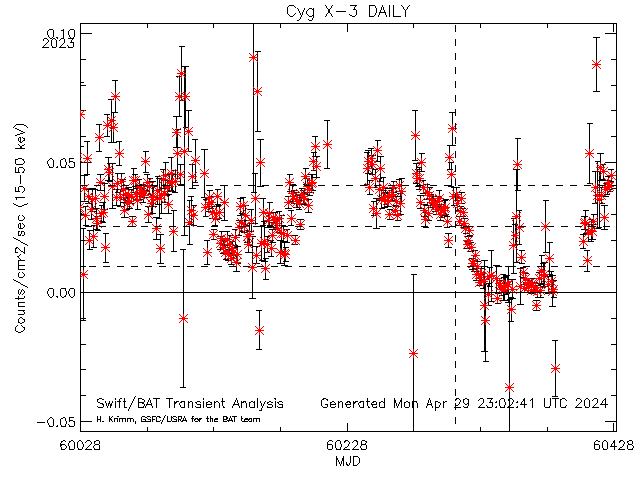
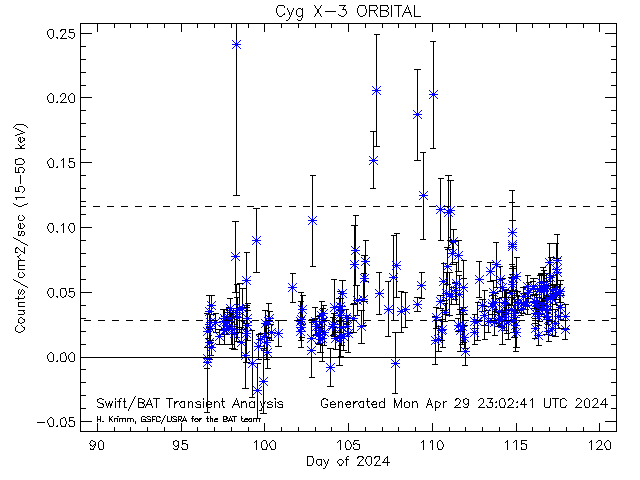
Dashed lines show average rate (and +/- 1 sigma standard deviation) for this source (derived from this plot)
[10038] Cyg X-3 RA= 308.107 degs; Dec= 40.9580 degs
Daily light curves: FITS version ASCII version
Orbit light curves: FITS version ASCII version
Full mission light curve
-------------------------------------------------------------------------------------------------------------------------------------------------------------------
JACPOT name: SS Cyg
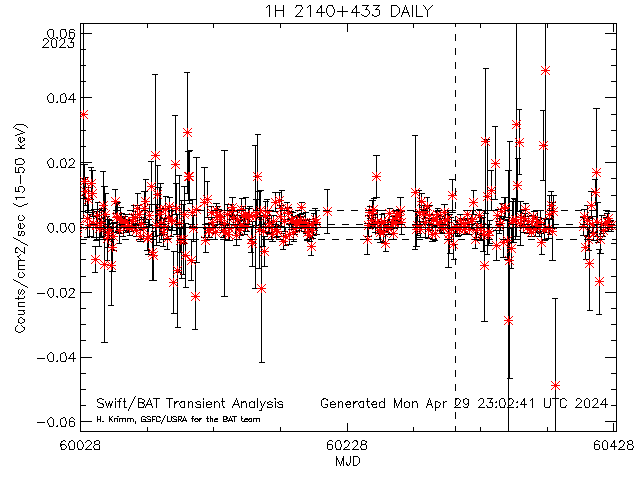
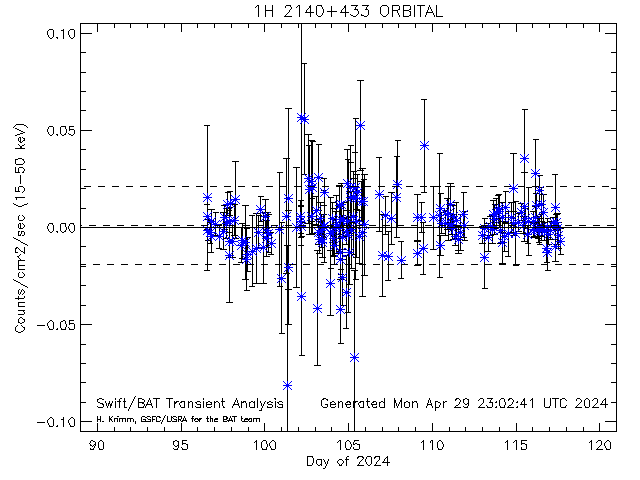
Dashed lines show average rate (and +/- 1 sigma standard deviation) for this source (derived from this plot)
JACPOT name: SS Cyg [10574] 1H 2140+433 RA= 325.678 degs; Dec= 43.5860 degs
Daily light curves: FITS version ASCII version
Orbit light curves: FITS version ASCII version
Full mission light curve
This page was last modified on Mon Mar 16 00:04:26 UTC 2026
The BAT Transient Monitor contacts are:
Tyler Parsotan,
tyler.parsotan@nasa.gov,
Amy Lien,
amy.y.lien@nasa.gov,
301.286.3624

- Curator: J.D. Myers
- NASA Official & Swift PI: Brad Cenko
- PAO Contact: Francis Reddy
- Questions/Comments/Feedback
- › Privacy Policy and Important Notices
- › Accessibility
- › Contact NASA
- › Page Last Updated: Sun, Mar 15, 2026