Swift/BAT sources with interesting possible outbursts
Please Read Before Using These Results:README
Main page
|
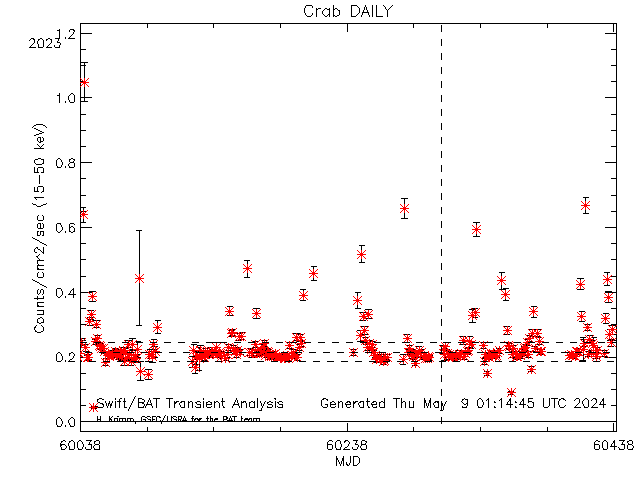
 Dashed lines show average rate (and +/- 1 sigma standard deviation) for this source (derived from this plot)
Daily light curves: FITS version ASCII version Orbit light curves: FITS version ASCII version
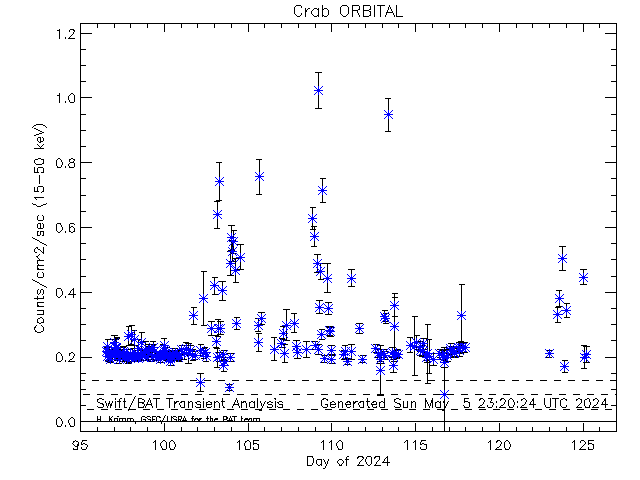
Dashed lines show average rate (and +/- 1 sigma standard deviation) for this source (derived from this plot)
Daily light curves: FITS version ASCII version Orbit light curves: FITS version ASCII version
FLAG (EXPOSURE)--Crab
Crab [10001] RA= 83.6330 degs; Dec= 22.0150
mean: 0.082255 sdev: 0.041070 thresh: 0.205466 max: 1.235405
--SCALED MAP--(8.00000/10.0000)=(80.0000)--3-SIGMA=(0.13)--------------------------
Possible outbursts for Crab
| |
Count |
UTC Date |
Duration |
Rate |
Error |
Factor |
SNR |
mCrab |
Pcodefr |
MET |
| EXPOSURE |
0 |
2023:299:21:44:40 |
128.00000 |
0.58212731 |
0.049607228 |
2.8332034 |
11.734728 |
2553.1899 |
0.29278564 |
720049480 |
| EXPOSURE |
1 |
2023:299:21:44:40 |
328.00000 |
0.24558075 |
0.014011608 |
1.1952372 |
17.526949 |
1077.1085 |
0.77338630 |
720049480 |
| EXPOSURE |
2 |
2023:299:21:44:40 |
456.00000 |
0.24967773 |
0.013919462 |
1.2151771 |
17.937312 |
1095.0778 |
0.77338630 |
720049480 |
| EXPOSURE |
3 |
2023:299:21:46:48 |
64.000000 |
0.56349502 |
0.065284893 |
2.7425204 |
8.6313233 |
2471.4693 |
0.29278564 |
720049608 |
| EXPOSURE |
4 |
2023:299:21:47:52 |
72.000000 |
0.25169580 |
0.017725794 |
1.2249990 |
14.199409 |
1103.9289 |
0.77338630 |
720049672 |
| EXPOSURE |
5 |
2023:299:21:49: 4 |
64.000000 |
0.25724149 |
0.017253413 |
1.2519898 |
14.909600 |
1128.2521 |
0.77338630 |
720049744 |
| EXPOSURE |
6 |
2023:299:21:50: 8 |
64.000000 |
0.25612287 |
0.017465799 |
1.2465455 |
14.664251 |
1123.3459 |
0.77338630 |
720049808 |
| EXPOSURE |
7 |
2023:299:21:51:12 |
64.000000 |
0.25381082 |
0.017668804 |
1.2352928 |
14.364912 |
1113.2053 |
0.77338630 |
720049872 |
FLAG (POINTING)--Crab
Crab [10001] RA= 83.6330 degs; Dec= 22.0150
mean: 0.082255 sdev: 0.041070 thresh: 0.205466 max: 1.235405
--SCALED MAP--(1.00000/2.00000)=(50.0000)--3-SIGMA=(0.13)--------------------------
Possible outbursts for Crab
| |
Count |
UTC Date |
Duration |
Rate |
Error |
Factor |
SNR |
mCrab |
Pcodefr |
MET |
| POINTING |
0 |
2023:299:21:44:40 |
456.00000 |
0.24967773 |
0.013919462 |
1.2151771 |
17.937312 |
1095.0778 |
0.29278564 |
720049480 |
|
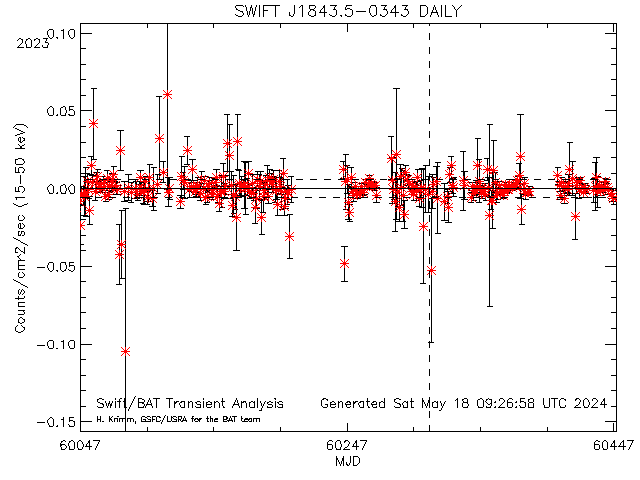
 Dashed lines show average rate (and +/- 1 sigma standard deviation) for this source (derived from this plot)
Daily light curves: FITS version ASCII version Orbit light curves: FITS version ASCII version
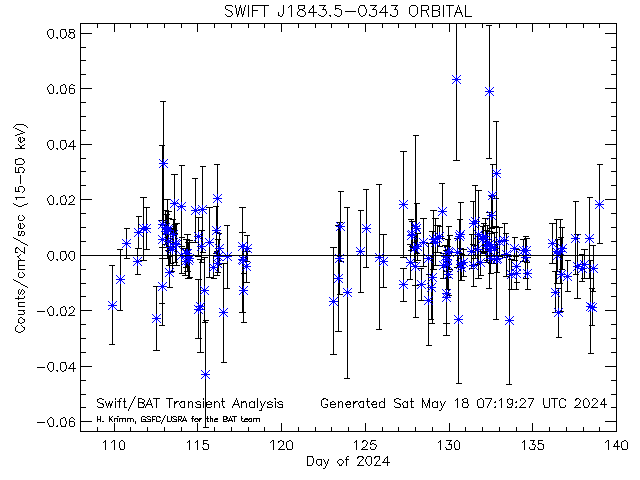
Dashed lines show average rate (and +/- 1 sigma standard deviation) for this source (derived from this plot)
Daily light curves: FITS version ASCII version Orbit light curves: FITS version ASCII version
FLAG (DAILY)--SWIFTJ1843.5-0343
SWIFT J1843.5-0343 [33989] RA= 280.895 degs; Dec= -3.71600
mean: 0.000040 sdev: 0.003990 thresh: 0.012011 max: 0.076358
--SCALED MAP--(1.00000/31.0000)=(0.703887)--3-SIGMA=(0.13)--------------------------
Possible outbursts for SWIFT J1843.5-0343
| |
Count |
UTC Date |
MJD |
Rate |
Error |
Factor |
SNR |
mCrab |
| DAILY |
0 |
2023:302 |
60246.000 |
0.029760980 |
0.0073969970 |
2.4777871 |
4.0233867 |
130.53061 |
|
 Dashed lines show average rate (and +/- 1 sigma standard deviation) for this source (derived from this plot)
Daily light curves: FITS version ASCII version Orbit light curves: FITS version ASCII version
Dashed lines show average rate (and +/- 1 sigma standard deviation) for this source (derived from this plot)
Daily light curves: FITS version ASCII version Orbit light curves: FITS version ASCII version
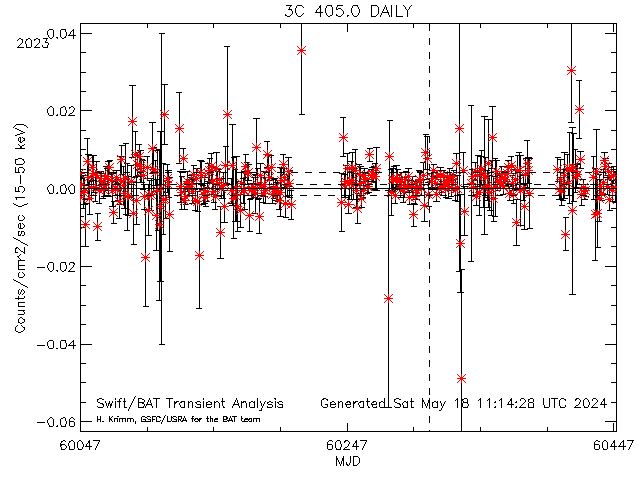
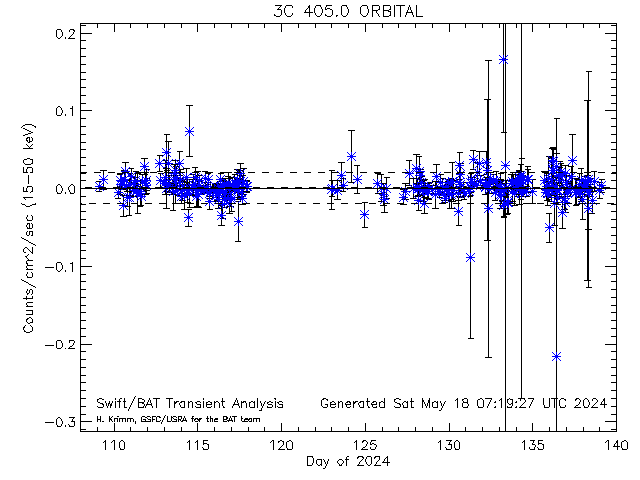
FLAG (DAILY)--3C405.0
3C 405.0 [20162] RA= 299.868 degs; Dec= 40.7339
mean: 0.001158 sdev: 0.002839 thresh: 0.009675 max: 0.048094
--SCALED MAP--(1.00000/31.0000)=(0.818898)--3-SIGMA=(0.13)--------------------------
Possible outbursts for 3C 405.0
| |
Count |
UTC Date |
MJD |
Rate |
Error |
Factor |
SNR |
mCrab |
| DAILY |
0 |
2023:302 |
60246.000 |
0.034399635 |
0.0082428162 |
3.5556160 |
4.1732866 |
150.87559 |
|
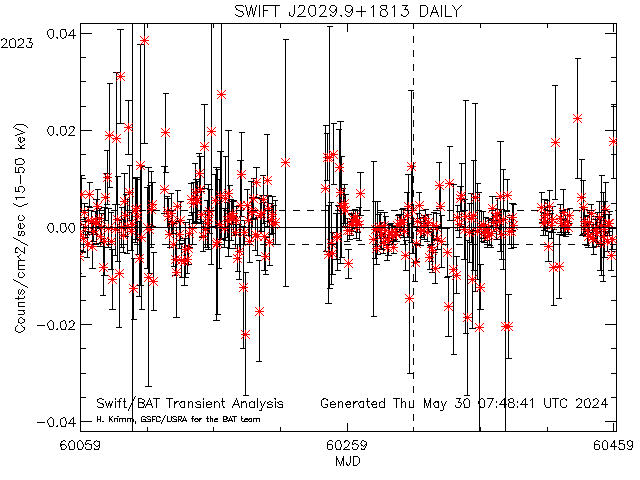
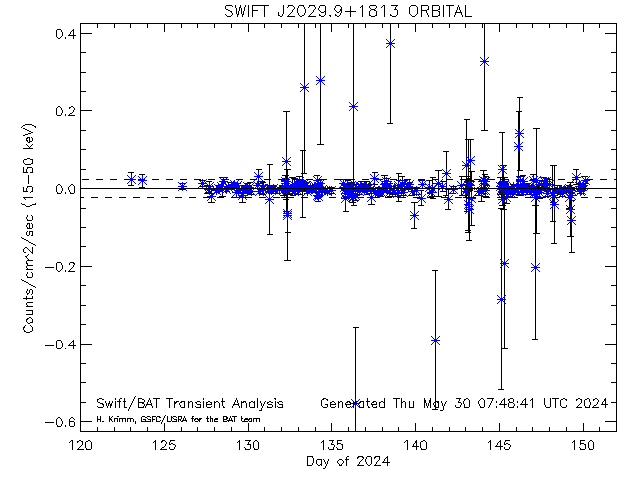 Dashed lines show average rate (and +/- 1 sigma standard deviation) for this source (derived from this plot)
Daily light curves: FITS version ASCII version Orbit light curves: FITS version ASCII version
Dashed lines show average rate (and +/- 1 sigma standard deviation) for this source (derived from this plot)
Daily light curves: FITS version ASCII version Orbit light curves: FITS version ASCII version
FLAG (DAILY)--SWIFTJ2029.9+1813
SWIFT J2029.9+1813 [33858] RA= 307.479 degs; Dec= 18.2210
mean: 0.000059 sdev: 0.003429 thresh: 0.010347 max: 0.063709
--SCALED MAP--(1.00000/31.0000)=(0.926370)--3-SIGMA=(0.13)--------------------------
Possible outbursts for SWIFT J2029.9+1813
| |
Count |
UTC Date |
MJD |
Rate |
Error |
Factor |
SNR |
mCrab |
| DAILY |
0 |
2023:302 |
60246.000 |
0.024866788 |
0.0060775174 |
2.4033244 |
4.0916029 |
109.06486 |
This page was last modified on Fri Oct 27 02:55:48 UTC 2023