Swift/BAT sources with interesting possible outbursts
Please Read Before Using These Results:README
Main page
|
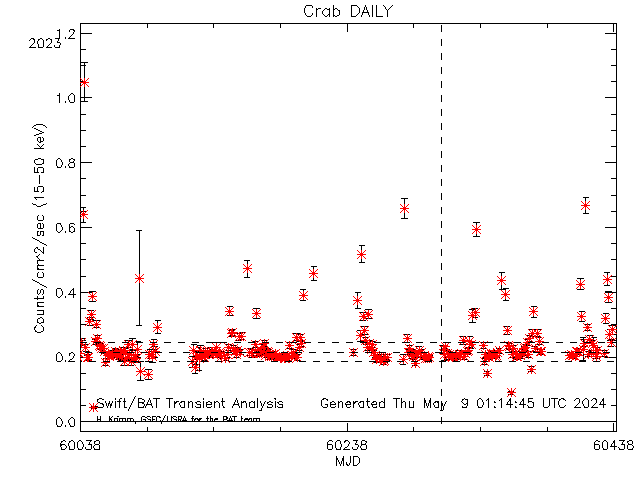
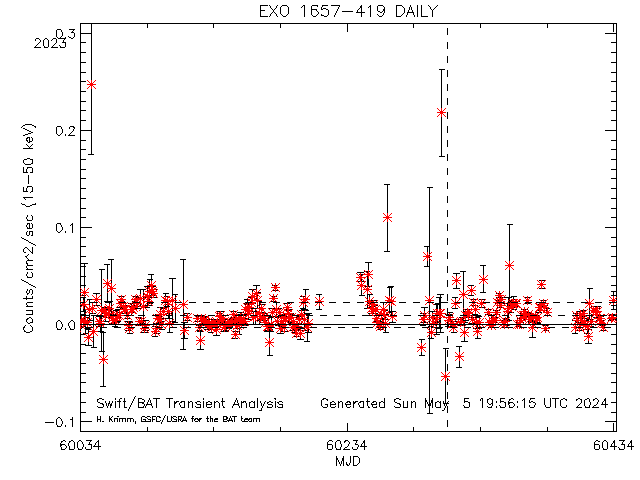
 Dashed lines show average rate (and +/- 1 sigma standard deviation) for this source (derived from this plot)
Daily light curves: FITS version ASCII version Orbit light curves: FITS version ASCII version
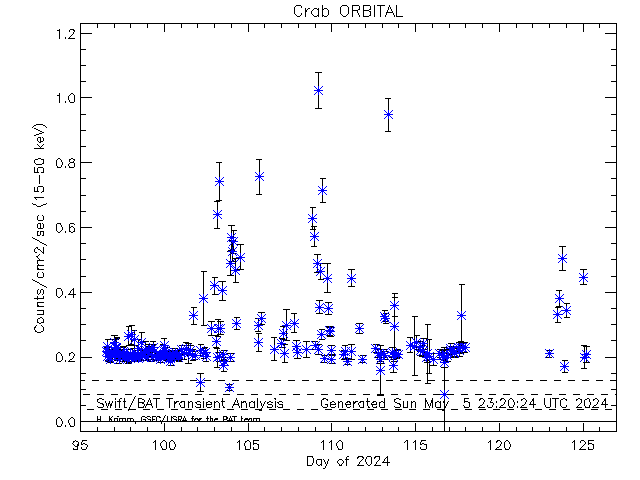
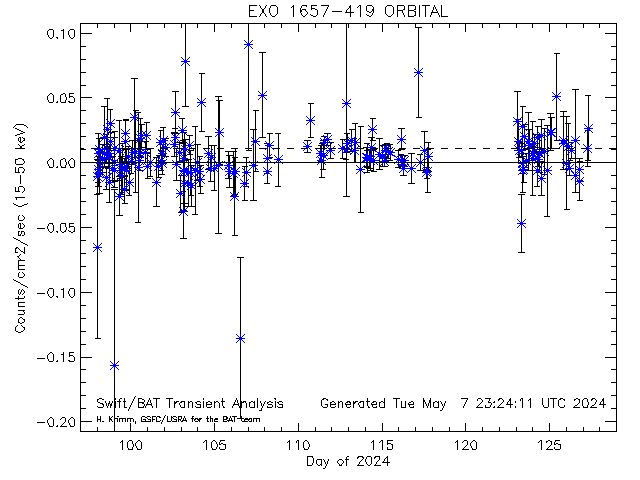
Dashed lines show average rate (and +/- 1 sigma standard deviation) for this source (derived from this plot)
Daily light curves: FITS version ASCII version Orbit light curves: FITS version ASCII version
FLAG (EXPOSURE)--Crab
Crab [10001] RA= 83.6330 degs; Dec= 22.0150
mean: 0.082257 sdev: 0.041070 thresh: 0.205467 max: 1.235405
--SCALED MAP--(8.00000/10.0000)=(80.0000)--3-SIGMA=(0.13)--------------------------
Possible outbursts for Crab
| |
Count |
UTC Date |
Duration |
Rate |
Error |
Factor |
SNR |
mCrab |
Pcodefr |
MET |
| EXPOSURE |
0 |
2023:299:21:44:40 |
128.00000 |
0.58212731 |
0.049607228 |
2.8331858 |
11.734728 |
2553.1899 |
0.29278564 |
720049480 |
| EXPOSURE |
1 |
2023:299:21:44:40 |
328.00000 |
0.24558075 |
0.014011608 |
1.1952298 |
17.526949 |
1077.1085 |
0.77338630 |
720049480 |
| EXPOSURE |
2 |
2023:299:21:44:40 |
456.00000 |
0.24967773 |
0.013919462 |
1.2151696 |
17.937312 |
1095.0778 |
0.77338630 |
720049480 |
| EXPOSURE |
3 |
2023:299:21:46:48 |
64.000000 |
0.56349502 |
0.065284893 |
2.7425033 |
8.6313233 |
2471.4693 |
0.29278564 |
720049608 |
| EXPOSURE |
4 |
2023:299:21:47:52 |
72.000000 |
0.25169580 |
0.017725794 |
1.2249914 |
14.199409 |
1103.9289 |
0.77338630 |
720049672 |
| EXPOSURE |
5 |
2023:299:21:49: 4 |
64.000000 |
0.25724149 |
0.017253413 |
1.2519820 |
14.909600 |
1128.2521 |
0.77338630 |
720049744 |
| EXPOSURE |
6 |
2023:299:21:50: 8 |
64.000000 |
0.25612287 |
0.017465799 |
1.2465377 |
14.664251 |
1123.3459 |
0.77338630 |
720049808 |
| EXPOSURE |
7 |
2023:299:21:51:12 |
64.000000 |
0.25381082 |
0.017668804 |
1.2352851 |
14.364912 |
1113.2053 |
0.77338630 |
720049872 |
FLAG (POINTING)--Crab
Crab [10001] RA= 83.6330 degs; Dec= 22.0150
mean: 0.082257 sdev: 0.041070 thresh: 0.205467 max: 1.235405
--SCALED MAP--(1.00000/2.00000)=(50.0000)--3-SIGMA=(0.13)--------------------------
Possible outbursts for Crab
| |
Count |
UTC Date |
Duration |
Rate |
Error |
Factor |
SNR |
mCrab |
Pcodefr |
MET |
| POINTING |
0 |
2023:299:21:44:40 |
456.00000 |
0.24967773 |
0.013919462 |
1.2151696 |
17.937312 |
1095.0778 |
0.29278564 |
720049480 |
|
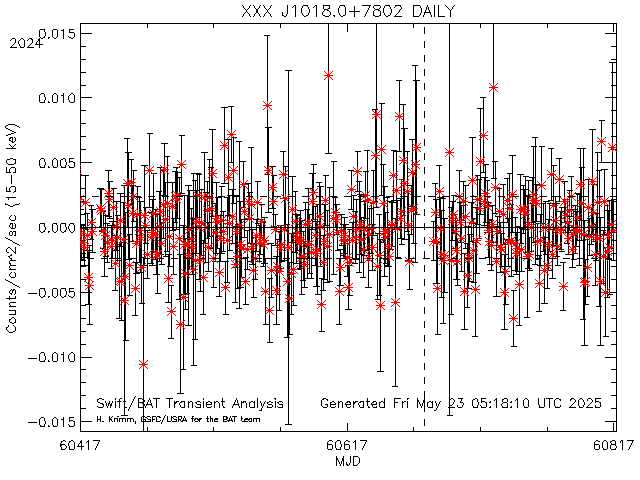
 Dashed lines show average rate (and +/- 1 sigma standard deviation) for this source (derived from this plot)
Daily light curves: FITS version ASCII version Orbit light curves: FITS version ASCII version
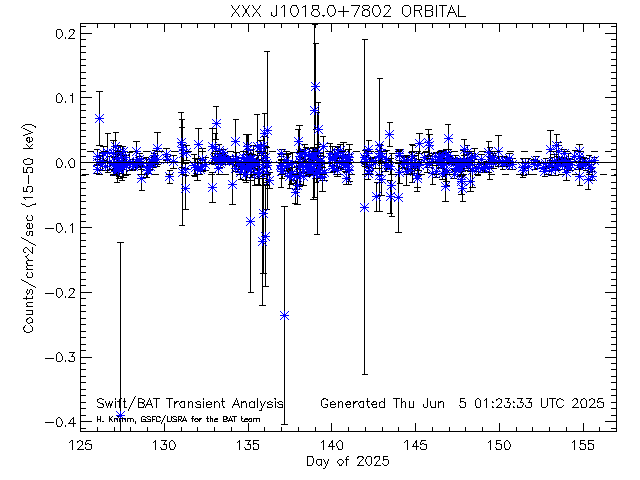
Dashed lines show average rate (and +/- 1 sigma standard deviation) for this source (derived from this plot)
Daily light curves: FITS version ASCII version Orbit light curves: FITS version ASCII version
FLAG (POINTING)--XXXJ1018.0+7802
XXX J1018.0+7802 [30050] RA= 154.489 degs; Dec= 78.0444
mean:-0.000002 sdev: 0.017349 thresh: 0.025784 max: 0.025784
--SCALED MAP--(1.00000/19.0000)=(5.26316)--3-SIGMA=(0.13)--------------------------
Possible outbursts for XXX J1018.0+7802
| |
Count |
UTC Date |
Duration |
Rate |
Error |
Factor |
SNR |
mCrab |
Pcodefr |
MET |
| POINTING |
0 |
2023:300:13:56: 0 |
240.00000 |
0.060403087 |
0.012489247 |
2.3426724 |
4.8364075 |
264.92581 |
0.25000000 |
720107760 |
|
 Dashed lines show average rate (and +/- 1 sigma standard deviation) for this source (derived from this plot)
Daily light curves: FITS version ASCII version Orbit light curves: FITS version ASCII version
Dashed lines show average rate (and +/- 1 sigma standard deviation) for this source (derived from this plot)
Daily light curves: FITS version ASCII version Orbit light curves: FITS version ASCII version
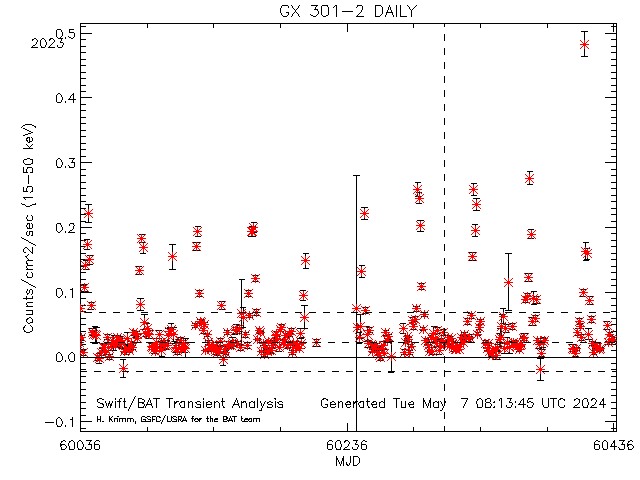
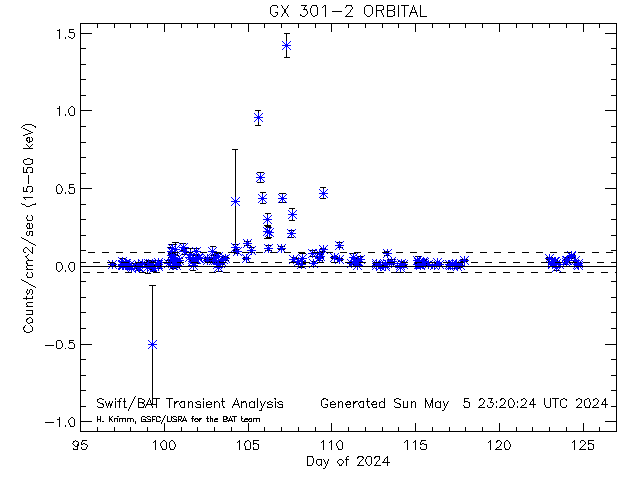
FLAG (EXPOSURE)--GX301-2
GX 301-2 [10051] RA= 186.657 degs; Dec= -62.7700
mean: 0.023916 sdev: 0.061627 thresh: 0.208798 max: 0.351578
--SCALED MAP--(2.00000/104.000)=(1.92308)--3-SIGMA=(0.13)--------------------------
Possible outbursts for GX 301-2
| |
Count |
UTC Date |
Duration |
Rate |
Error |
Factor |
SNR |
mCrab |
Pcodefr |
MET |
| EXPOSURE |
0 |
2023:300:17:38: 8 |
64.000000 |
0.26564483 |
0.070901356 |
1.2722589 |
3.7466820 |
1165.1089 |
0.11035156 |
720121088 |
| EXPOSURE |
1 |
2023:300:19:16:48 |
64.000000 |
0.21209338 |
0.016732765 |
1.0157837 |
12.675334 |
930.23410 |
0.92187500 |
720127008 |
|
 Dashed lines show average rate (and +/- 1 sigma standard deviation) for this source (derived from this plot)
Daily light curves: FITS version ASCII version Orbit light curves: FITS version ASCII version
Dashed lines show average rate (and +/- 1 sigma standard deviation) for this source (derived from this plot)
Daily light curves: FITS version ASCII version Orbit light curves: FITS version ASCII version
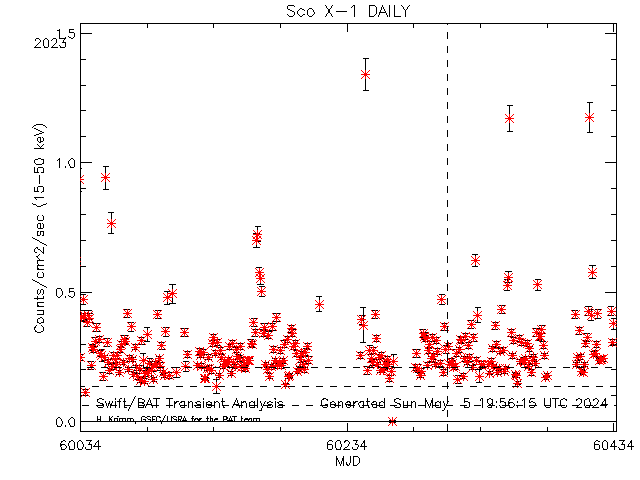
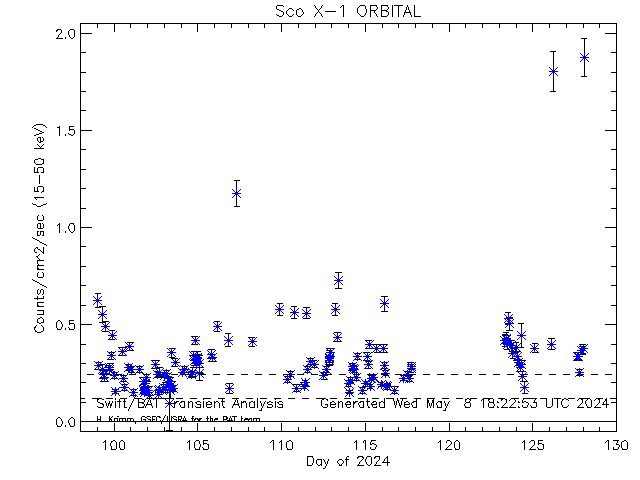
FLAG (EXPOSURE)--ScoX-1
Sco X-1 [10003] RA= 244.979 degs; Dec= -15.6400
mean: 0.121575 sdev: 0.117829 thresh: 0.475062 max: 1.102352
--SCALED MAP--(1.00000/50.0000)=(2.00000)--3-SIGMA=(0.13)--------------------------
Possible outbursts for Sco X-1
| |
Count |
UTC Date |
Duration |
Rate |
Error |
Factor |
SNR |
mCrab |
Pcodefr |
MET |
| EXPOSURE |
0 |
2023:300: 1:27:28 |
1392.0000 |
0.51070777 |
0.028060066 |
1.0750335 |
18.200519 |
2239.9463 |
0.37237331 |
720062848 |
FLAG (POINTING)--ScoX-1
Sco X-1 [10003] RA= 244.979 degs; Dec= -15.6400
mean: 0.121575 sdev: 0.117829 thresh: 0.475062 max: 1.102352
--SCALED MAP--(1.00000/7.00000)=(14.2857)--3-SIGMA=(0.13)--------------------------
Possible outbursts for Sco X-1
| |
Count |
UTC Date |
Duration |
Rate |
Error |
Factor |
SNR |
mCrab |
Pcodefr |
MET |
| POINTING |
0 |
2023:300: 1:27:28 |
1392.0000 |
0.51070777 |
0.028060066 |
1.0750335 |
18.200519 |
2239.9463 |
0.37237331 |
720062848 |
|
 Dashed lines show average rate (and +/- 1 sigma standard deviation) for this source (derived from this plot)
Daily light curves: FITS version ASCII version Orbit light curves: FITS version ASCII version
Dashed lines show average rate (and +/- 1 sigma standard deviation) for this source (derived from this plot)
Daily light curves: FITS version ASCII version Orbit light curves: FITS version ASCII version
FLAG (DAILY)--EXO1657-419
EXO 1657-419 [20002] RA= 255.200 degs; Dec= -41.6731
mean: 0.009807 sdev: 0.012804 thresh: 0.048221 max: 0.247356
--SCALED MAP--(1.00000/31.0000)=(1.32787)--3-SIGMA=(0.13)--------------------------
Possible outbursts for EXO 1657-419
| |
Count |
UTC Date |
MJD |
Rate |
Error |
Factor |
SNR |
mCrab |
| DAILY |
0 |
2023:302 |
60246.000 |
0.049002388 |
0.0048912264 |
1.0162139 |
10.018426 |
214.92275 |
|
 Dashed lines show average rate (and +/- 1 sigma standard deviation) for this source (derived from this plot)
Daily light curves: FITS version ASCII version Orbit light curves: FITS version ASCII version
Dashed lines show average rate (and +/- 1 sigma standard deviation) for this source (derived from this plot)
Daily light curves: FITS version ASCII version Orbit light curves: FITS version ASCII version
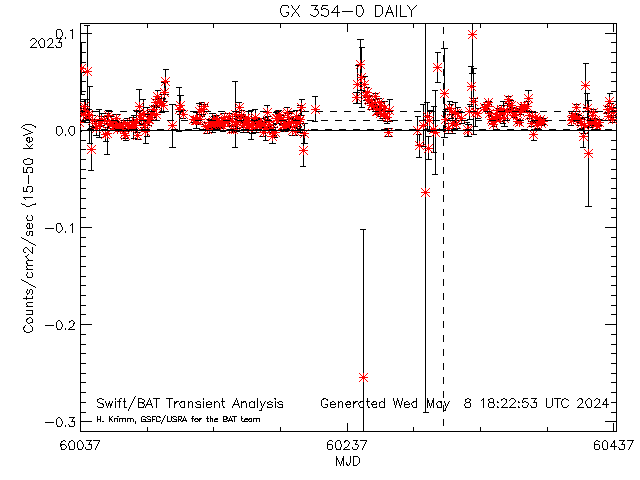
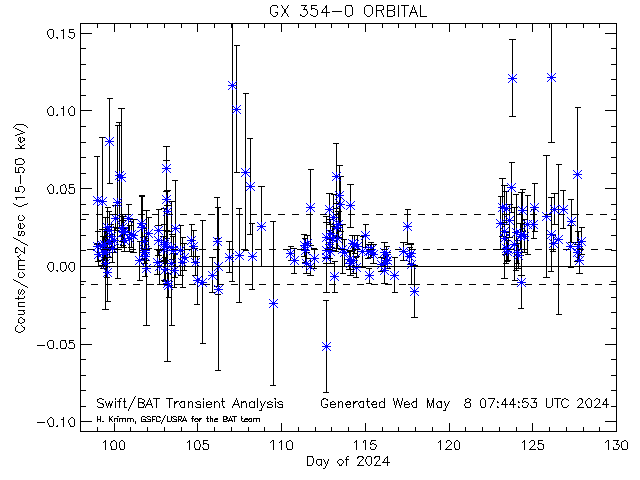
FLAG (EXPOSURE)--GX354-0
GX 354-0 [10056] RA= 262.988 degs; Dec= -33.8340
mean: 0.010861 sdev: 0.021919 thresh: 0.064090 max: 0.064090
--SCALED MAP--(2.00000/43.0000)=(4.65116)--3-SIGMA=(0.13)--------------------------
Possible outbursts for GX 354-0
| |
Count |
UTC Date |
Duration |
Rate |
Error |
Factor |
SNR |
mCrab |
Pcodefr |
MET |
| EXPOSURE |
0 |
2023:300:11:10:48 |
344.00000 |
0.15253125 |
0.042285530 |
2.3799442 |
3.6071735 |
668.99668 |
0.19607861 |
720097848 |
| EXPOSURE |
1 |
2023:300:11:10:48 |
344.00000 |
0.15254833 |
0.041331700 |
2.3802108 |
3.6908312 |
669.07161 |
0.19607861 |
720097848 |
|
 Dashed lines show average rate (and +/- 1 sigma standard deviation) for this source (derived from this plot)
Daily light curves: FITS version ASCII version Orbit light curves: FITS version ASCII version
Dashed lines show average rate (and +/- 1 sigma standard deviation) for this source (derived from this plot)
Daily light curves: FITS version ASCII version Orbit light curves: FITS version ASCII version
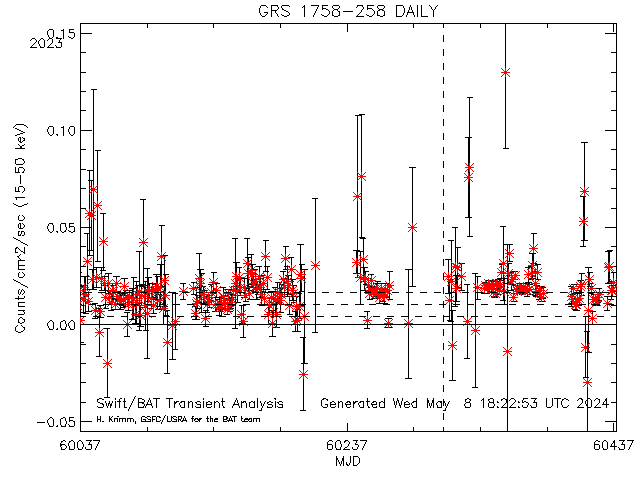
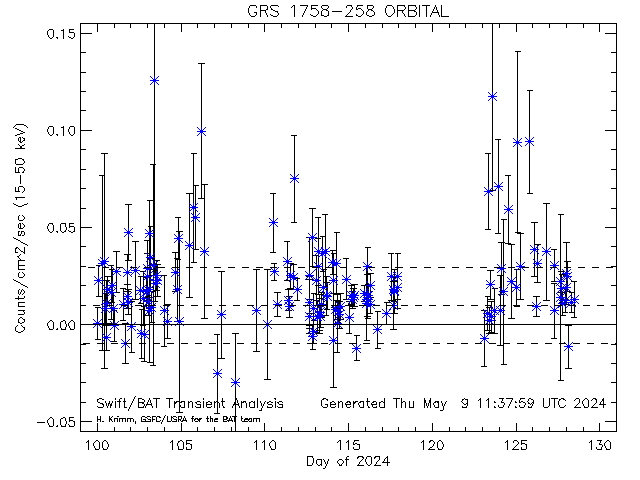
FLAG (DAILY)--GRS1758-258
GRS 1758-258 [10048] RA= 270.302 degs; Dec= -25.7430
mean: 0.010236 sdev: 0.005579 thresh: 0.026972 max: 0.069376
--SCALED MAP--(1.00000/31.0000)=(0.644505)--3-SIGMA=(0.13)--------------------------
Possible outbursts for GRS 1758-258
| |
Count |
UTC Date |
MJD |
Rate |
Error |
Factor |
SNR |
mCrab |
| DAILY |
0 |
2023:302 |
60246.000 |
0.032056565 |
0.0057345200 |
1.1885132 |
5.5901044 |
140.59897 |
|
 Dashed lines show average rate (and +/- 1 sigma standard deviation) for this source (derived from this plot)
Daily light curves: FITS version ASCII version Orbit light curves: FITS version ASCII version
Dashed lines show average rate (and +/- 1 sigma standard deviation) for this source (derived from this plot)
Daily light curves: FITS version ASCII version Orbit light curves: FITS version ASCII version
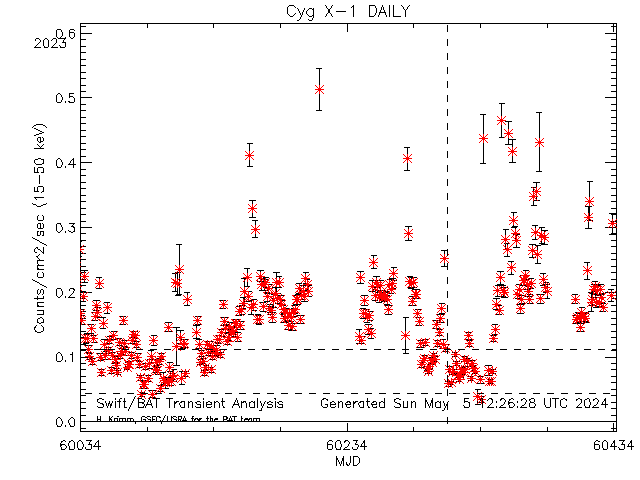
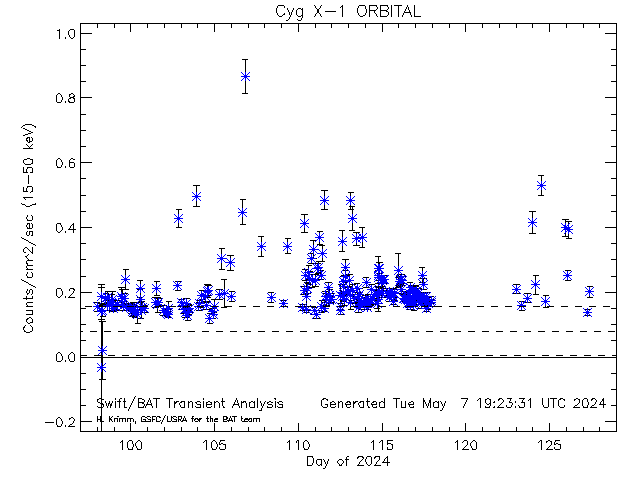
FLAG (EXPOSURE)--CygX-1
Cyg X-1 [10002] RA= 299.591 degs; Dec= 35.2020
mean: 0.078799 sdev: 0.073105 thresh: 0.298114 max: 0.512687
--SCALED MAP--(25.0000/186.000)=(13.4409)--3-SIGMA=(0.13)--------------------------
Supressing another 15.0000 points, out of a total of 25.0000
Possible outbursts for Cyg X-1
| |
Count |
UTC Date |
Duration |
Rate |
Error |
Factor |
SNR |
mCrab |
Pcodefr |
MET |
| EXPOSURE |
0 |
2023:300: 3:23:20 |
64.000000 |
0.47810528 |
0.034500492 |
1.6037663 |
13.857926 |
2096.9529 |
0.40290114 |
720069800 |
| EXPOSURE |
1 |
2023:300: 3:24:24 |
64.000000 |
0.46837649 |
0.033824238 |
1.5711319 |
13.847363 |
2054.2828 |
0.40290114 |
720069864 |
| EXPOSURE |
2 |
2023:300: 3:25:28 |
64.000000 |
0.45405631 |
0.033355443 |
1.5230959 |
13.612660 |
1991.4750 |
0.40290114 |
720069928 |
| EXPOSURE |
3 |
2023:300: 7:33:20 |
64.000000 |
0.30393602 |
0.037825521 |
1.0195293 |
8.0352105 |
1333.0527 |
0.14062500 |
720084800 |
| EXPOSURE |
4 |
2023:300:20:15:12 |
1000.0000 |
0.44029633 |
0.036210697 |
1.4769392 |
12.159289 |
1931.1242 |
0.11293374 |
720130512 |
| EXPOSURE |
5 |
2023:300:20:21: 4 |
392.00000 |
0.43311897 |
0.039416594 |
1.4528633 |
10.988240 |
1899.6446 |
0.11293374 |
720130864 |
| EXPOSURE |
6 |
2023:300:20:25:44 |
112.00000 |
0.35495335 |
0.045641853 |
1.1906629 |
7.7769268 |
1556.8129 |
0.11293374 |
720131144 |
| EXPOSURE |
7 |
2023:300:20:27:36 |
64.000000 |
0.46916369 |
0.061930672 |
1.5737724 |
7.5756272 |
2057.7354 |
0.11293374 |
720131256 |
| EXPOSURE |
8 |
2023:300:20:28:40 |
64.000000 |
0.41250181 |
0.061509784 |
1.3837046 |
6.7062795 |
1809.2184 |
0.11293374 |
720131320 |
| EXPOSURE |
9 |
2023:300:20:29:44 |
64.000000 |
0.49446729 |
0.064891368 |
1.6586514 |
7.6199239 |
2168.7161 |
0.11293374 |
720131384 |
| EXPOSURE |
10 |
2023:300:20:30:48 |
64.000000 |
0.41782236 |
0.064128945 |
1.4015520 |
6.5153475 |
1832.5542 |
0.11293374 |
720131448 |
FLAG (POINTING)--CygX-1
Cyg X-1 [10002] RA= 299.591 degs; Dec= 35.2020
mean: 0.078799 sdev: 0.073105 thresh: 0.298114 max: 0.512687
--SCALED MAP--(2.00000/18.0000)=(11.1111)--3-SIGMA=(0.13)--------------------------
Possible outbursts for Cyg X-1
| |
Count |
UTC Date |
Duration |
Rate |
Error |
Factor |
SNR |
mCrab |
Pcodefr |
MET |
| POINTING |
0 |
2023:300: 3:11:36 |
896.00000 |
0.46143167 |
0.025406473 |
1.5478360 |
18.161973 |
2023.8231 |
0.40290114 |
720069096 |
| POINTING |
1 |
2023:300:20:15:12 |
1000.0000 |
0.44029633 |
0.036210697 |
1.4769392 |
12.159289 |
1931.1242 |
0.26953125 |
720130512 |
|
 Dashed lines show average rate (and +/- 1 sigma standard deviation) for this source (derived from this plot)
Daily light curves: FITS version ASCII version Orbit light curves: FITS version ASCII version
Dashed lines show average rate (and +/- 1 sigma standard deviation) for this source (derived from this plot)
Daily light curves: FITS version ASCII version Orbit light curves: FITS version ASCII version
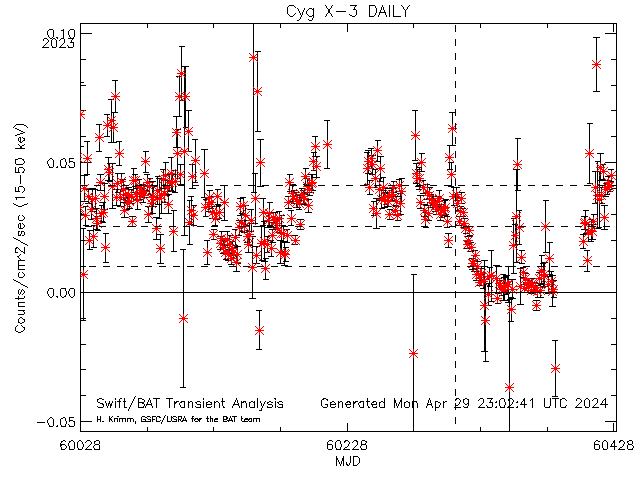
FLAG (EXPOSURE)--CygX-3
Cyg X-3 [10038] RA= 308.107 degs; Dec= 40.9580
mean: 0.027859 sdev: 0.089153 thresh: 0.091712 max: 0.091712
--SCALED MAP--(16.0000/178.000)=(8.98876)--3-SIGMA=(0.13)--------------------------
Supressing another 6.00000 points, out of a total of 16.0000
Possible outbursts for Cyg X-3
| |
Count |
UTC Date |
Duration |
Rate |
Error |
Factor |
SNR |
mCrab |
Pcodefr |
MET |
| EXPOSURE |
0 |
2023:300: 3:14:48 |
64.000000 |
0.12988258 |
0.026160406 |
1.4162074 |
4.9648533 |
569.66042 |
0.41525638 |
720069288 |
| EXPOSURE |
1 |
2023:300: 3:16:56 |
64.000000 |
0.12493772 |
0.026228240 |
1.3622899 |
4.7634810 |
547.97246 |
0.41525638 |
720069416 |
| EXPOSURE |
2 |
2023:300: 3:16:56 |
320.00000 |
0.12608557 |
0.016434718 |
1.3748058 |
7.6719037 |
553.00689 |
0.41525638 |
720069416 |
| EXPOSURE |
3 |
2023:300: 3:18: 0 |
64.000000 |
0.13617818 |
0.026651588 |
1.4848531 |
5.1095710 |
597.27271 |
0.41525638 |
720069480 |
| EXPOSURE |
4 |
2023:300: 3:19: 4 |
64.000000 |
0.14100456 |
0.026353641 |
1.5374787 |
5.3504772 |
618.44102 |
0.41525638 |
720069544 |
| EXPOSURE |
5 |
2023:300: 3:20: 8 |
64.000000 |
0.12018634 |
0.025038824 |
1.3104820 |
4.7999992 |
527.13305 |
0.41525638 |
720069608 |
| EXPOSURE |
6 |
2023:300: 3:21:12 |
64.000000 |
0.11396735 |
0.026770301 |
1.2426717 |
4.2572307 |
499.85678 |
0.41525638 |
720069672 |
| EXPOSURE |
7 |
2023:300: 3:22:16 |
64.000000 |
0.11080407 |
0.025466727 |
1.2081801 |
4.3509348 |
485.98275 |
0.41525638 |
720069736 |
| EXPOSURE |
8 |
2023:300: 3:23:20 |
64.000000 |
0.10380161 |
0.026818025 |
1.1318270 |
3.8705913 |
455.27022 |
0.41525638 |
720069800 |
| EXPOSURE |
9 |
2023:300: 3:24:24 |
64.000000 |
0.10140361 |
0.027099199 |
1.1056798 |
3.7419413 |
444.75269 |
0.41525638 |
720069864 |
| EXPOSURE |
10 |
2023:300: 3:25:28 |
64.000000 |
0.11419669 |
0.026190762 |
1.2451723 |
4.3601895 |
500.86265 |
0.41525638 |
720069928 |
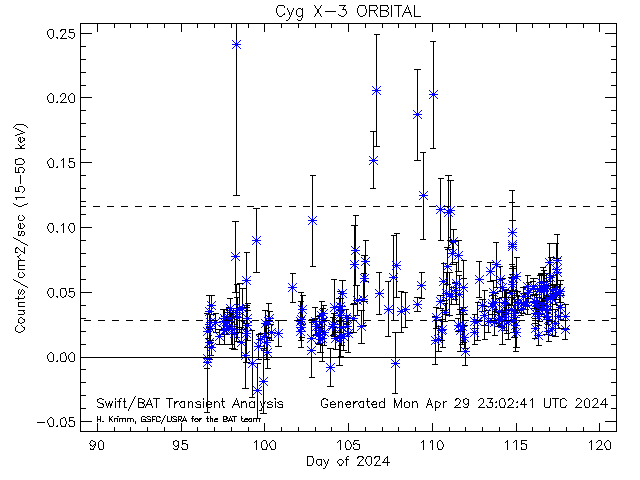
FLAG (POINTING)--CygX-3
Cyg X-3 [10038] RA= 308.107 degs; Dec= 40.9580
mean: 0.027859 sdev: 0.089153 thresh: 0.091712 max: 0.091712
--SCALED MAP--(1.00000/19.0000)=(5.26316)--3-SIGMA=(0.13)--------------------------
Possible outbursts for Cyg X-3
| |
Count |
UTC Date |
Duration |
Rate |
Error |
Factor |
SNR |
mCrab |
Pcodefr |
MET |
| POINTING |
0 |
2023:300: 3:11:36 |
896.00000 |
0.11923876 |
0.014939633 |
1.3001499 |
7.9813718 |
522.97701 |
0.41525638 |
720069096 |
This page was last modified on Sat Oct 28 22:02:37 UTC 2023