Swift/BAT sources with interesting possible outbursts
Please Read Before Using These Results:README
Main page
|
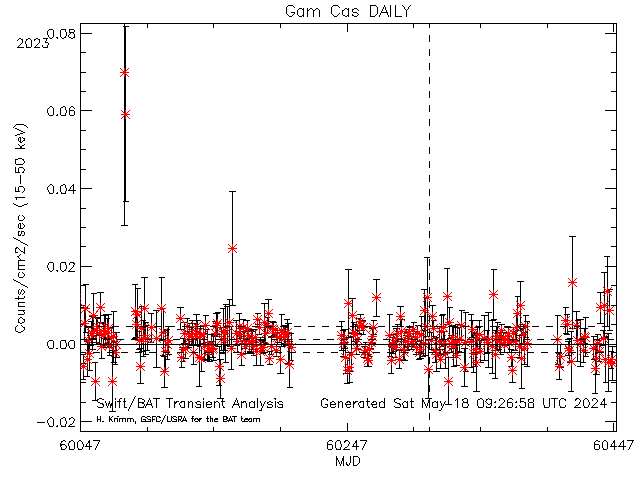
 Dashed lines show average rate (and +/- 1 sigma standard deviation) for this source (derived from this plot)
Daily light curves: FITS version ASCII version Orbit light curves: FITS version ASCII version
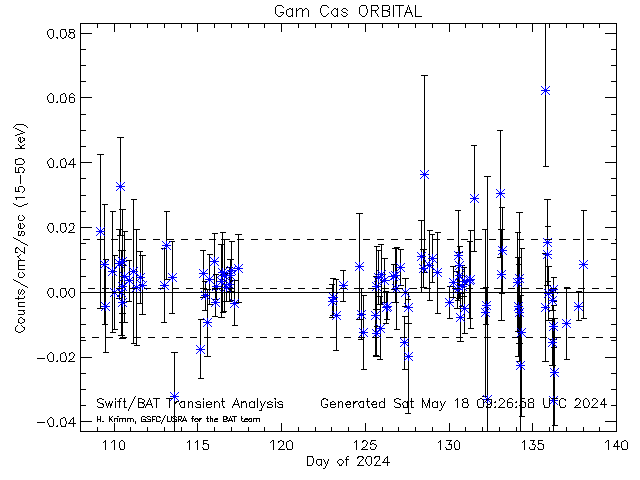
Dashed lines show average rate (and +/- 1 sigma standard deviation) for this source (derived from this plot)
Daily light curves: FITS version ASCII version Orbit light curves: FITS version ASCII version
FLAG (POINTING)--GamCas
Gam Cas [20068] RA= 14.1772 degs; Dec= 60.7167
mean: 0.001205 sdev: 0.016317 thresh: 0.050157 max: 0.069873
--SCALED MAP--(1.00000/53.0000)=(1.88679)--3-SIGMA=(0.13)--------------------------
Possible outbursts for Gam Cas
| |
Count |
UTC Date |
Duration |
Rate |
Error |
Factor |
SNR |
mCrab |
Pcodefr |
MET |
| POINTING |
0 |
0: 0: 0: 0: 0 |
128.00000 |
0.13777404 |
0.030069730 |
2.7468351 |
4.5818185 |
604.27210 |
0.15820312 |
788602552 |
|
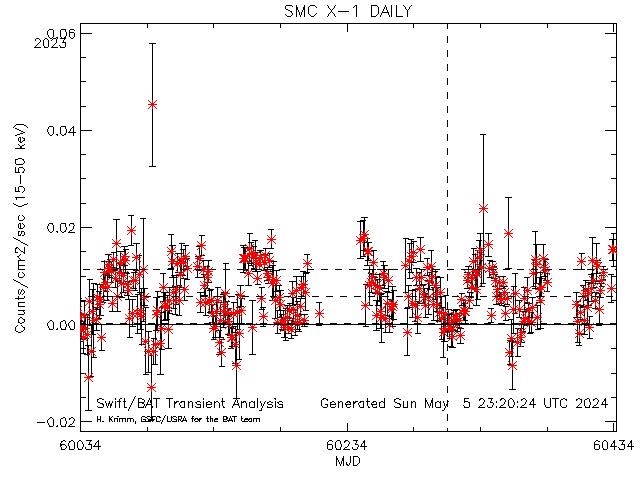
 Dashed lines show average rate (and +/- 1 sigma standard deviation) for this source (derived from this plot)
Daily light curves: FITS version ASCII version Orbit light curves: FITS version ASCII version
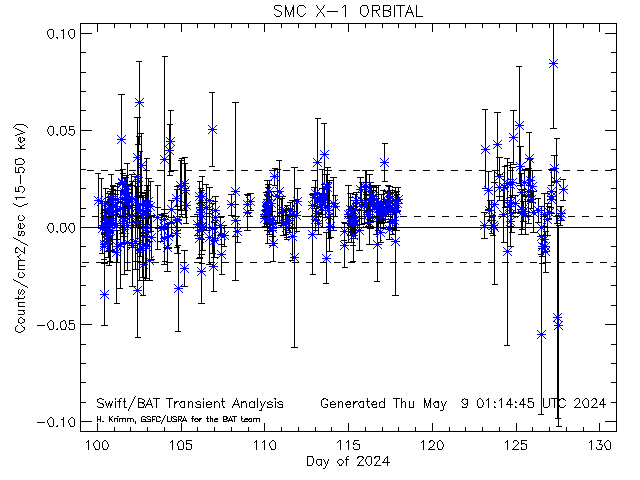
Dashed lines show average rate (and +/- 1 sigma standard deviation) for this source (derived from this plot)
Daily light curves: FITS version ASCII version Orbit light curves: FITS version ASCII version
FLAG (POINTING)--SMCX-1
SMC X-1 [10114] RA= 19.2710 degs; Dec= -73.4430
mean: 0.005796 sdev: 0.024865 thresh: 0.045241 max: 0.045241
--SCALED MAP--(1.00000/72.0000)=(1.38889)--3-SIGMA=(0.13)--------------------------
Possible outbursts for SMC X-1
| |
Count |
UTC Date |
Duration |
Rate |
Error |
Factor |
SNR |
mCrab |
Pcodefr |
MET |
| POINTING |
0 |
2026: 20:23:22: 8 |
1304.0000 |
0.10295686 |
0.023430015 |
2.2757214 |
4.3942293 |
451.56516 |
0.38671875 |
790644128 |
|
 Dashed lines show average rate (and +/- 1 sigma standard deviation) for this source (derived from this plot)
Daily light curves: FITS version ASCII version Orbit light curves: FITS version ASCII version
Dashed lines show average rate (and +/- 1 sigma standard deviation) for this source (derived from this plot)
Daily light curves: FITS version ASCII version Orbit light curves: FITS version ASCII version
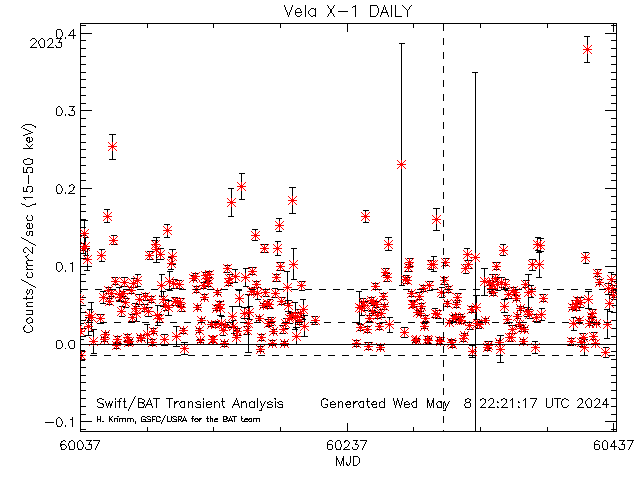
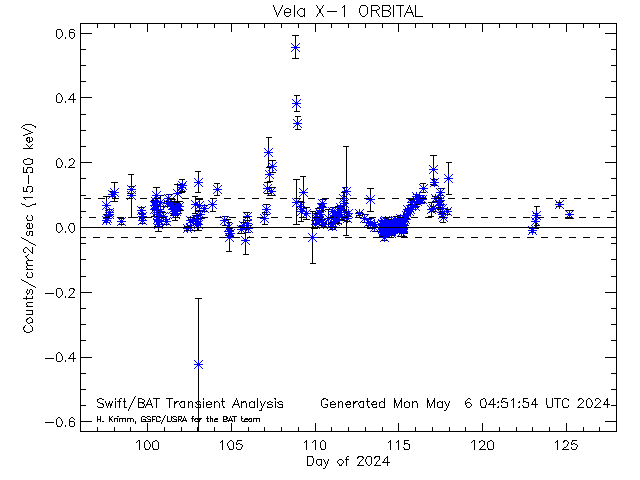
FLAG (EXPOSURE)--VelaX-1
Vela X-1 [10005] RA= 135.529 degs; Dec= -40.5550
mean: 0.030705 sdev: 0.062092 thresh: 0.216981 max: 0.570072
--SCALED MAP--(1.00000/294.000)=(0.340136)--3-SIGMA=(0.13)--------------------------
Possible outbursts for Vela X-1
| |
Count |
UTC Date |
Duration |
Rate |
Error |
Factor |
SNR |
mCrab |
Pcodefr |
MET |
| EXPOSURE |
0 |
0: 0: 0: 0: 0 |
1448.0000 |
0.35953293 |
0.029695176 |
1.6569779 |
12.107452 |
1576.8988 |
0.16980180 |
788589032 |
FLAG (POINTING)--VelaX-1
Vela X-1 [10005] RA= 135.529 degs; Dec= -40.5550
mean: 0.030705 sdev: 0.062092 thresh: 0.216981 max: 0.570072
--SCALED MAP--(1.00000/48.0000)=(2.08333)--3-SIGMA=(0.13)--------------------------
Possible outbursts for Vela X-1
| |
Count |
UTC Date |
Duration |
Rate |
Error |
Factor |
SNR |
mCrab |
Pcodefr |
MET |
| POINTING |
0 |
0: 0: 0: 0: 0 |
1448.0000 |
0.35953293 |
0.029695176 |
1.6569779 |
12.107452 |
1576.8988 |
0.16980180 |
788589032 |
|
 Dashed lines show average rate (and +/- 1 sigma standard deviation) for this source (derived from this plot)
Daily light curves: FITS version ASCII version Orbit light curves: FITS version ASCII version
Dashed lines show average rate (and +/- 1 sigma standard deviation) for this source (derived from this plot)
Daily light curves: FITS version ASCII version Orbit light curves: FITS version ASCII version
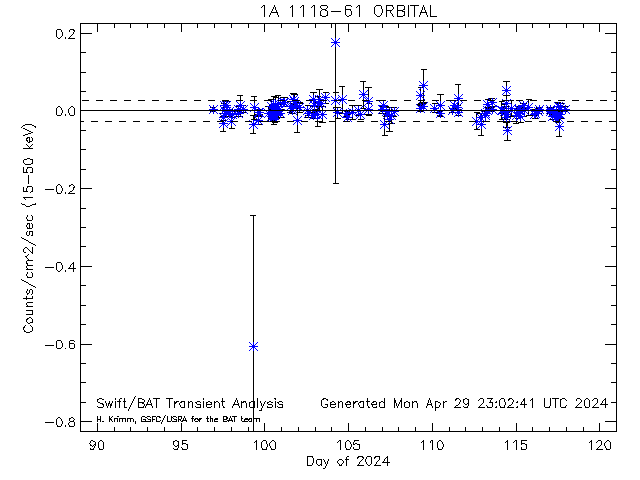
FLAG (EXPOSURE)--1A1118-61
1A 1118-61 [33719] RA= 170.238 degs; Dec= -61.9170
mean: 0.000510 sdev: 0.028518 thresh: 0.086066 max: 0.357780
--SCALED MAP--(22.0000/90.0000)=(24.4444)--3-SIGMA=(0.13)--------------------------
Supressing another 12.0000 points, out of a total of 22.0000
Possible outbursts for 1A 1118-61
| |
Count |
UTC Date |
Duration |
Rate |
Error |
Factor |
SNR |
mCrab |
Pcodefr |
MET |
| EXPOSURE |
0 |
2026: 20:14:56:32 |
64.000000 |
0.097746442 |
0.012231562 |
1.1357176 |
7.9913297 |
428.71246 |
0.74218750 |
790613792 |
| EXPOSURE |
1 |
2026: 20:23:22: 8 |
1304.0000 |
0.10673547 |
0.017889688 |
1.2401613 |
5.9663125 |
468.13803 |
0.20312500 |
790644128 |
| EXPOSURE |
2 |
2026: 20:23:46: 8 |
392.00000 |
0.14581511 |
0.0093176410 |
1.6942283 |
15.649359 |
639.53994 |
0.82031250 |
790645568 |
| EXPOSURE |
3 |
2026: 24: 0: 6:56 |
448.00000 |
0.19901055 |
0.011858586 |
2.3123071 |
16.781980 |
872.85327 |
0.82812500 |
790906016 |
| EXPOSURE |
4 |
2026: 24: 0:32:40 |
64.000000 |
0.17521239 |
0.029971799 |
2.0357959 |
5.8459084 |
768.47539 |
0.31640625 |
790907560 |
| EXPOSURE |
5 |
2026: 24: 0:33:44 |
64.000000 |
0.17370282 |
0.029210879 |
2.0182561 |
5.9465113 |
761.85446 |
0.31640625 |
790907624 |
| EXPOSURE |
6 |
2026: 24: 1:41:36 |
64.000000 |
0.20741055 |
0.029868963 |
2.4099069 |
6.9440159 |
909.69539 |
0.78906250 |
790911696 |
| EXPOSURE |
7 |
2026: 24: 1:44:32 |
320.00000 |
0.17814091 |
0.011182872 |
2.0698224 |
15.929800 |
781.31976 |
0.82031250 |
790911872 |
| EXPOSURE |
8 |
2026: 24: 4:42:16 |
264.00000 |
0.13451370 |
0.031362422 |
1.5629171 |
4.2890088 |
589.97237 |
1.0156250 |
790922536 |
| EXPOSURE |
9 |
2026: 24: 4:55: 4 |
64.000000 |
0.27490743 |
0.024464224 |
3.1941543 |
11.237120 |
1205.7343 |
1.0156250 |
790923304 |
| EXPOSURE |
10 |
2026: 24: 4:56: 8 |
384.00000 |
0.23798223 |
0.013035462 |
2.7651198 |
18.256525 |
1043.7817 |
1.0156250 |
790923368 |
FLAG (POINTING)--1A1118-61
1A 1118-61 [33719] RA= 170.238 degs; Dec= -61.9170
mean: 0.000510 sdev: 0.028518 thresh: 0.086066 max: 0.357780
--SCALED MAP--(11.0000/51.0000)=(21.5686)--3-SIGMA=(0.13)--------------------------
Supressing another 1.00000 points, out of a total of 11.0000
Possible outbursts for 1A 1118-61
| |
Count |
UTC Date |
Duration |
Rate |
Error |
Factor |
SNR |
mCrab |
Pcodefr |
MET |
| POINTING |
0 |
2026: 17: 6:29:36 |
64.000000 |
0.10625256 |
0.014236642 |
1.2345504 |
7.4633162 |
466.01999 |
0.90625000 |
790324176 |
| POINTING |
1 |
2026: 18:11:28:32 |
64.000000 |
0.35778016 |
0.020447017 |
4.1570539 |
17.497914 |
1569.2112 |
1.0156250 |
790428512 |
| POINTING |
2 |
2026: 20:14:44:40 |
776.00000 |
0.10329784 |
0.0069694040 |
1.2002194 |
14.821617 |
453.06068 |
0.74218750 |
790613080 |
| POINTING |
3 |
2026: 20:23:22: 8 |
1304.0000 |
0.10673547 |
0.017889688 |
1.2401613 |
5.9663125 |
468.13803 |
0.22851562 |
790644128 |
| POINTING |
4 |
2026: 20:23:46: 8 |
392.00000 |
0.14581511 |
0.0093176410 |
1.6942283 |
15.649359 |
639.53994 |
0.82031250 |
790645568 |
| POINTING |
5 |
2026: 24: 0: 6:56 |
448.00000 |
0.19901055 |
0.011858586 |
2.3123071 |
16.781980 |
872.85327 |
0.82812500 |
790906016 |
| POINTING |
6 |
2026: 24: 0:32:40 |
128.00000 |
0.17443718 |
0.021674499 |
2.0267887 |
8.0480373 |
765.07533 |
0.31640625 |
790907560 |
| POINTING |
7 |
2026: 24: 1:41:36 |
64.000000 |
0.20741055 |
0.029868963 |
2.4099069 |
6.9440159 |
909.69539 |
0.78906250 |
790911696 |
| POINTING |
8 |
2026: 24: 1:44:32 |
320.00000 |
0.17814091 |
0.011182872 |
2.0698224 |
15.929800 |
781.31976 |
0.82031250 |
790911872 |
| POINTING |
9 |
2026: 24: 4:42:16 |
264.00000 |
0.13451370 |
0.031362422 |
1.5629171 |
4.2890088 |
589.97237 |
1.0156250 |
790922536 |
| POINTING |
10 |
2026: 24: 4:55: 4 |
448.00000 |
0.24176663 |
0.012985844 |
2.8090907 |
18.617707 |
1060.3799 |
1.0156250 |
790923304 |
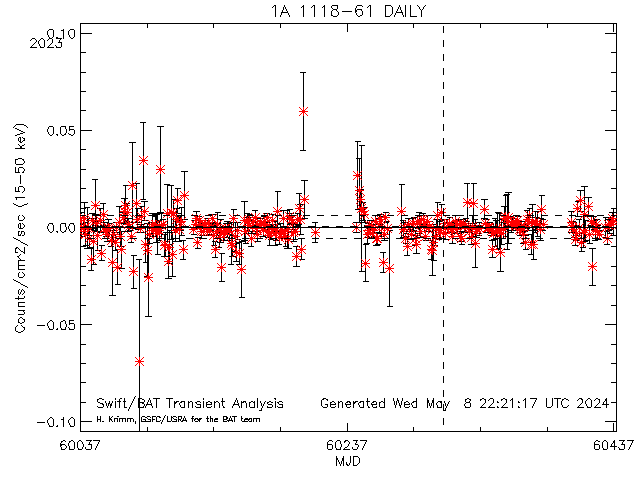
FLAG (DAILY)--1A1118-61
1A 1118-61 [33719] RA= 170.238 degs; Dec= -61.9170
mean: 0.000313 sdev: 0.007145 thresh: 0.021749 max: 0.357780
--SCALED MAP--(4.00000/31.0000)=(0.611316)--3-SIGMA=(0.13)--------------------------
Possible outbursts for 1A 1118-61
| |
Count |
UTC Date |
MJD |
Rate |
Error |
Factor |
SNR |
mCrab |
| DAILY |
0 |
2026: 20 |
61060.000 |
0.10625256 |
0.014236642 |
4.8853995 |
7.4633162 |
466.01999 |
| DAILY |
1 |
2026: 21 |
61061.000 |
0.35778016 |
0.020447017 |
16.450418 |
17.497914 |
1569.2112 |
| DAILY |
2 |
2026: 23 |
61063.000 |
0.091291296 |
0.0049446481 |
4.1974936 |
18.462648 |
400.40041 |
| DAILY |
3 |
2026: 27 |
61067.000 |
0.20664440 |
0.010320633 |
9.5013281 |
20.022454 |
906.33507 |
|
 Dashed lines show average rate (and +/- 1 sigma standard deviation) for this source (derived from this plot)
Daily light curves: FITS version ASCII version Orbit light curves: FITS version ASCII version
Dashed lines show average rate (and +/- 1 sigma standard deviation) for this source (derived from this plot)
Daily light curves: FITS version ASCII version Orbit light curves: FITS version ASCII version
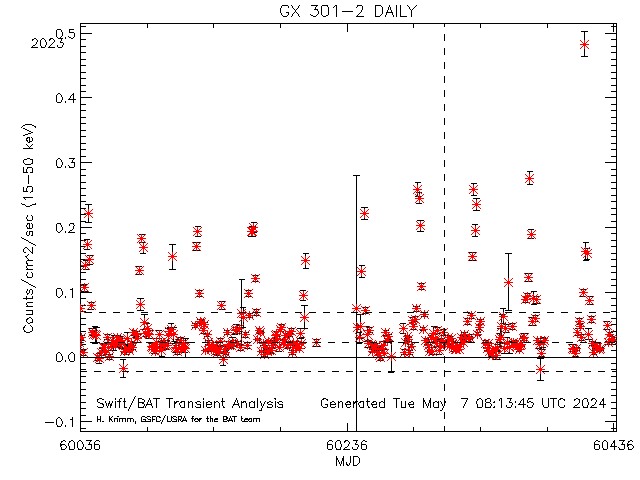
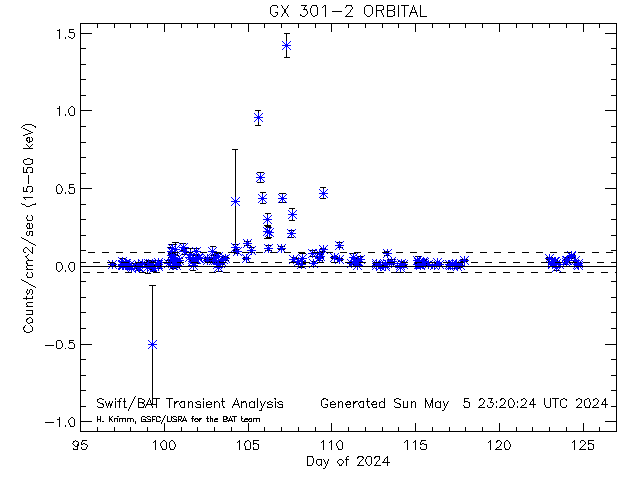
FLAG (EXPOSURE)--GX301-2
GX 301-2 [10051] RA= 186.657 degs; Dec= -62.7700
mean: 0.024082 sdev: 0.063874 thresh: 0.215703 max: 0.980962
--SCALED MAP--(7.00000/282.000)=(2.48227)--3-SIGMA=(0.13)--------------------------
Possible outbursts for GX 301-2
| |
Count |
UTC Date |
Duration |
Rate |
Error |
Factor |
SNR |
mCrab |
Pcodefr |
MET |
| EXPOSURE |
0 |
0: 0: 0: 0: 0 |
328.00000 |
0.29835480 |
0.030187934 |
1.3831761 |
9.8832467 |
1308.5737 |
0.22837296 |
788590152 |
| EXPOSURE |
1 |
0: 0: 0: 0: 0 |
328.00000 |
0.29771591 |
0.030082229 |
1.3802141 |
9.8967369 |
1305.7715 |
0.22837296 |
788590152 |
| EXPOSURE |
2 |
0: 0: 0: 0: 0 |
112.00000 |
0.24908898 |
0.037081281 |
1.1547792 |
6.7173779 |
1092.4955 |
0.25509202 |
788590280 |
| EXPOSURE |
3 |
0: 0: 0: 0: 0 |
112.00000 |
0.24971612 |
0.037164282 |
1.1576866 |
6.7192504 |
1095.2461 |
0.25509202 |
788590280 |
| EXPOSURE |
4 |
0: 0: 0: 0: 0 |
88.000000 |
0.24286433 |
0.040041733 |
1.1259216 |
6.0652802 |
1065.1944 |
0.22837296 |
788590392 |
| EXPOSURE |
5 |
0: 0: 0: 0: 0 |
88.000000 |
0.24375086 |
0.040151459 |
1.1300316 |
6.0707845 |
1069.0827 |
0.22837296 |
788590392 |
| EXPOSURE |
6 |
0: 0: 0: 0: 0 |
64.000000 |
0.22273337 |
0.020590540 |
1.0325943 |
10.817267 |
976.90072 |
0.57031250 |
788609208 |
FLAG (POINTING)--GX301-2
GX 301-2 [10051] RA= 186.657 degs; Dec= -62.7700
mean: 0.024082 sdev: 0.063874 thresh: 0.215703 max: 0.980962
--SCALED MAP--(1.00000/54.0000)=(1.85185)--3-SIGMA=(0.13)--------------------------
Possible outbursts for GX 301-2
| |
Count |
UTC Date |
Duration |
Rate |
Error |
Factor |
SNR |
mCrab |
Pcodefr |
MET |
| POINTING |
0 |
0: 0: 0: 0: 0 |
328.00000 |
0.29835480 |
0.030187934 |
1.3831761 |
9.8832467 |
1308.5737 |
0.22837296 |
788590152 |
|
 Dashed lines show average rate (and +/- 1 sigma standard deviation) for this source (derived from this plot)
Daily light curves: FITS version ASCII version Orbit light curves: FITS version ASCII version
Dashed lines show average rate (and +/- 1 sigma standard deviation) for this source (derived from this plot)
Daily light curves: FITS version ASCII version Orbit light curves: FITS version ASCII version
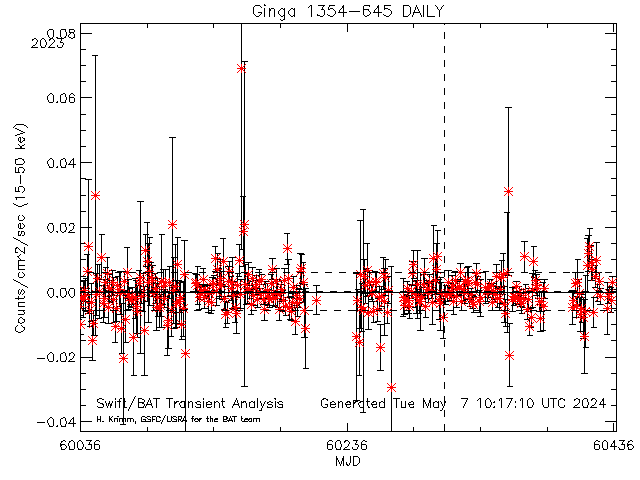
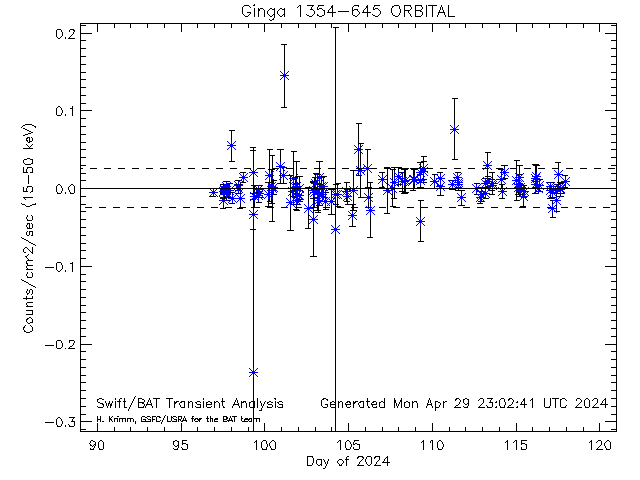
FLAG (DAILY)--Ginga1354-645
Ginga 1354-645 [33886] RA= 209.541 degs; Dec= -64.7350
mean: 0.000270 sdev: 0.005876 thresh: 0.017898 max: 0.071904
--SCALED MAP--(9.00000/31.0000)=(1.37219)--3-SIGMA=(0.13)--------------------------
Possible outbursts for Ginga 1354-645
| |
Count |
UTC Date |
MJD |
Rate |
Error |
Factor |
SNR |
mCrab |
| DAILY |
0 |
2026: 0 |
61040.000 |
0.022313386 |
0.0053823014 |
1.2466676 |
4.1456962 |
97.865728 |
| DAILY |
1 |
2026: 2 |
61042.000 |
0.024427115 |
0.0024454819 |
1.3647634 |
9.9886712 |
107.13647 |
| DAILY |
2 |
2026: 10 |
61050.000 |
0.051088970 |
0.0037216074 |
2.8543836 |
13.727662 |
224.07443 |
| DAILY |
3 |
2026: 11 |
61051.000 |
0.052086981 |
0.0038025182 |
2.9101433 |
13.698023 |
228.45167 |
| DAILY |
4 |
2026: 12 |
61052.000 |
0.052327616 |
0.0048788468 |
2.9235878 |
10.725407 |
229.50708 |
| DAILY |
5 |
2026: 20 |
61060.000 |
0.049511131 |
0.012606617 |
2.7662284 |
3.9273924 |
217.15408 |
| DAILY |
6 |
2026: 21 |
61061.000 |
0.058088426 |
0.017264587 |
3.2454491 |
3.3645997 |
254.77379 |
| DAILY |
7 |
2026: 23 |
61063.000 |
0.054294830 |
0.0040152477 |
3.0334977 |
13.522162 |
238.13522 |
| DAILY |
8 |
2026: 27 |
61067.000 |
0.051040667 |
0.0046026052 |
2.8516849 |
11.089517 |
223.86257 |
|
 Dashed lines show average rate (and +/- 1 sigma standard deviation) for this source (derived from this plot)
Daily light curves: FITS version ASCII version Orbit light curves: FITS version ASCII version
Dashed lines show average rate (and +/- 1 sigma standard deviation) for this source (derived from this plot)
Daily light curves: FITS version ASCII version Orbit light curves: FITS version ASCII version
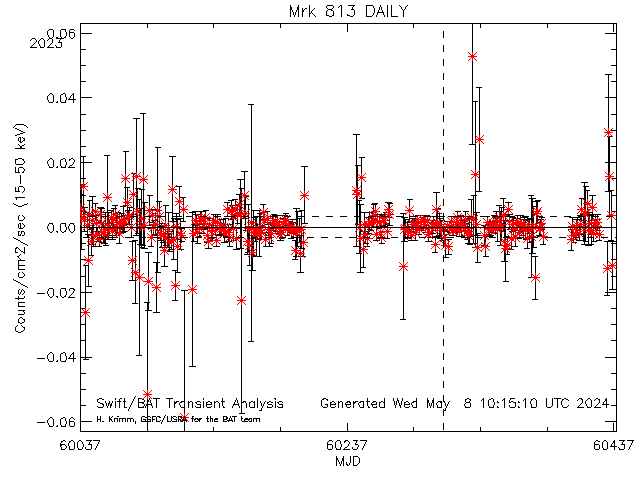
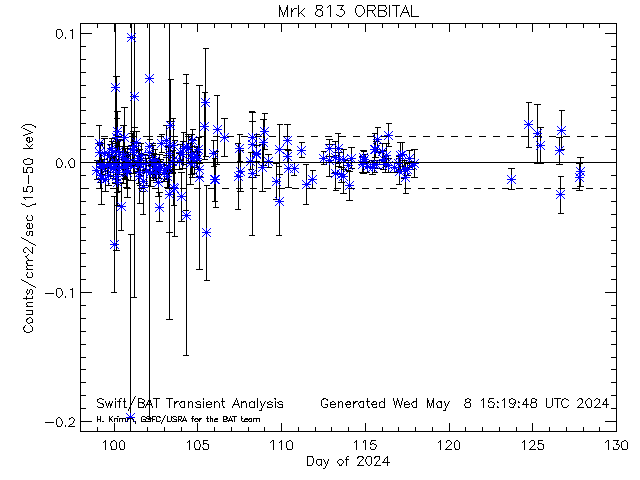
FLAG (POINTING)--Mrk813
Mrk 813 [20063] RA= 216.854 degs; Dec= 19.8310
mean: 0.000076 sdev: 0.020504 thresh: 0.052862 max: 0.052862
--SCALED MAP--(1.00000/50.0000)=(2.00000)--3-SIGMA=(0.13)--------------------------
Possible outbursts for Mrk 813
| |
Count |
UTC Date |
Duration |
Rate |
Error |
Factor |
SNR |
mCrab |
Pcodefr |
MET |
| POINTING |
0 |
2026: 7:13:48: 0 |
536.00000 |
0.076944948 |
0.018348684 |
1.4555756 |
4.1934860 |
337.47784 |
0.19140625 |
789486480 |
|
 Dashed lines show average rate (and +/- 1 sigma standard deviation) for this source (derived from this plot)
Daily light curves: FITS version ASCII version Orbit light curves: FITS version ASCII version
Dashed lines show average rate (and +/- 1 sigma standard deviation) for this source (derived from this plot)
Daily light curves: FITS version ASCII version Orbit light curves: FITS version ASCII version
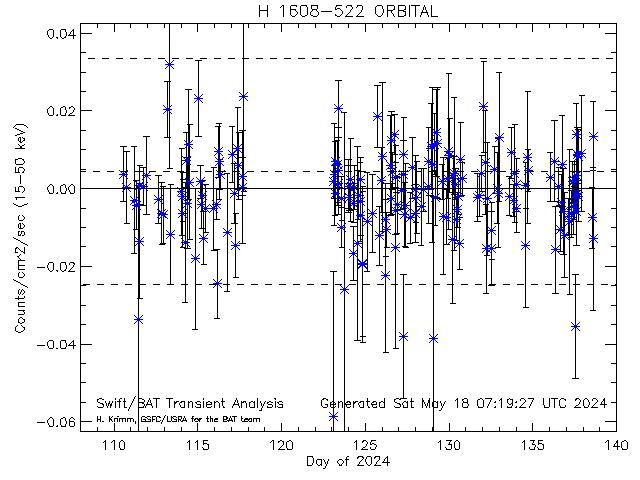
FLAG (POINTING)--H1608-522
H 1608-522 [10067] RA= 243.179 degs; Dec= -52.4230
mean: 0.004306 sdev: 0.029346 thresh: 0.092345 max: 0.265516
--SCALED MAP--(3.00000/48.0000)=(6.25000)--3-SIGMA=(0.13)--------------------------
Possible outbursts for H 1608-522
| |
Count |
UTC Date |
Duration |
Rate |
Error |
Factor |
SNR |
mCrab |
Pcodefr |
MET |
| POINTING |
0 |
0: 0: 0: 0: 0 |
448.00000 |
0.11390013 |
0.037796381 |
1.2334199 |
3.0135194 |
499.56194 |
0.11800725 |
788585008 |
| POINTING |
1 |
0: 0: 0: 0: 0 |
136.00000 |
0.10999885 |
0.026910487 |
1.1911731 |
4.0875830 |
482.45108 |
0.21679688 |
788612608 |
| POINTING |
2 |
2026: 24: 4:55: 4 |
448.00000 |
0.092999443 |
0.027584222 |
1.0070873 |
3.3714724 |
407.89229 |
0.12535091 |
790923304 |
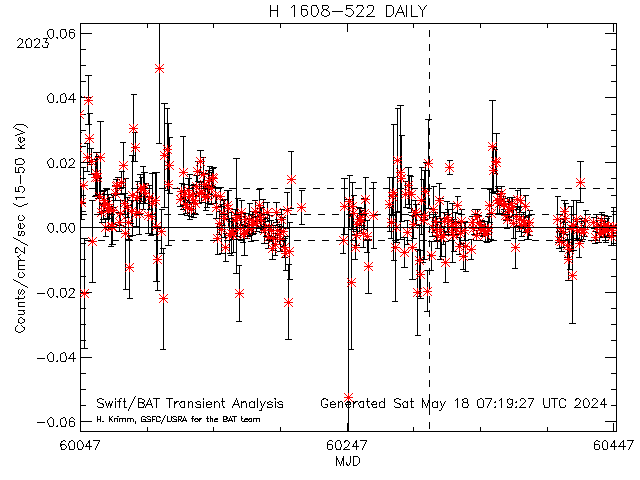
FLAG (DAILY)--H1608-522
H 1608-522 [10067] RA= 243.179 degs; Dec= -52.4230
mean: 0.004107 sdev: 0.008999 thresh: 0.031104 max: 0.265516
--SCALED MAP--(2.00000/31.0000)=(0.971437)--3-SIGMA=(0.13)--------------------------
Possible outbursts for H 1608-522
| |
Count |
UTC Date |
MJD |
Rate |
Error |
Factor |
SNR |
mCrab |
| DAILY |
0 |
2026: 0 |
61040.000 |
0.058687906 |
0.0076269754 |
1.8868397 |
7.6947811 |
257.40309 |
| DAILY |
1 |
2026: 2 |
61042.000 |
0.035070188 |
0.0028574919 |
1.1275206 |
12.273066 |
153.81661 |
|
 Dashed lines show average rate (and +/- 1 sigma standard deviation) for this source (derived from this plot)
Daily light curves: FITS version ASCII version Orbit light curves: FITS version ASCII version
Dashed lines show average rate (and +/- 1 sigma standard deviation) for this source (derived from this plot)
Daily light curves: FITS version ASCII version Orbit light curves: FITS version ASCII version
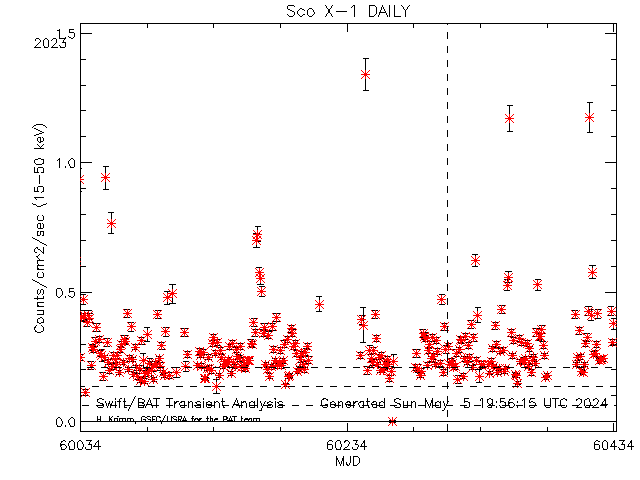
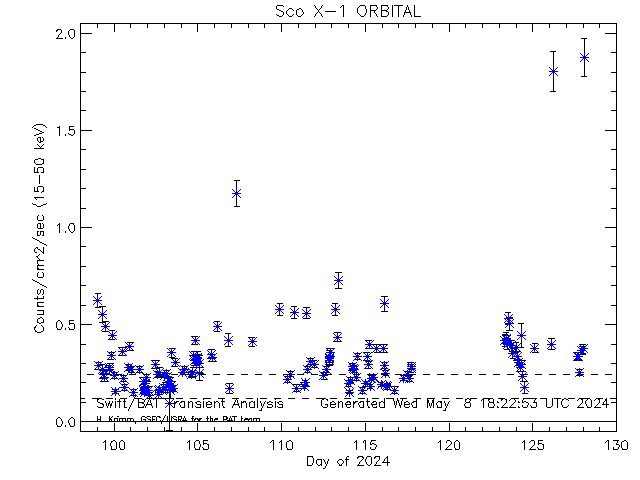
FLAG (EXPOSURE)--ScoX-1
Sco X-1 [10003] RA= 244.979 degs; Dec= -15.6400
mean: 0.124979 sdev: 0.129605 thresh: 0.513793 max: 1.339609
--SCALED MAP--(1.00000/210.000)=(0.476190)--3-SIGMA=(0.13)--------------------------
Possible outbursts for Sco X-1
| |
Count |
UTC Date |
Duration |
Rate |
Error |
Factor |
SNR |
mCrab |
Pcodefr |
MET |
| EXPOSURE |
0 |
0: 0: 0: 0: 0 |
64.000000 |
0.69339186 |
0.064995727 |
1.3495549 |
10.668268 |
3041.1923 |
0.32055664 |
788612608 |
FLAG (POINTING)--ScoX-1
Sco X-1 [10003] RA= 244.979 degs; Dec= -15.6400
mean: 0.124979 sdev: 0.129605 thresh: 0.513793 max: 1.339609
--SCALED MAP--(1.00000/40.0000)=(2.50000)--3-SIGMA=(0.13)--------------------------
Possible outbursts for Sco X-1
| |
Count |
UTC Date |
Duration |
Rate |
Error |
Factor |
SNR |
mCrab |
Pcodefr |
MET |
| POINTING |
0 |
0: 0: 0: 0: 0 |
64.000000 |
0.69339186 |
0.064995727 |
1.3495549 |
10.668268 |
3041.1923 |
0.32055664 |
788612608 |
FLAG (DAILY)--ScoX-1
Sco X-1 [10003] RA= 244.979 degs; Dec= -15.6400
mean: 0.140245 sdev: 0.076379 thresh: 0.369381 max: 1.339609
--SCALED MAP--(1.00000/31.0000)=(8.73801)--3-SIGMA=(0.13)--------------------------
Possible outbursts for Sco X-1
| |
Count |
UTC Date |
MJD |
Rate |
Error |
Factor |
SNR |
mCrab |
| DAILY |
0 |
2026: 0 |
61040.000 |
0.69339186 |
0.064995727 |
1.8771717 |
10.668268 |
3041.1923 |
|
 Dashed lines show average rate (and +/- 1 sigma standard deviation) for this source (derived from this plot)
Daily light curves: FITS version ASCII version Orbit light curves: FITS version ASCII version
Dashed lines show average rate (and +/- 1 sigma standard deviation) for this source (derived from this plot)
Daily light curves: FITS version ASCII version Orbit light curves: FITS version ASCII version
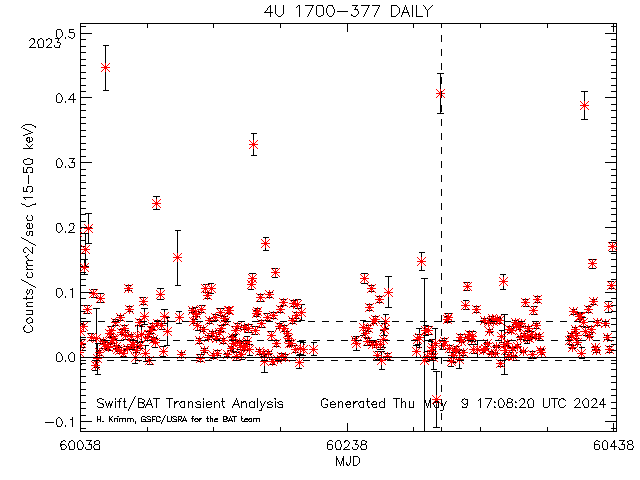
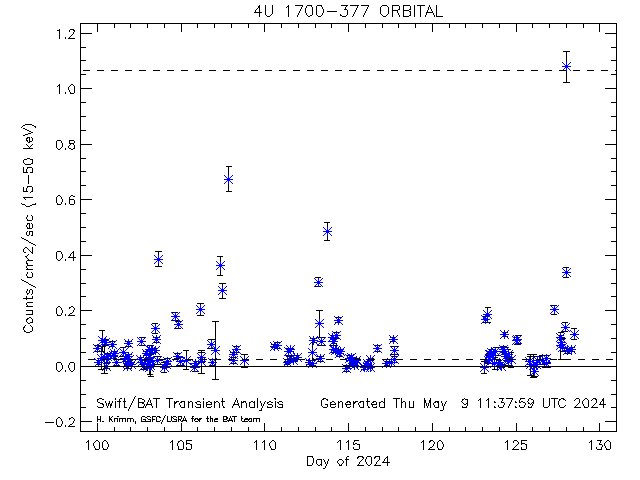
FLAG (DAILY)--4U1700-377
4U 1700-377 [10029] RA= 255.987 degs; Dec= -37.8440
mean: 0.025126 sdev: 0.031280 thresh: 0.118965 max: 0.491605
--SCALED MAP--(1.00000/31.0000)=(1.66867)--3-SIGMA=(0.13)--------------------------
Possible outbursts for 4U 1700-377
| |
Count |
UTC Date |
MJD |
Rate |
Error |
Factor |
SNR |
mCrab |
| DAILY |
0 |
2026: 0 |
61040.000 |
0.20873417 |
0.020593907 |
1.7545888 |
10.135725 |
915.50074 |
|
 Dashed lines show average rate (and +/- 1 sigma standard deviation) for this source (derived from this plot)
Daily light curves: FITS version ASCII version Orbit light curves: FITS version ASCII version
Dashed lines show average rate (and +/- 1 sigma standard deviation) for this source (derived from this plot)
Daily light curves: FITS version ASCII version Orbit light curves: FITS version ASCII version
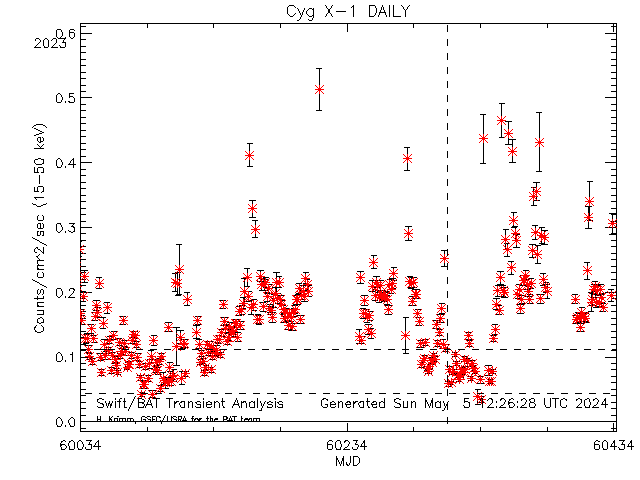
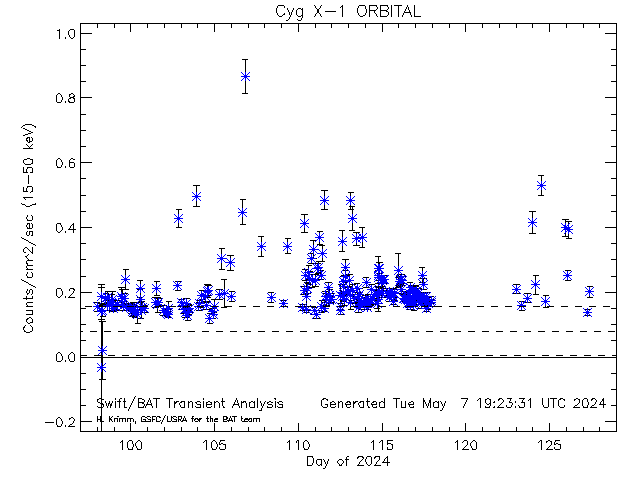
FLAG (EXPOSURE)--CygX-1
Cyg X-1 [10002] RA= 299.591 degs; Dec= 35.2020
mean: 0.081440 sdev: 0.081751 thresh: 0.326694 max: 0.715070
--SCALED MAP--(2.00000/260.000)=(0.769231)--3-SIGMA=(0.13)--------------------------
Possible outbursts for Cyg X-1
| |
Count |
UTC Date |
Duration |
Rate |
Error |
Factor |
SNR |
mCrab |
Pcodefr |
MET |
| EXPOSURE |
0 |
2026: 8: 6:48: 8 |
408.00000 |
0.61225464 |
0.033515685 |
1.8740914 |
18.267705 |
2685.3273 |
0.31862766 |
789547688 |
| EXPOSURE |
1 |
2026: 8:11:30:32 |
624.00000 |
0.44118165 |
0.027661416 |
1.3504425 |
15.949351 |
1935.0072 |
0.22654964 |
789564632 |
FLAG (POINTING)--CygX-1
Cyg X-1 [10002] RA= 299.591 degs; Dec= 35.2020
mean: 0.081440 sdev: 0.081751 thresh: 0.326694 max: 0.715070
--SCALED MAP--(2.00000/49.0000)=(4.08163)--3-SIGMA=(0.13)--------------------------
Possible outbursts for Cyg X-1
| |
Count |
UTC Date |
Duration |
Rate |
Error |
Factor |
SNR |
mCrab |
Pcodefr |
MET |
| POINTING |
0 |
2026: 8: 6:48: 8 |
408.00000 |
0.61225464 |
0.033515685 |
1.8740914 |
18.267705 |
2685.3273 |
0.31862766 |
789547688 |
| POINTING |
1 |
2026: 8:11:30:32 |
624.00000 |
0.44118165 |
0.027661416 |
1.3504425 |
15.949351 |
1935.0072 |
0.22654964 |
789564632 |
|
 Dashed lines show average rate (and +/- 1 sigma standard deviation) for this source (derived from this plot)
Daily light curves: FITS version ASCII version Orbit light curves: FITS version ASCII version
Dashed lines show average rate (and +/- 1 sigma standard deviation) for this source (derived from this plot)
Daily light curves: FITS version ASCII version Orbit light curves: FITS version ASCII version
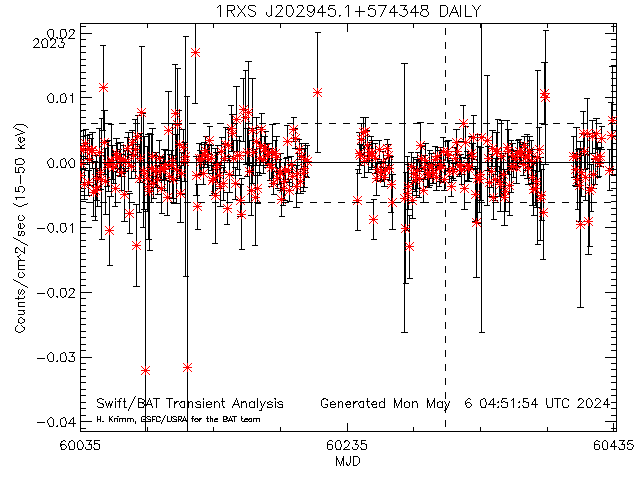
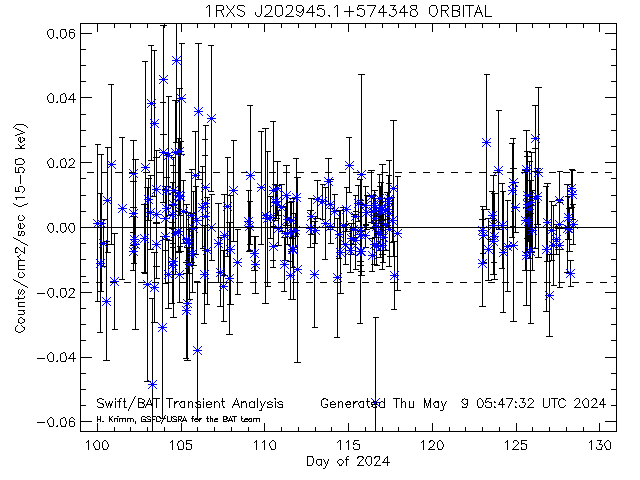
FLAG (EXPOSURE)--1RXSJ202945.1+574348
1RXS J202945.1+574348 [33688] RA= 307.438 degs; Dec= 57.7300
mean: 0.000005 sdev: 0.018239 thresh: 0.054722 max: 0.076044
--SCALED MAP--(2.00000/110.000)=(1.81818)--3-SIGMA=(0.13)--------------------------
Possible outbursts for 1RXS J202945.1+574348
| |
Count |
UTC Date |
Duration |
Rate |
Error |
Factor |
SNR |
mCrab |
Pcodefr |
MET |
| EXPOSURE |
0 |
2026: 16:17:13:52 |
64.000000 |
0.22725792 |
0.062543178 |
4.1529731 |
3.6336164 |
996.74523 |
0.13671875 |
790276432 |
| EXPOSURE |
1 |
2026: 16:17:13:52 |
64.000000 |
0.18790885 |
0.049352639 |
3.4338976 |
3.8074732 |
824.16161 |
0.13671875 |
790276432 |
|
 Dashed lines show average rate (and +/- 1 sigma standard deviation) for this source (derived from this plot)
Daily light curves: FITS version ASCII version Orbit light curves: FITS version ASCII version
Dashed lines show average rate (and +/- 1 sigma standard deviation) for this source (derived from this plot)
Daily light curves: FITS version ASCII version Orbit light curves: FITS version ASCII version
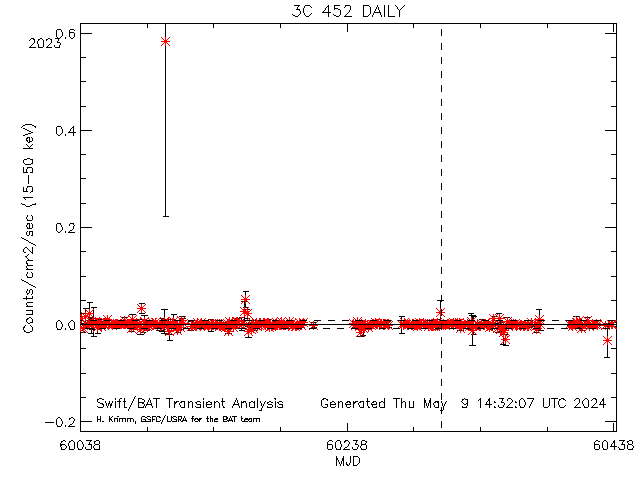
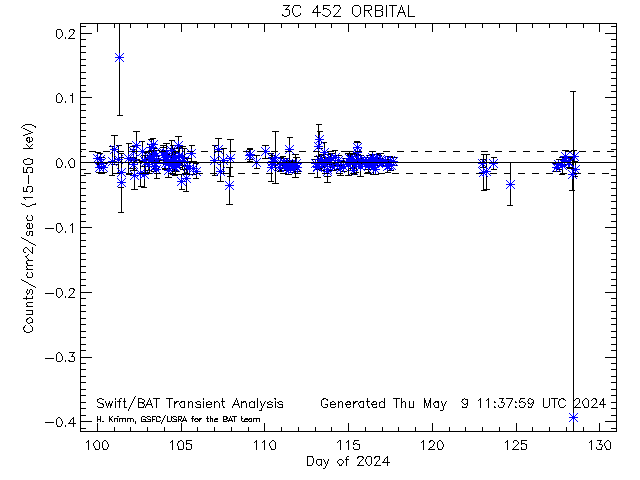
FLAG (DAILY)--3C452
3C 452 [20175] RA= 341.455 degs; Dec= 39.6875
mean: 0.000206 sdev: 0.003633 thresh: 0.011107 max: 0.061282
--SCALED MAP--(1.00000/31.0000)=(0.818495)--3-SIGMA=(0.13)--------------------------
Possible outbursts for 3C 452
| |
Count |
UTC Date |
MJD |
Rate |
Error |
Factor |
SNR |
mCrab |
| DAILY |
0 |
2026: 27 |
61067.000 |
0.011455341 |
0.0028608158 |
1.0314022 |
4.0042217 |
50.242721 |
This page was last modified on Tue Jan 27 07:49:59 UTC 2026