Swift/BAT sources with interesting possible outbursts
Please Read Before Using These Results:README
Main page
|
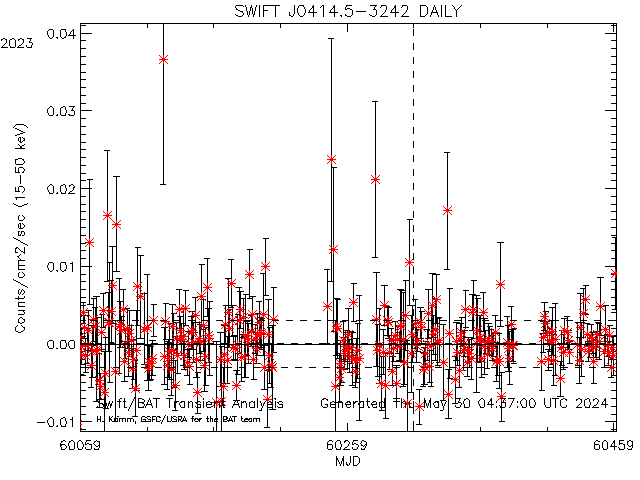
 Dashed lines show average rate (and +/- 1 sigma standard deviation) for this source (derived from this plot)
Daily light curves: FITS version ASCII version Orbit light curves: FITS version ASCII version
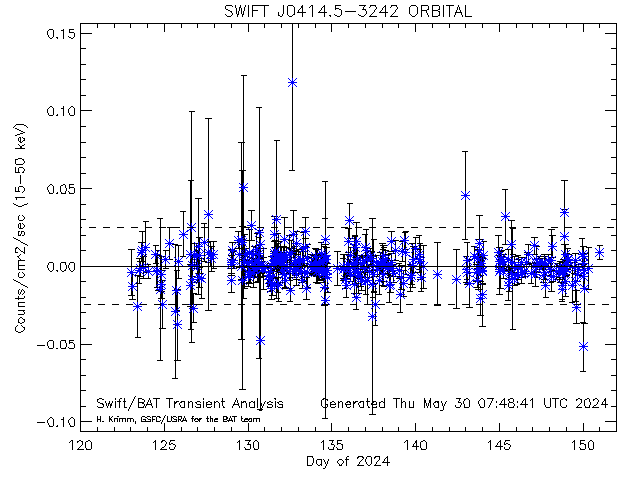
Dashed lines show average rate (and +/- 1 sigma standard deviation) for this source (derived from this plot)
Daily light curves: FITS version ASCII version Orbit light curves: FITS version ASCII version
FLAG (POINTING)--SWIFTJ0414.5-3242
SWIFT J0414.5-3242 [33931] RA= 63.6480 degs; Dec= -32.7140
mean: 0.000038 sdev: 0.025861 thresh: 0.053874 max: 0.053874
--SCALED MAP--(1.00000/7.00000)=(14.2857)--3-SIGMA=(0.13)--------------------------
Possible outbursts for SWIFT J0414.5-3242
| |
Count |
UTC Date |
Duration |
Rate |
Error |
Factor |
SNR |
mCrab |
Pcodefr |
MET |
| POINTING |
0 |
2026: 71: 3:39:12 |
192.00000 |
0.10586829 |
0.026164942 |
1.9651221 |
4.0461886 |
464.33459 |
0.11230469 |
794979552 |
|
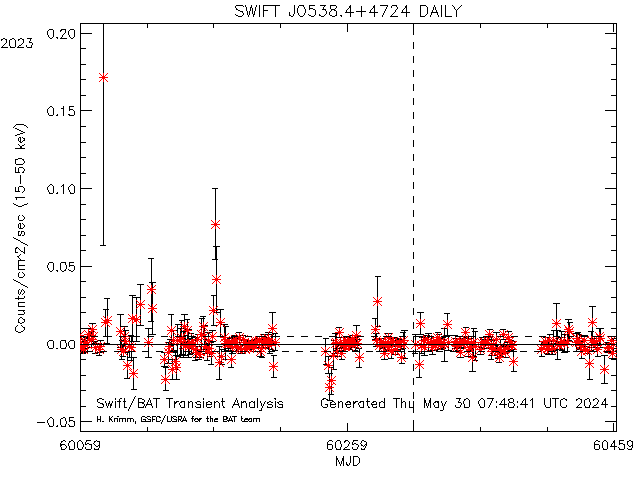
 Dashed lines show average rate (and +/- 1 sigma standard deviation) for this source (derived from this plot)
Daily light curves: FITS version ASCII version Orbit light curves: FITS version ASCII version
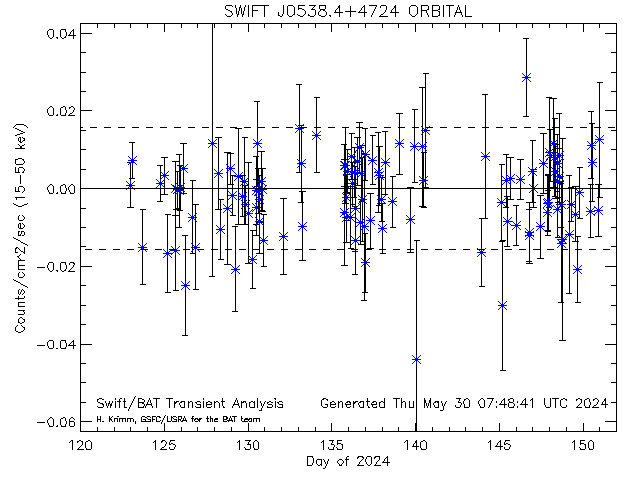
Dashed lines show average rate (and +/- 1 sigma standard deviation) for this source (derived from this plot)
Daily light curves: FITS version ASCII version Orbit light curves: FITS version ASCII version
FLAG (POINTING)--SWIFTJ0538.4+4724
SWIFT J0538.4+4724 [33994] RA= 84.6130 degs; Dec= 47.4020
mean:-0.000028 sdev: 0.016750 thresh: 0.050224 max: 0.171260
--SCALED MAP--(1.00000/26.0000)=(3.84615)--3-SIGMA=(0.13)--------------------------
Possible outbursts for SWIFT J0538.4+4724
| |
Count |
UTC Date |
Duration |
Rate |
Error |
Factor |
SNR |
mCrab |
Pcodefr |
MET |
| POINTING |
0 |
2026: 71: 5:53:36 |
192.00000 |
0.061182039 |
0.013458456 |
1.2181907 |
4.5459925 |
268.34227 |
0.22070312 |
794987616 |
|
 Dashed lines show average rate (and +/- 1 sigma standard deviation) for this source (derived from this plot)
Daily light curves: FITS version ASCII version Orbit light curves: FITS version ASCII version
Dashed lines show average rate (and +/- 1 sigma standard deviation) for this source (derived from this plot)
Daily light curves: FITS version ASCII version Orbit light curves: FITS version ASCII version
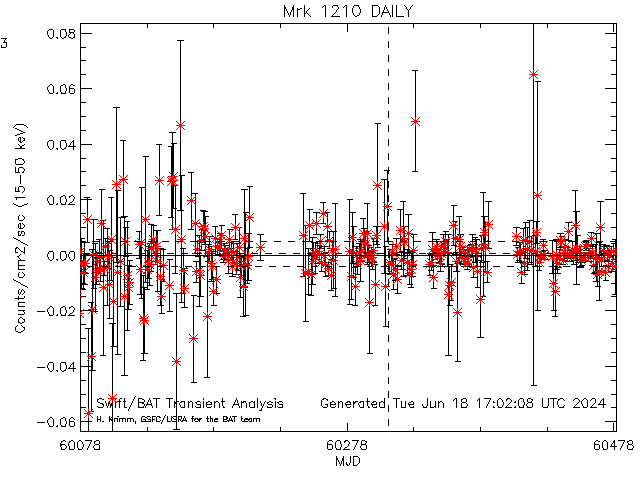
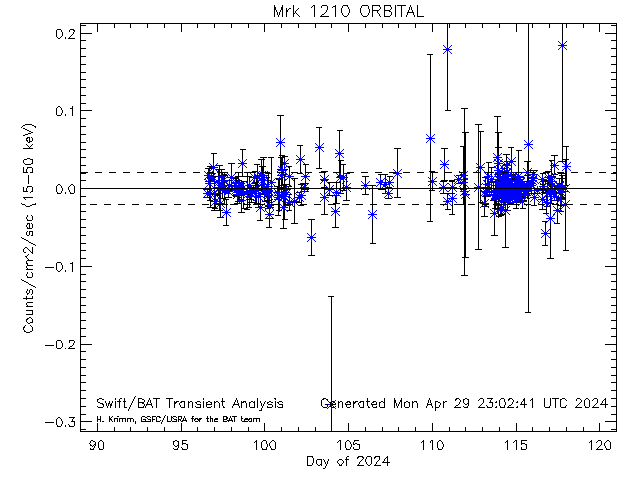
FLAG (POINTING)--Mrk1210
Mrk 1210 [33971] RA= 121.024 degs; Dec= 5.11400
mean: 0.000480 sdev: 0.021234 thresh: 0.064183 max: 0.216660
--SCALED MAP--(1.00000/6.00000)=(16.6667)--3-SIGMA=(0.13)--------------------------
Possible outbursts for Mrk 1210
| |
Count |
UTC Date |
Duration |
Rate |
Error |
Factor |
SNR |
mCrab |
Pcodefr |
MET |
| POINTING |
0 |
2026: 70:18:11:44 |
192.00000 |
0.10588297 |
0.021597384 |
1.6497084 |
4.9025832 |
464.39898 |
0.20312500 |
794945504 |
|
 Dashed lines show average rate (and +/- 1 sigma standard deviation) for this source (derived from this plot)
Daily light curves: FITS version ASCII version Orbit light curves: FITS version ASCII version
Dashed lines show average rate (and +/- 1 sigma standard deviation) for this source (derived from this plot)
Daily light curves: FITS version ASCII version Orbit light curves: FITS version ASCII version
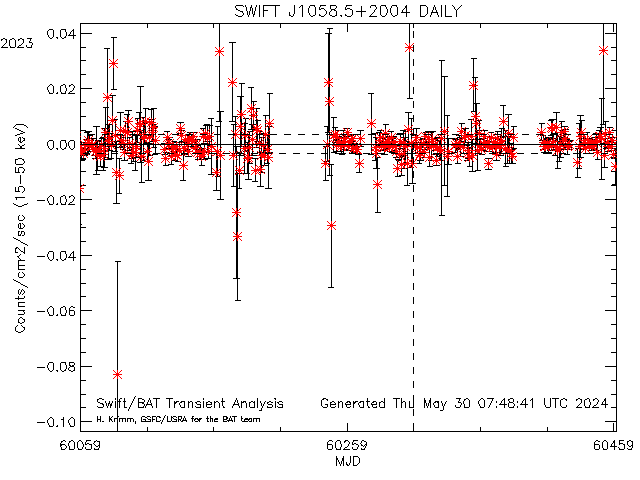
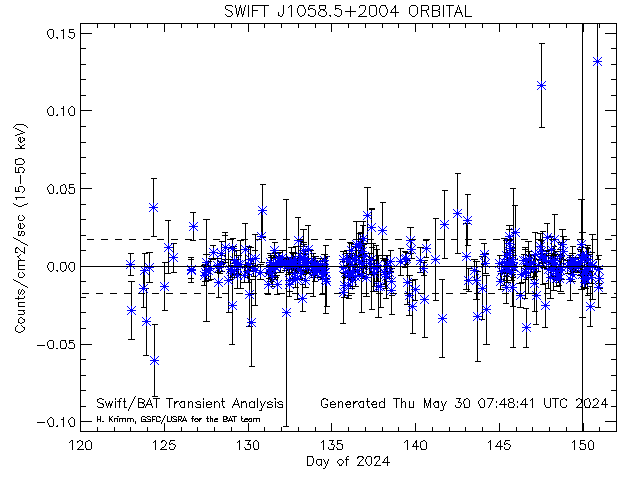
FLAG (DAILY)--SWIFTJ1058.5+2004
SWIFT J1058.5+2004 [33591] RA= 164.622 degs; Dec= 20.0672
mean: 0.000005 sdev: 0.003655 thresh: 0.010970 max: 0.044149
--SCALED MAP--(1.00000/31.0000)=(0.818115)--3-SIGMA=(0.13)--------------------------
Possible outbursts for SWIFT J1058.5+2004
| |
Count |
UTC Date |
MJD |
Rate |
Error |
Factor |
SNR |
mCrab |
| DAILY |
0 |
2026: 73 |
61113.000 |
0.012271265 |
0.0030480552 |
1.1186548 |
4.0259327 |
53.821337 |
|
 Dashed lines show average rate (and +/- 1 sigma standard deviation) for this source (derived from this plot)
Daily light curves: FITS version ASCII version Orbit light curves: FITS version ASCII version
Dashed lines show average rate (and +/- 1 sigma standard deviation) for this source (derived from this plot)
Daily light curves: FITS version ASCII version Orbit light curves: FITS version ASCII version
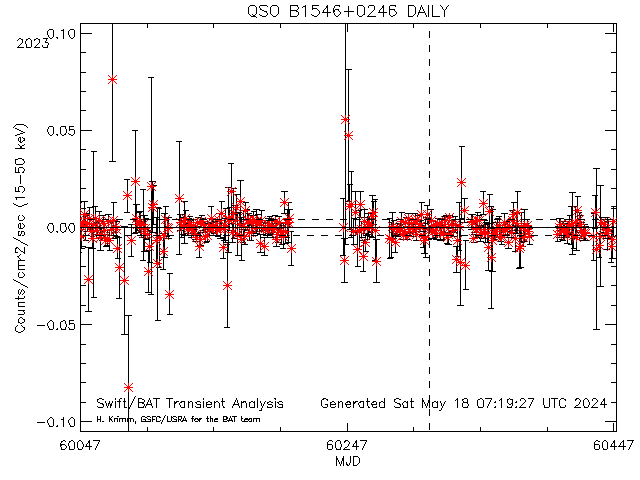
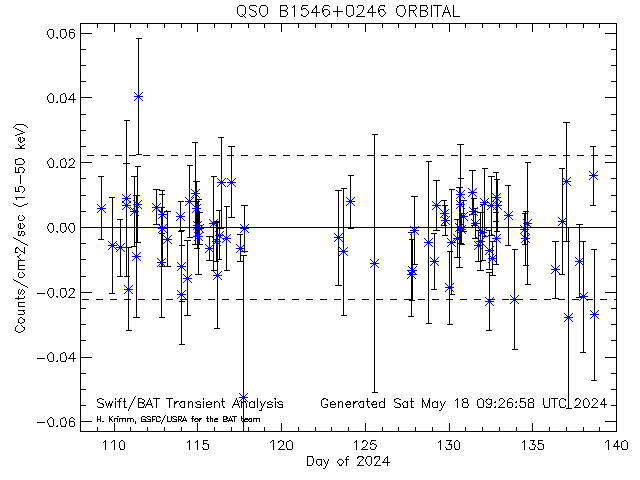
FLAG (DAILY)--QSOB1546+0246
QSO B1546+0246 [33084] RA= 237.373 degs; Dec= 2.61699
mean: 0.000016 sdev: 0.004380 thresh: 0.013155 max: 0.076310
--SCALED MAP--(1.00000/31.0000)=(0.775639)--3-SIGMA=(0.13)--------------------------
Possible outbursts for QSO B1546+0246
| |
Count |
UTC Date |
MJD |
Rate |
Error |
Factor |
SNR |
mCrab |
| DAILY |
0 |
2026: 73 |
61113.000 |
0.014789639 |
0.0034539550 |
1.1242487 |
4.2819431 |
64.866836 |
|
 Dashed lines show average rate (and +/- 1 sigma standard deviation) for this source (derived from this plot)
Daily light curves: FITS version ASCII version Orbit light curves: FITS version ASCII version
Dashed lines show average rate (and +/- 1 sigma standard deviation) for this source (derived from this plot)
Daily light curves: FITS version ASCII version Orbit light curves: FITS version ASCII version
FLAG (EXPOSURE)--Ginga1843+00
Ginga 1843+00 [10563] RA= 281.404 degs; Dec= 0.863000
mean: 0.000347 sdev: 0.021135 thresh: 0.062416 max: 0.062416
--SCALED MAP--(2.00000/15.0000)=(13.3333)--3-SIGMA=(0.13)--------------------------
Possible outbursts for Ginga 1843+00
| |
Count |
UTC Date |
Duration |
Rate |
Error |
Factor |
SNR |
mCrab |
Pcodefr |
MET |
| EXPOSURE |
0 |
2026: 70:19:11:36 |
64.000000 |
0.078972433 |
0.022443082 |
1.2652504 |
3.5187873 |
346.37031 |
0.31250000 |
794949096 |
| EXPOSURE |
1 |
2026: 70:19:11:36 |
64.000000 |
0.078972466 |
0.022442988 |
1.2652510 |
3.5188036 |
346.37046 |
0.31250000 |
794949096 |
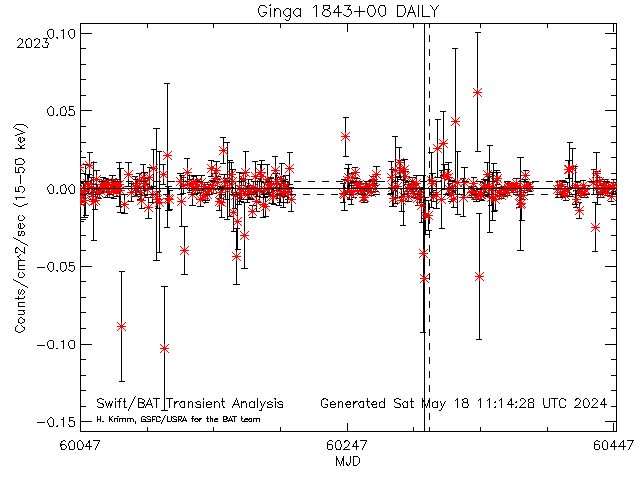
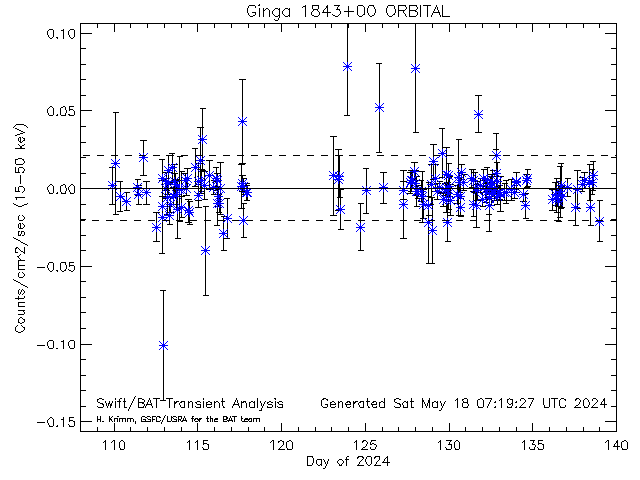
FLAG (DAILY)--Ginga1843+00
Ginga 1843+00 [10563] RA= 281.404 degs; Dec= 0.863000
mean: 0.000316 sdev: 0.004657 thresh: 0.014287 max: 0.062416
--SCALED MAP--(1.00000/31.0000)=(0.830827)--3-SIGMA=(0.13)--------------------------
Possible outbursts for Ginga 1843+00
| |
Count |
UTC Date |
MJD |
Rate |
Error |
Factor |
SNR |
mCrab |
| DAILY |
0 |
2026: 73 |
61113.000 |
0.056132781 |
0.0084648185 |
3.9290594 |
6.6313036 |
246.19641 |
|
 Dashed lines show average rate (and +/- 1 sigma standard deviation) for this source (derived from this plot)
Daily light curves: FITS version ASCII version Orbit light curves: FITS version ASCII version
Dashed lines show average rate (and +/- 1 sigma standard deviation) for this source (derived from this plot)
Daily light curves: FITS version ASCII version Orbit light curves: FITS version ASCII version
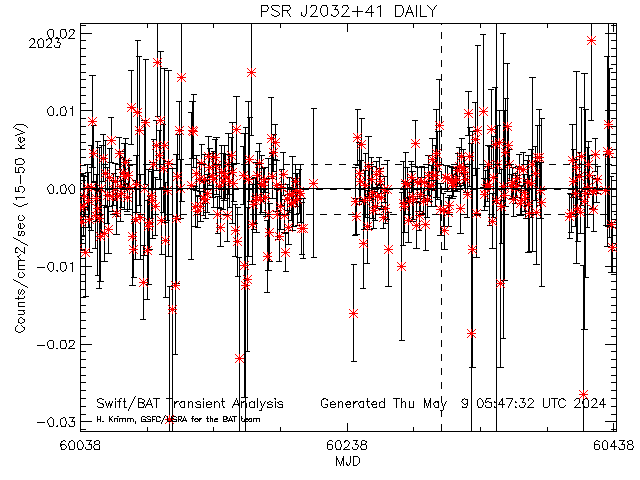
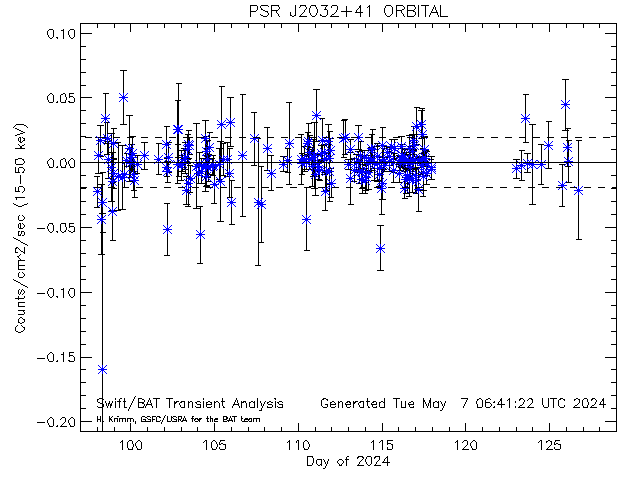
FLAG (POINTING)--PSRJ2032+41
PSR J2032+41 [34141] RA= 308.058 degs; Dec= 41.3760
mean:-0.000050 sdev: 0.020665 thresh: 0.027241 max: 0.027241
--SCALED MAP--(1.00000/31.0000)=(3.22581)--3-SIGMA=(0.13)--------------------------
Possible outbursts for PSR J2032+41
| |
Count |
UTC Date |
Duration |
Rate |
Error |
Factor |
SNR |
mCrab |
Pcodefr |
MET |
| POINTING |
0 |
2026: 71: 1:13:36 |
200.00000 |
0.035969982 |
0.0074551377 |
1.3204231 |
4.8248581 |
157.76307 |
0.63281250 |
794970816 |
This page was last modified on Thu Mar 12 23:04:23 UTC 2026